


After-Tax NPV (5%) of US$1,802 million, After-Tax IRR of 111%, Initial Costs of US$173 million, Average Annual Production of 17.4 million oz AgEq at AISC of US$10.61 per oz AgEq
Vizsla Silver Corp. (TSX: VZLA) (NYSE: VZLA) (Frankfurt: 0G3) is pleased to announce positive results from its independent Feasibility Study on its 100%-owned flagship Panuco silver-gold project located in Mexico.
The Feasibility Study, completed by Ausenco Engineering Canada ULC supported by Mining Plus Canada Consulting Ltd. and SGS Canada Inc. provides a robust case for developing the Panuco silver-gold project as a high-margin, underground precious metals mine with low initial capital requirements and rapid payback. The Company is advancing permitting and project financing initiatives, targeting a construction decision upon receipt of required approvals.
“The strength of the Feasibility Study reflects the technical excellence and commitment of the Vizsla Silver team and all of our consultants,” stated Simon Cmrlec, COO of Vizsla Silver. “The engineering and procurement for the project was significantly advanced during the Feasibility Study, which coupled with the actual performance of the ongoing test mine provides confidence in the results of the study. Project CAPEX and OPEX remain in line with the PEA, and the study demonstrates the project will produce more than 20 million silver equivalent ounces annually over the first five years, averaging 17.4 million ounces over the life of the project, significantly exceeding the production profile outlined in the PEA.”
“We are very pleased to deliver a robust Feasibility Study on the Panuco project, outlining a high-margin, low CAPEX, silver focused precious metals operation”, stated Michael Konnert, President and CEO of Vizsla Silver. “The study builds upon the strong economics outlined in the Panuco PEA, published in the summer of 2024, indicating that Panuco can become the next large-scale silver-primary producer in Mexico. Applying the updated, higher-grade resource estimate published in January 2025, production output in the Feasibility Study has increased significantly in the early years of the mine life relative to the PEA. This, combined with improved commodity price assumptions, demonstrates a base case after tax NPV (5%) of US$1.8 billion, an IRR of 111%, and a seven-month payback period at US$35.50 per ounce silver and US$3,100 per ounce gold. We expect to continue advancing both our underground and surface exploration proximal to the ongoing test mine to further grow the scale and quality of the deposit. Vizsla Silver would like to thank all its employees, community members and consultants/contractors including Ausenco, Mining Plus, SGS, SACH and PWC for their continued hard work in supporting our project. This very important milestone represents a key inflection point for the Company, the Panuco asset and all of our stakeholders as we advance towards production targeted for the second half of 2027.”
Feasibility Study Highlights (Base Case)
| 1. | Underground Proven and Probable Mineral Reserve Estimate contains only Measured and Indicated Resources |
| 2. | AgEq oz = Ag oz + Au oz x (US$3,100/oz Au ÷ US$35.50/oz Ag) |
| 3. | Total cash costs consist of operating cash costs plus royalties and offsite (refining & transport) charges |
| 4. | AISC consist of total cash costs plus sustaining capital and closure costs |
Feasibility Study Overview
The 2025 Panuco Feasibility Study considers two contiguous underground mines, the Copala Mine and the Napoleon Mine, with on-site treatment of the mined material processed through a 3-stage crushing-grinding circuit, along with a leach and Merrill Crowe circuit to produce silver-gold doré bars. The mines will be contractor-operated, utilizing ramp-access and a combination of long-hole stoping and drift-and-fill mining methods.
The processing throughput capacity of 3,300 tonnes per day for the first 3 years, expanding to 4,000 tonnes per day in year 4, results in an initial mine life of 9.4 years. The Feasibility Study leverages the Panuco district’s existing infrastructure in a well-established mining jurisdiction, including all-weather access roads, high-voltage power, and an abundance of water and skilled labour.
The Feasibility Study is derived using the Company’s updated NI 43-101 Mineral Resource Estimate (dated February 20, 2025). The effective date of the Feasibility Study is November 4th, 2025, and an NI 43-101 compliant technical report on the Feasibility Study will be filed on the Company’s website and SEDAR+ within 45 days of this disclosure.
| General | LOM Total / Avg. |
| Gold Price (US$/oz) | 3,100 |
| Silver Price (US$/oz) | 35.50 |
| Mine Life (Years) | 9.4 |
| Total Processed Feed Tonnes (kt) | 12,809 |
| Total Waste Tonnes (kt) | 6,284 |
| Production | LOM Total / Avg. |
| Head Grade – Ag (g/t) | 249 |
| Head Grade – Au (g/t) | 2.01 |
| Recovery Rate – Ag (%) to doré | 92.3 |
| Recovery Rate – Au (%) to doré | 93.8 |
| Total Metal Payable – Ag (koz) | 94,725 |
| Total Metal Payable – Au (koz) | 776 |
| Average Annual Payable Production – Ag (koz) | 10,130 |
| Average Annual Payable Production – Au (koz) | 83 |
| Average Annual Payable Production – AgEq. (koz) | 17,382 |
| Average Annual Payable Production (Yrs 1-5) – AgEq. (koz) | 20,078 |
| Operating Costs | LOM Total / Avg. |
| Mining Cost (US$/t Processed) | 53.31 |
| Processing Cost (US$/t Processed) (incl. TSF) | 24.84 |
| G&A Cost (US$/t Processed) | 6.96 |
| Total Operating Costs (US$/t Processed) | 85.11 |
| Cash Costs1 (Co-Product Basis) (US$/oz AgEq2) | 8.56 |
| AISC3(Co-Product Basis) (US$/oz AgEq2) | 10.61 |
| Capital Costs | LOM Total / Avg. |
| Initial Capital (US$M) | 238.7 |
| Preproduction Revenue (US$M)4 | -127.7 |
| Preproduction Costs (US$M)5 | 62.0 |
| Initial Costs (Initial Capital + Preproduction Revenue & Costs) (US$M) | 173.0 |
| Sustaining Capital (US$M) | 287.3 |
| Closure Capital (US$M) | 37.5 |
| Salvage Value (US$M) | -9.6 |
| Financials | Pre-Tax |
| NPV (5%) (US$M) | 2,842 |
| IRR (%) | 159 |
| Payback (Years) | 0.4 |
| Financials | Post-Tax |
| NPV (5%) (US$M) | 1,802 |
| IRR (%) | 111 |
| Payback (Years) | 0.6 |
| Post-Tax NPV/Initial Capital | 7.5 |
Table 1: Panuco Feasibility Study Detailed Parameters and Outputs
| 1. | Total cash costs consist of operating cash costs plus royalties and offsite (refining & transport) charges |
| 2. | AgEq oz = Ag oz + Au oz x (US$3,100/oz Au ÷ US$35.50/oz Ag) |
| 3. | AISC consist of total cash costs plus sustaining capital and closure costs |
| 4. | Preproduction revenue includes revenue until the start of commercial production, which is defined as 60 days after mill start |
| 5. | Preproduction costs include: mining, processing and G&A operating costs, offsite charges, and royalties until the start of commercial production, which is defined as 60 days after mill start |
The economic analysis assumes metal prices of US$35.50/oz Ag and US$3,100/oz Au and is based on Mineral Reserves only. The Feasibility Study excludes inferred Mineral Resources.
The Feasibility Study demonstrates strong economic resilience, with post-tax NPV(5%) and IRR remaining positive under 20% variations in all key capital and operating assumptions, and notably still positive under 50% reductions in metal prices. After-tax economic sensitivities are presented in Table(s) 2, 3 and 4 below. Additional project sensitivities will be presented in the Technical Report.
| Inputs | Post-Tax Sensitivity to Metal Prices | |||||
| (50.0 %) | (25.0 %) | Base Case | 25.0 % | 50.0 % | ||
| Ag (US$/oz) | $17.75 | $26.63 | $35.50 | $44.38 | $53.25 | |
| Au (US$/oz) | $1,550 | $2,325 | $3,100 | $3,875 | $4,650 | |
| Post-Tax NPV(5%) (US$M) | $461 | $1,132 | $1,802 | $2,471 | $3,139 | |
| Post-Tax IRR (%) | 42.4 % | 79.4 % | 111.1 % | 139.7 % | 165.4 % | |
Table 2: Sensitivity Summary Post Tax NPV 5% (US$M) & IRR to Metal Prices
| Inputs | Sensitivity Summary Post-Tax NPV 5% (US$M) | |||||
| (20.0 %) | (10.0 %) | Base Case | 10.0 % | 20.0 % | ||
| Head Grade (+/-%) | $1,262 | $1,534 | $1,802 | $2,072 | $2,324 | |
| Recovery (+/-%) | $1,271 | $1,536 | $1,802 | $1,995 | $2,003 | |
| Operating Costs (+/%) | $1,915 | $1,859 | $1,802 | $1,745 | $1,689 | |
| Initial Capex (+/-%) | $1,848 | $1,825 | $1,802 | $1,779 | $1,756 | |
Table 3: Sensitivity Summary Post Tax NPV 5% (US$M)
| Inputs | Sensitivity Summary Post-Tax IRR (%) | |||||
| (20.0 %) | (10.0 %) | Base Case | 10.0 % | 20.0 % | ||
| Head Grade (+/-%) | 85.8 % | 98.7 % | 111.1 % | 123.0 % | 134.2 % | |
| Recovery (+/-%) | 86.3 % | 98.9 % | 111.1 % | 119.5 % | 119.8 % | |
| Operating Costs (+/-%) | 117.6 % | 114.3 % | 111.1 % | 107.8 % | 104.6 % | |
| Initial Capex (+/-%) | 132.5 % | 120.8 % | 111.1 % | 102.7 % | 95.5 % | |
Table 4: Sensitivity Summary Post Tax IRR (%)
Mineral Reserves
The Proven and Probable Mineral Reserve for the Panuco project is estimated at 12.81 Mt at an average grade of 249 g/t Ag and 2.01 g/t Au or 416 g/t AgEq, as summarized in Table 5.
The initial Mineral Reserve estimate was prepared by Jason Blais, P.Eng., Principal Mining Consultant of Mining Plus with an effective date of November 4th, 2025.
| Classification | Tonnes | Grade | Contained Metal | ||||
| (kt) | Ag
(g/t) |
Au
(g/t) |
AgEq
(g/t) |
Ag
(k oz) |
Au
(k oz) |
AgEq
(k oz) |
|
| Proven | 1,948 | 308 | 2.35 | 502 | 19,264 | 147 | 31,424 |
| Probable | 10,854 | 239 | 1.95 | 400 | 83,351 | 681 | 139,687 |
| Planned Stockpile
Proven |
4 | 330 | 3.70 | 635 | 41 | 0.5 | 82 |
| Probable | 3 | 318 | 2.90 | 558 | 34 | 0.3 | 54 |
| Total Proven + Probable | 12,809 | 249 | 2.01 | 416 | 102,689 | 829 | 171,246 |
Table 5: Mineral Reserve Estimate
| 1. | The Mineral Reserve is estimated using the 2019 CIM Estimation of Mineral Resources & Mineral Reserves Best Practice Guidelines and 2014 CIM Definition Standards for Mineral Resources & Mineral Reserves. | |||
| 2. | Mineral Reserves are based on Measured and Indicated Mineral Resource Classifications only. | |||
| 3. | The Mineral Reserve was calculated using long-term metal prices of US$28.50/oz Ag, US$ 2,300/oz Au. | |||
| 4. | The block model NSR value was calculated on an individual block basis using interim Phase 2 process recovery formulas for each zone. Copala/Tajitos Ag process recovery calculated as 1.56*ln(Ag g/t) + 83.9)/100 and Copala/Tajitos Au process recovery calculated as 1.96*ln(Au g/t) + 91.4)/100. Napoleon/Luisa Ag process recovery calculated as 8.8*ln(Ag g/t) + 44)/100 and Napoleon/Luisa Au process recovery calculated as 1.7*ln(Au g/t) + 93.7)/100. | |||
| 5. | The Mineral Reserve is estimated using three NSR cut-off values (COV). A Fully Costed COV was calculated at US$105.72 for Long Hole Stoping (LHS) and US$129.33/t for Drift and Fill (DAF), an Incremental COV of US$ 87.00 /t for LHS and US$ 110.00 /t for DAF and a Marginal COV of US$33.00/t applied to development that must be mined to access production areas. | |||
| 6. | The Planned Stockpile is anticipated to be mined from the Copala orebody as part of the ongoing Test Mine bulk sample activities prior to the start of the Feasibility Study mine schedule. | |||
| 7. | Royalty rates of 3.5% and 2.0% were applied to the deposit based on royalty boundaries. The 2.0% royalty boundary only affects a portion of the Napoleon deposit. | |||
| 8. | AgEq (g/t) = (Ag(g/t) + 82.54*Au(g/t)) for Copala & Tajitos and AgEq = (Ag(g/t) + 82.97*Au(g/t)) for Napoleon & Luisa at 3.5% royalty and AgEq = (Ag(g/t) + 82.97*Au(g/t)) for Napoleon at 2% royalty. AgEq is expressed based on a number of revenue factors. See Table 6 for a complete list of inputs used to calculate NSR and AgEq factors. | |||
| 9. | Mining recovery between 90% to 100% is applied to the estimate depending on the mining method and is reduced in some areas based on geotechnical guidelines or mining sequence. Mining recovery averages 96% for the overall project. | |||
| 10. | The Mineral Reserve includes both planned and unplanned dilution. Unplanned dilution includes dilution from overbreak, backfill and material handling. Dilution within Stope Optimizer (SO) outputs was estimated at 36% and additional unplanned dilution of 2% was added for backfill dilution in longhole stopes. Internal dilution in DAF mining within the mining shape was estimated at 31% and additional backfill dilution in DAF was estimated at 5%. | |||
| 11. | For LHS, a minimum mining width of 1.5 meters was used excluding overbreak and unplanned dilution, and for DAF, a minimum mining width of 5.0 meters was used. | |||
| 12. | The economic viability of the Mineral Reserve is demonstrated using a discounted cash flow model. | |||
| 13. | The independent and qualified person responsible for the Mineral Reserve, as defined by NI 43-101, is Mr. Jason Blais, P.Eng., Principal Mining Consultant for Mining Plus Canada Consulting Ltd. | |||
| 14. | The effective date of the Mineral Reserve Estimate is November 4th, 2025. | |||
| 15. | Totals may not add up due to rounding.
|
|||
| Metal | Unit | Copala & Tajitos
(3.5% Royalty) |
Napoleon & Luisa (3.5% Royalty) |
Napoleon
(2% Royalty) |
| Ag Price | USD/oz | 28.5 | 28.5 | 28.5 |
| Au Price | USD/oz | 2,300 | 2,300 | 2,300 |
| Average Ag Process Recovery | % | 92.8 | 94.4 | 94.4 |
| Average Au Process Recovery | % | 93.2 | 95.3 | 95.3 |
| Ag Payable | % | 99.9 | 99.9 | 99.9 |
| Au Payable | % | 99.85 | 99.85 | 99.85 |
| Product Freight | USD/t | 3,000 | 3,000 | 3,000 |
| Ag Refining | USD/oz | 0.50 | 0.50 | 0.50 |
| Au Refining | USD/oz | 5.00 | 5.00 | 5.00 |
| Royalty | % | 3.50 % | 3.50 % | 2 % |
| Ag Multiplier | USD/g | 0.8027 | 0.8162 | 0.8289 |
| Au Multiplier | USD/g | 66.2536 | 67.7202 | 68.7728 |
| Ag Equivalence | g Ag/g Au | 82.538 | 82.970 | 82.969 |
Table 6: Inputs Used to Calculate NSR for Gold & Silver
Mineral Resources
| Copala Area |
Resource Class |
Tonnes (Mt) |
Grade | Total Metal | ||||||||
| Au (g/t) |
Ag (g/t) |
Pb
% |
Zn
% |
AgEq (g/t) |
Au (koz) |
Ag (koz) |
Pb (Mlbs) |
Zn (Mlbs) |
AgEq (koz) |
|||
| Copala | Measured | 1.88 | 3.09 | 442 | 0.08 | 0.15 | 684 | 187 | 26,744 | 3.2 | 6.3 | 41,418 |
| Indicated | 4.29 | 2.50 | 402 | 0.09 | 0.17 | 600 | 345 | 55,374 | 8.4 | 15.8 | 82,781 | |
| M+I | 6.17 | 2.68 | 414 | 0.09 | 0.16 | 626 | 532 | 82,118 | 11.6 | 22.1 | 124,199 | |
| Inferred | 2.32 | 1.83 | 322 | 0.16 | 0.27 | 476 | 137 | 24,014 | 8.3 | 13.8 | 35,452 | |
| Tajitos | Indicated | 0.72 | 2.34 | 380 | 0.14 | 0.25 | 571 | 55 | 8,833 | 2.2 | 4.0 | 13,277 |
| Inferred | 0.89 | 2.08 | 346 | 0.27 | 0.43 | 527 | 60 | 9,936 | 5.2 | 8.5 | 15,132 | |
| Cristiano | Indicated | 0.36 | 3.67 | 610 | 0.25 | 0.45 | 912 | 43 | 7,102 | 2.0 | 3.6 | 10,614 |
| Inferred | 0.34 | 2.49 | 460 | 0.16 | 0.31 | 665 | 27 | 4,959 | 1.2 | 2.3 | 7,168 | |
| Total | Measured | 1.88 | 3.09 | 442 | 0.08 | 0.15 | 684 | 187 | 26,744 | 3.2 | 6.3 | 41,418 |
| Indicated | 5.37 | 2.56 | 413 | 0.11 | 0.20 | 617 | 443 | 71,309 | 13 | 23 | 106,672 | |
| M+I | 7.26 | 2.70 | 420 | 0.10 | 0.19 | 635 | 630 | 98,053 | 16 | 30 | 148,090 | |
| Inferred | 3.55 | 1.96 | 341 | 0.19 | 0.31 | 507 | 224 | 38,909 | 15 | 25 | 57,752 | |
| Napoleon Area |
Resource Class |
Tonnes (MT) |
Grade | Total Metal | ||||||||
| Au (g/t) | Ag (g/t) | Pb
% |
Zn
% |
AgEq (g/t) | Au (koz) | Ag (koz) | Pb (Mlbs) | Zn (Mlbs) | AgEq (koz) | |||
| La Luisa | Indicated | 0.49 | 2.12 | 143 | 0.31 | 1.44 | 364 | 33 | 2,238 | 3.3 | 15.4 | 5,693 |
| Inferred | 2.83 | 2.24 | 132 | 0.28 | 1.24 | 355 | 204 | 12,049 | 17.8 | 77.5 | 32,307 | |
| Cruz Negra | Indicated | 0.03 | 2.01 | 145 | 0.38 | 2.01 | 380 | 2 | 154 | 0.3 | 1.5 | 403 |
| Inferred | 0.35 | 3.58 | 171 | 0.30 | 1.64 | 510 | 40 | 1,907 | 2.3 | 12.5 | 5,676 | |
| Josephine | Indicated | 0.06 | 2.54 | 230 | 0.38 | 1.09 | 473 | 5 | 452 | 0.5 | 1.5 | 928 |
| Inferred | 0.21 | 1.81 | 176 | 0.34 | 1.01 | 360 | 12 | 1,180 | 1.6 | 4.6 | 2,406 | |
| Napoleon
HW(4) |
Indicated | 0.99 | 2.09 | 217 | 0.47 | 1.64 | 448 | 66 | 6,885 | 10.2 | 35.7 | 14,206 |
| Inferred | 0.59 | 2.12 | 202 | 0.64 | 2.15 | 458 | 40 | 3,800 | 8.2 | 27.7 | 8,619 | |
| Napoleon
+Splays |
Measured | 0.36 | 2.34 | 161 | 0.51 | 1.41 | 404 | 27 | 1,853 | 4.0 | 11.1 | 4,638 |
| Indicated | 3.78 | 2.25 | 150 | 0.52 | 1.78 | 399 | 273 | 18,184 | 42.9 | 148.2 | 48,404 | |
| M+I | 4.13 | 2.26 | 151 | 0.51 | 1.75 | 399 | 300 | 20,037 | 47 | 159 | 53,042 | |
| Inferred | 2.28 | 1.46 | 159 | 0.44 | 1.63 | 340 | 107 | 11,637 | 21.9 | 81.8 | 24,941 | |
| Total | Measured | 0.36 | 2.34 | 161 | 0.51 | 1.41 | 404 | 27 | 1,853 | 4.0 | 11.1 | 4,638 |
| Indicated | 5.34 | 2.21 | 163 | 0.49 | 1.72 | 405 | 379 | 27,913 | 57 | 202 | 69,634 | |
| M +I | 5.70 | 2.22 | 162 | 0.49 | 1.70 | 405 | 406 | 29,766 | 61 | 213 | 74,272 | |
| Inferred | 6.25 | 2.00 | 152 | 0.38 | 1.48 | 368 | 403 | 30,573 | 52 | 204 | 73,949 | |
Table 7: Mineral Resources for Copala and Napoleon Deposits (effective September 9, 2024)
| 1. | The classification of the current Mineral Resource Estimate into Indicated and Inferred is consistent with current 2014 CIM Definition Standards – For Mineral Resources and Mineral Reserves. |
| 2. | Tables presented include only the Copala and Napoleon deposits, which inform the Feasibility Study mine plan. The complete project-wide Mineral Resource Estimate will be available in the Technical Report. |
| 3. | All figures are rounded to reflect the relative accuracy of the estimate and numbers may not add due to rounding. |
| 4. | All mineral resources are presented undiluted and in situ, constrained by continuous 3D wireframe models (considered mineable shapes), and are considered to have reasonable prospects for eventual economic extraction. |
| 5. | Mineral resources which are not mineral reserves do not have demonstrated economic viability. An Inferred Mineral Resource has a lower level of confidence than that applying to an Indicated Mineral Resource and must not be converted to a Mineral Reserve. It is reasonably expected that the majority of Inferred Mineral Resources could be upgraded to Indicated Mineral Resources with continued exploration. |
| 6. | It is envisioned that the Panuco Project deposits may be mined using underground mining methods including longhole stoping (LHS) and/or drift-and-fill (DAF). Mineral resources are reported at a base case cut-off grade of 150 g/t AgEq. The mineral resource grade blocks were quantified above the base case cut-off grade, below surface and within the constraining mineralized wireframes. |
| 7. | Based on the size, shape, general thickness and orientation of the majority of the mineralized zones within the project area, it is envisioned that the deposits may be mined using a combination of underground mining methods including longhole stoping (LHS) and/or drift-and-fill (DAF). |
| 8. | The base-case AgEq Cut-off grade considers metal prices of $26.00/oz Ag, $1,975/oz Au, $1.10/lb Pb and $1.35/lb Zn and considers metal recoveries of 93% for Ag, 90% for Au, 94% for Pb and 94% for Zn. |
| 9. | The base case cut-off grade of 150 g/t AgEq considers a mining cost of US$45.00/t and processing, treatment, refining, and transportation cost of USD$30.00/t and G&A cost of US$20.00/t of mineralized material. |
| 10. | The estimate of Mineral Resources may be materially affected by environmental, permitting, legal, title, taxation, socio-political, marketing, or other relevant issues. |
| 11. | Mineral Resources are inclusive of Mineral Reserves. |
| 12. | The independent and qualified person responsible for the Mineral Resource, as defined by NI 43-101, is Allan Armitage, Ph.D, P.Geo., of SGS . |
| 13. | The effective date of the Mineral Resource Estimate is September 9, 2024. |
Capital and Operating Costs
The pre-production initial CAPEX is estimated to be $238.7 million, with a net initial cost of $173 million after accounting for $127.7 million in pre-production revenues and $62 million pre-production costs. Initial CAPEX includes a contingency of $24 million. Cumulative sustaining capital is estimated at $287.3 million. LOM operating costs for the Panuco Project are estimated to average $85.11 per tonne processed.
Sustaining Capital is expected to average approximately $30.72 million per year, largely attributable to continual mine development. In Year 4, with the mill expansion and increase in underground development associated with accessing the Napoleon Area veins, an expansion cost of $15.4 million is added (to be funded through initial cash flows). The projected timing of increases in capital expenditures in year 3 may be pushed further into the future with continued exploration success along the Copala structure.
The Feasibility Study is based on contractor underground mining, which has an estimated LOM cost of $53.31 per tonne milled. Processing costs are estimated at $24.84 per tonne milled, which includes TSF handlings of $0.33 per tonne milled. G&A costs are estimated at $6.96 per tonne milled.
The capital and operating cost estimate was developed in Q4 2025 United States Dollars (US$). The capital cost summary is presented in Table 8, and the operating cost summary is presented in Table 9.
| WBS Description | Initial Capital Cost (US$M) |
Sustaining Capital Cost (US$M) |
Expansion Capital Cost (US$M) |
Total Capital Cost (US$M) |
| Mining | 60.2 | 259.1 | 0.6 | 319.6 |
| Process Plant | 63.9 | 0 | 8.8 | 98.0 |
| Additional Process Facilities | 18.7 | 25.0 | 1.1 | 19.9 |
| On Site Infrastructure | 32.8 | 0.2 | 1.7 | 34.7 |
| Off Site Infrastructure | 1.1 | – | – | 1.1 |
| Total Directs | 176.7 | 284.4 | 12.2 | 473.4 |
| Project Preliminaries | 8.1 | – | – | 8.1 |
| Project Delivery | 19.7 | – | 1.6 | 21.3 |
| Owner’s Costs | 10.1 | – | – | 10.1 |
| Provisions (Contingency) | 24.0 | 2.9 | 1.5 | 28.5 |
| Total Indirects | 61.9 | 2.9 | 3.1 | 68.0 |
| Project Totals | 238.7 | 287.3 | 15.4 | 541.3 |
Table 8: Project Capital Cost Estimates (US$M) (totals may differ due to rounding)
| 1. | Totals may differ due to rounding |
| Cost Area | Average Annual Costs (US$M) | US$/t Processed |
| Mining | 71.9 | 53.31 |
| Process (incl. TSF) | 33.5 | 24.84 |
| General and Administration | 9.4 | 6.96 |
| Total | 114.9 | 85.11 |
Table 9: Project Operating Cost Estimates (US$M)
| 2. | Totals may differ due to rounding |
Mining
The Panuco Project is a collection of silver-gold deposits located in the Panuco mining district in Sinaloa, Mexico, with Mineral Reserves that extend from surface to over 600 m in depth. The deposits range in thickness from 1.5 m to greater than 20 m.
Based on the characteristics of the deposit, long-hole stoping was selected as the primary mining method for all deposits, with drift-and-fill selected for the northern portion of the Copala North Zone, which is located directly under the Copala township. A sublevel spacing between 15-20 m was selected with stope strike lengths of 20 m for LHS to be used dependant on prevailing ground conditions, and 5 m high DAF drifts (three lifts per sublevel).
The mining methods considered for the Panuco Project are proposed to use a combination of cemented rock backfill, uncemented rock backfill, and paste backfill for stope support.
For the feasibility design of the Panuco Project, planned dilution and unplanned rock dilution (ELOS) was accounted for using the Deswik Stope Optimizer®. Dilution within SO outputs was estimated at 36% and additional unplanned dilution of 2% was added for backfill dilution in longhole stopes. Internal dilution in DAF mining within the mining shape was estimated at 31% and additional backfill dilution in DAF was estimated at 5%. Mining recovery averaging 94% was applied for LHS based on geometry and extraction sequence, and a mining recovery of 100% was applied for DAF as a factor to the shapes created by SO within the production schedule. Figure 1 shows the proposed stope shapes by NSR ($US/t) and development design for the Panuco Project.
A Net Smelter Return (NSR) model was used to estimate the revenue of the mineralized material. Interim process recoveries, doré grades, smelting and refining terms, royalties and transportation costs were assumed to determine the NSR value. A Cut-Off Value was used to flag material by whether the revenue in a block exceeds the costs of extraction and processing of that block. Following the financial model completion, there were three COVs used to assess mining at Panuco: A Fully Costed COV, an Incremental COV and the Marginal COV.
The Fully Costed COV represents the break-even value of Mineral Reserve required to cover all the associated operating and sustaining capital costs of extraction and processing. Fully costed COVs were initially assumed for Panuco at US$100.00/t for LHS and US$120.00/t for DAF. Following the completion of the financial model, the Fully Costed COV was calculated at US$105.72 for LHS and US$129.33/t for DAF.
The Incremental COV of US$ 87.00 /t for LHS and US$ 110.00 /t for DAF was applied in areas where development had already been completed, and no additional capital was required to access new stoping blocks. The Incremental COV includes the assumption that the material value exceeds the costs of the operational costs which include mining, processing and G&A, and does not include sustaining capital costs. The Incremental COV applied was elevated slightly compared to the calculated costs to reduce the effect of near cut-off stoping material and improve the overall mining sequence. Less than 1% of the AgEq ounces attributed to LHS and less than 2% of the AgEq ounces attributed to DAF are between the Incremental COV and the Fully Costed COV.
The Marginal COV of US$33.00/t was applied to development when the operation has committed to the preparation of stoping or DAF blocks and the material must be mined in order to access a production area. The Marginal COV includes the assumption that the material value exceeds the costs of the incremental processing and G&A and does not include any operational mining or sustaining capital costs. The Marginal COV applied was elevated slightly when compared to the calculated cost to remove the risk of overstating marginal tonnes in the Mineral Reserve.
Due to the distance between the various geological deposits, the project is separated into two underground mines. The Copala Mine, the larger of the two, accesses the Copala, Cristiano, and Tajitos deposits. The Napoleon Mine portal, located approximately 800 m west of the Copala Mine portal, accesses the Napoleon and La Luisa deposits.
Contractor mining is currently proposed for the Panuco Project to minimize upfront capital, leverage skilled labour and achieve higher productivity. The annual Panuco project material movements are summarized in Table 10.
| Period | Waste | Development | Stoping1 | Total Mineralized Material |
Total Mined Material |
||||||
| kt | kt | kt | kt | kt | |||||||
| YEAR \ TOTAL |
6,284 | 2,508 | 10,294 | 12,802 | 19,085 | ||||||
| Y-02 | 343 | 74 | – | 74 | 417 | ||||||
| Y-01 | 446 | 137 | 336 | 473 | 919 | ||||||
| Y01 | 449 | 199 | 661 | 859 | 1,308 | ||||||
| Y02 | 797 | 235 | 991 | 1,226 | 2,023 | ||||||
| Y03 | 626 | 361 | 948 | 1,310 | 1,936 | ||||||
| Y04 | 650 | 304 | 1,295 | 1,599 | 2,250 | ||||||
| Y05 | 659 | 220 | 1,315 | 1,535 | 2,194 | ||||||
| Y06 | 776 | 313 | 1,220 | 1,533 | 2,310 | ||||||
| Y07 | 634 | 358 | 1,139 | 1,497 | 2,131 | ||||||
| Y08 | 622 | 238 | 1,144 | 1,382 | 2,004 | ||||||
| Y09 | 282 | 68 | 1,092 | 1,160 | 1,441 | ||||||
| Y10 | – | – | 153 | 153 | 153 |
Table 10: Total and Annual Material Movement Schedule for the Panuco Project
| 1. | Stoping includes Drift and Fill production. |
Processing and Metallurgy
Vizsla Silver has completed four rounds of metallurgical test work on the Panuco Project deposits since 2021. The latest round of test work (2025) focussed on variability within the deposit, defining consumable usage within the deposits and ensuring process efficiency was optimized.
Test work in 2025 included comminution test work, variability work on both whole ore leach and flotation flowsheets, oxygen uptake, thickening, rheology, paste characterisation and cyanide detoxification.
Based on the test work and mine plan feed grades, life-of-mine average recoveries are estimated at 92.3% Ag and 93.8% Au.
The Feasibility Study outlines a two-phase process plant design, beginning with a 3,300-tonne-per-day whole-ore leach circuit utilizing a primary grind of 50 µm. Ore will be processed through a three-stage crushing circuit, followed by grinding to 50 µm in a ball mill. The ground slurry will then enter the leach circuit for a total retention time of approximately 96 hours. Leach discharge will flow by gravity to a counter-current decantation (CCD) circuit, where solids are separated from the pregnant liquor. Pregnant liquor then reports to the Merrill Crowe and refinery circuits to produce silver-gold doré.
Phase 2, scheduled for Year 4, will expand throughput to 4,000 tonnes per day and increase the primary grind size to 70 µm, incorporating a flotation and regrind circuit between the ball-mill discharge and leach feed. The additional circuit enables a coarser primary grind, improves overall metal recovery, and optimizes power and reagent efficiency. Flotation concentrate, which contains a high proportion of gold, will be treated in a high intensity grinding mill and reduced to 20 µm. Ground concentrate is then leached separately from the flotation tailings and then fed into the tailings leach circuit with the tailings to maximize metal recovery.
Infrastructure
Access to the Panuco Project is planned via Highway 40 through the expansion of an existing entryway, incorporating traffic control measures to ensure safe entry and exit from the site. Existing site roads will be upgraded, and community access routes will remain open and safely distanced from active mining areas.
Electrical power for the project will be sourced from a 230 kV transmission line that traverses the property. Vizsla plans to construct an on-site switching substation adjacent to the process plant (the project’s largest power consumer) and distribute electricity at 13 kV throughout the site as needed.
Underground dewatering will serve as the primary water source for the project. Vizsla intends to reuse and recycle as much water as possible and has developed a water management plan where the wet season excess water can be stored for process use during drier months.
Tailings from the process plant will be piped to the tailings storage facility (TSF) which follows the access road. The TSF is designed as a centreline raise embankment with 4 stages throughout the project life.
The Feasibility Study envisages a stockpile of ore created ahead of commissioning the process plant. This approach reduces project start-up risk and supports consistent grade control during commissioning and early operations. The pre-production stockpile is estimated to total approximately 523,000 tonnes, providing a buffer equivalent to five months of process plant feed.
Permitting & Environmental
The project currently operates under mine exploration permits granted in 2020 and 2021 by SEMARNAT (the Secretariat of Environment and Natural Resources). An active Informe Preventivo (IP) covers the Panuco Project area, authorizing ongoing drilling and exploration activities. All activities related to the Test Mine are authorized under existing permits.
The construction and operation phases of the project require several additional environmental permits. Applications for the Environmental Impact Assessment (EIA) and the corresponding Risk Assessment were submitted in the first quarter of 2025 and are currently under review by SEMARNAT. In parallel, the preparation of technical documentation for the Land Use Change is in progress. Additional permits required for project development include a construction permit from the local municipality, and explosives permit from the Ministry of Defense.
The baseline environmental information collected to date has been largely presented in reports commissioned to support the submission of an Environmental Impact Assessment (MIA in Mexico) that was submitted to SEMARNAT in February 2025. Baseline data available includes, meteorology and climate, surface water, groundwater, air quality, noise, soil, and flora and fauna. Future studies will need to be initiated and/or further advanced to support the next phase of the project design in the areas of geochemistry studies, and further refinement of the mine water balance.
Regarding communities, Vizsla Silver has negotiated operating agreements with all five Ejidos in the greater Panuco area (Copala, Pánuco, San Miguel del Carrizal, El Habal de Copala, and Platanar de los Ontiveros). The operating agreements cover exploration, construction, operation, and closure phases for a 30-year period. The Social Impact Assessment and Social Baseline Update are ongoing and scheduled for completion in the first quarter of 2026.
Project Enhancement Opportunities
The Feasibility Study does not incorporate any inferred resources; however, opportunities exist across all deposit areas to upgrade inferred material to indicated or measured categories, particularly once underground drilling can be conducted from optimized collar locations, reducing drill costs and improving data quality. Extending the mine life at Copala remains a key focus, given its early access to ore, strong grade profile, and suitability for whole-ore leach processing.
Metal prices applied in the Feasibility Study’s Mineral Reserve Estimate are more conservative than those used in the financial model. This creates potential to increase the contained ounces in the mine plan by converting additional Measured and Indicated Mineral Resources to Mineral Reserves by using the financial model metal prices to evaluate the inclusion of additional inventory.
Vizsla is evaluating partnerships with regional power providers that could reduce substation capital costs and support the delivery of lower-carbon electricity to the project within Mexico’s privatized power grid.
Qualified Persons
A team of independent Qualified Persons (as such term is defined under NI 43-101) at Ausenco, Mining Plus and SGS have led and prepared the Feasibility Study and have reviewed and verified the technical disclosure in this press release, including:
In accordance with NI 43-101, Jesus Velador, Ph.D. MMSA QP., Vice President of Exploration, is the Qualified Person for the Company and has reviewed and approved the technical and scientific content of this news release.
About Vizsla Silver and the Panuco Project
Vizsla Silver is a Canadian mineral exploration and development company headquartered in Vancouver, BC, focused on advancing its flagship, 100%-owned Panuco silver-gold project located in Sinaloa, Mexico. The Company recently completed a Feasibility Study for Panuco in November 2025 which highlights 17.4 Moz AgEq of annual production over an initial 9.4-year mine life, an after-tax NPV(5%) of US$1.8B, 111% IRR and a 7-month payback at US$35.50/oz Ag and US$3,100/oz Au. Vizsla Silver aims to position itself as a leading silver company by implementing a dual track development approach at Panuco, advancing mine development while continuing district scale exploration through low-cost means.
About Ausenco
Ausenco is a global engineering, consulting and project delivery company providing solutions to the minerals and metal industry. Ausenco’s experience in precious metals projects ranges from conceptual, pre-feasibility and feasibility studies for new project developments to project execution with EPCM delivery. Ausenco is currently engaged on several global projects with similar characteristics and opportunities to the Panuco project.
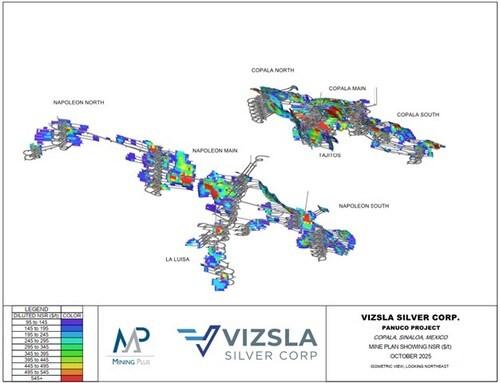
Figure 1: Proposed stope shapes by NSR ($US/t) for the Panuco Project (CNW Group/Vizsla Silver Corp.)
Hudbay Minerals Inc. (TSX:HBM) (NYSE: HBM) today released its ann... READ MORE
Strategic acquisition of an established operating gold mine, loca... READ MORE
Cerro de Pasco Resources Inc. (TSX-V: CDPR) (OTCQB: GPPRF) (FRA: ... READ MORE
The Garneau Titanium Project Features Ilmenite-Rich Boulder with ... READ MORE
ValOre Metals Corp. (TSX‐V: VO) (OTCQB: KVLQF) (Frankfurt: KEQ0... READ MORE


