


Positive Results for the PFS with Post-tax NPV of $425 million and 30.1% IRR at Spot Prices
Treasury Metals Inc. (TSX: TML) (OTCQX: TSRMF) is pleased to announce the results of the Pre-feasibility Study, prepared in accordance with National Instrument 43-101 – Standards for Disclosure for Mineral Projects, for its 100%-owned Goliath Gold Complex located in the Wabigoon Greenstone Belt in northwestern Ontario, which includes the Goliath, Goldlund and Miller deposits. All dollar figures are expressed in Canadian dollars unless otherwise stated.
PFS Highlights:
| ________________________________ |
| 1 For more information on the PEA, see the Company’s technical report entitled “N.I. 43-101 Technical Report & Preliminary Economic Assessment of the Goliath Gold Complex” and dated effective January 28, 2021, available on SEDAR at www.sedar.com. Mineral resources that are not mineral reserves have not demonstrated economic viability. The PEA is preliminary in nature in that it includes inferred mineral resources that are considered too speculative to have economic considerations applied to them and should not be relied upon for that purpose. |
Jeremy Wyeth, President and CEO of Treasury Metals Inc., commented: “This PFS released by the Company supports the values from the PEA. We are pleased with the results, which in some cases exceed the values from the PEA, with the addition of more detailed engineering work completed in the PFS. The PFS shows strong base-case economics, with great leverage to higher gold prices, in spite of current short-term inflationary pressures. The mine plan has grown from the PEA and the higher throughput has allowed us to get economies of scale to maintain these solid economics. We believe that additional optimization work will assist us in unlocking further value into the Feasibility Study and we will continue with exploration activities to look for opportunities to extend and expand the mine plan. I am pleased that the Board has approved that we move forward into value engineering and a Feasibility Study.”
Pre-Feasibility Study Summary
This independent PFS was developed by Ausenco Engineering Canada Inc. with collaboration from SRK Consulting (Canada) Inc., SLR Consulting (Canada) Ltd., Minnow Environmental Inc., WSP Canada Inc. and Stantec Inc. These firms provided mineral resource and mineral reserve estimates, design parameters and cost estimates for mine operations, process facilities, waste and tailings storage, permitting, reclamation, equipment selection and operating and capital expenditures.
Table 1: Summary of Project Economics
| Financial Summary and Analysis | ||
| General | ||
| Gold Price/Silver Price | US$/oz | $1,750/$21 |
| Exchange Rate | US$:C$ | $1.34 |
| Mine Life | years | 13.0 |
| Total Mill Feed Tonnes | kt | 30,318 |
| Strip Ratio | 3.11 | |
| Production | ||
| Mill Head Grade LOM | g/t | 1.30 |
| Mill Recovery Rate | % | 92.77 % |
| Total Mill Ounces Recovered | koz | 1,175 |
| Total Annual Average Production | koz | 90 |
| Operating Cost | ||
| Mining Cost | C$/t Milled | $32.83 |
| Processing Cost | C$/t Milled | $11.34 |
| G&A Cost | C$/t Milled | $3.54 |
| Total Operating Costs | C$/t Milled | $47.71 |
| Cash Costs* | US$/oz | $935 |
| AISC** | US$/oz | $1,072 |
| Capital Cost | ||
| Initial Capital | C$M | $335 |
| Sustaining Capital | C$M | $198 |
| Closure Costs & Salvage Value | C$M | $19 |
| Financial Pre-tax | ||
| NPV | C$M | $469 |
| IRR | 29.3 % | |
| Payback | years | 2.8 |
| Financial Post-tax | ||
| NPV | C$M | $336 |
| IRR | 25.4 % | |
| Payback | years | 2.8 |
| *Cash costs consist of mining costs, processing costs, G&A and refining charges and royalties. Calculated on a by-product basis. See notes on Non-IFRS Financial Measures for more details. |
| **AISC includes cash costs plus sustaining capital. Calculated on a by-product basis. See notes on Non-IFRS Financial Measures for more details. |
Mineral Reserves
The PFS is based on the combined open pit and underground Measured and Indicated portion of the Goliath Gold Complex Mineral Resource Estimate, as released on April 14, 2022 (see Table 3 below). The Proven and Probable Mineral Reserves for the Project are estimated at 30.3 million tonnes at an average grade of 1.3 g/t Au for 1.3 million ounces of contained gold as outlined in Table 2 below.
Table 2: Goliath Gold Complex Mineral Reserve Estimate
| Goliath Gold Complex | ||||||
| Type | Classification | Tonnes (kt) | Au (g/t) | Au (koz) | Ag (g/t) | Ag (koz) |
| Open Pit
Goliath |
Proven | 3,969 | 1.05 | 134 | 3.22 | 410 |
| Probable | 5,580 | 0.67 | 119 | 2.20 | 395 | |
| Proven & Probable | 9,549 | 0.83 | 254 | 2.62 | 805 | |
| Open Pit
Goldlund |
Proven | – | – | – | – | – |
| Probable | 16,256 | 1.19 | 621 | – | – | |
| Proven & Probable | 16,256 | 1.19 | 621 | – | – | |
| Open Pit
Miller |
Proven | – | – | – | – | – |
| Probable | 738 | 1.03 | 24 | – | – | |
| Proven & Probable | 738 | 1.03 | 24 | – | – | |
| Underground
Goliath |
Proven | 596 | 3.96 | 76 | 16.73 | 321 |
| Probable | 3,180 | 2.85 | 292 | 5.85 | 598 | |
| Proven & Probable | 3,776 | 3.03 | 368 | 7.56 | 918 | |
| Total | Proven | 4,565 | 1.43 | 210 | 4.98 | 731 |
| Probable | 25,574 | 1.28 | 1,057 | 1.20 | 993 | |
| Proven & Probable | 30,319 | 1.30 | 1,267 | 1.77 | 1,724 | |
| 1. | Mineral Reserves are founded on and included within the Mineral Resource estimates, with an effective date of January 17, 2022. |
| 2. | Mineral Reserves were developed in accordance with CIM Definition Standards (2014). |
| 3. | Open pit Mineral Reserves incorporate 10%, 7% and 9% dilution for Goliath, Goldlund and Miller, respectively. Open pit Mineral Reserves include 1% loss for Goliath and Miller, no losses are included for Goldlund. Goliath underground Mineral Reserves include 5% dilution and 0% loss for development. For stopes at Goliath underground, the Mineral Reserves include 15% dilution (both downhole and up hole stopes) and 90% (downhole) and 80% (up hole) recovery. |
| 4. | Open pit Mineral Reserves are reported based on open pit mining within designed pits above cut-off values of C$15.22/t, C$16.00/t and C$23.63/t for Goliath, Goldlund and Miller, respectively. Goliath underground Mineral Reserves are reported based on underground mining within designed underground stopes above an in-situ cut-off value of C$124.00/t. The cut-off values are based on a gold price of US$1,550/oz Au, a silver price of US$22, transportation costs of C$5/oz Au, payability of 99% Au and 97% Ag, LOM average gold recoveries of 94.2% for Goliath, 94.3% for Goldlund and 94.0% for Miller, and a silver recovery of 60% for Goliath. |
| 5. | Underground Mineral Reserves following Year 13 have been removed from the LOM plan and thus are excluded in the Mineral Reserve table above. Some low grade Goldlund material above cut-off is not fed to the plant and therefore not included in the Mineral Reserves. |
| 6. | The qualified person for the open pit Mineral Reserve estimate is Colleen MacDougall, P.Eng; and the qualified person for the underground Mineral Reserve estimate is Sean Kautzman, P.Eng, both are SRK Consulting (Canada) Inc. employees. |
| 7. | Rounding may result in apparent summation differences between tonnes, grade and contained metal. |
Mineral Resources
The Treasury geology team worked with SRK Consulting (Canada) Inc. to select the best modelling approaches for each deposit. Improved geological models were constructed for each deposit to support the block model updates. The goal for the geological models and block models was to ensure each deposit was as well represented as possible. Specific attention was placed on capturing the higher-grade mineralization while not allowing those grades to mistakenly influence the surrounding lower-grade halos.
Table 3: Goliath Gold Complex Mineral Resource Estimate
| Goliath Gold Complex | |||||||
| Type | Classification | Cut-off | Tonnes | Au (g/t) | Au (Oz) | Ag (g/t) | Ag (Oz) |
| Open Pit | Measured | 0.25 / 0.3 | 6,223,000 | 1.20 | 239,500 | 4.70 | 940,600 |
| Indicated | 0.25 / 0.3 | 58,546,000 | 0.82 | 1,545,000 | 2.53 | 1,878,500 | |
| Meas+Ind | 0.25 / 0.3 | 64,769,000 | 0.86 | 1,784,500 | 2.99 | 2,819,100 | |
| Inferred | 0.25 / 0.3 | 32,301,000 | 0.73 | 754,900 | 0.80 | 85,200 | |
| Underground | Measured | 2.20 | 170,000 | 6.24 | 34,100 | 22.34 | 122,100 |
| Indicated | 2.20 | 2,772,000 | 3.59 | 320,000 | 7.08 | 580,800 | |
| Meas+Ind | 2.20 | 2,942,000 | 3.74 | 354,100 | 8.04 | 702,900 | |
| Inferred | 2.20 | 270,000 | 3.21 | 27,900 | 4.06 | 6,300 | |
| Total | Measured | 6,393,000 | 1.33 | 273,600 | 5.17 | 1,062,700 | |
| Indicated | 61,318,000 | 0.95 | 1,865,000 | 2.98 | 2,459,300 | ||
| Meas+Ind | 67,711,000 | 0.98 | 2,138,600 | 3.42 | 3,522,000 | ||
| Inferred | 32,571,000 | 0.75 | 782,800 | 0.84 | 91,500 | ||
| 1. | Mineral Resources were estimated by ordinary kriging by Dr. Gilles Arseneau, associate consultant of SRK Consulting (Canada) Inc., Mineral Resources were prepared in accordance with NI 43-101 and the CIM Definition Standards for Mineral Resources and Mineral Reserves (2014) and the CIM Estimation of Mineral Resources and Mineral Reserves Best Practice Guidelines (2019). This estimate of Mineral Resources may be materially affected by environmental, permitting, legal, title, taxation, sociopolitical, marketing, or other relevant issues. Mineral Resources that are not Mineral Reserves do not have demonstrated economic viability. |
| 2. | Mineral Resource Estimate effective date: January 17, 2022. |
| 3. | Goliath Open Pit Mineral Resources are reported within an optimized constraining shell at a cut-off grade of 0.25 g/t gold that is based on a gold price of US$1,700/oz, a silver price of US$23/oz, and a gold and silver processing recovery of 93.873*Au(g/t)^0.021 and 60% respectively. |
| 4. | Goldlund Open Pit Mineral Resources are reported within an optimized constraining shell at a cut-off grade of 0.3 g/t gold that is based on a gold price of US$1,700/oz and a gold processing recovery of 90.344*Au(g/t)^0.0527. |
| 5. | Miller Open Pit Mineral Resources are reported within an optimized constraining shell at a cut-off grade of 0.3 g/t gold that is based on a gold price of US$1,700/oz and a gold processing recovery of 93.873*Au(g/t)^0.021. |
| 6. | Goliath Underground Mineral Resources are reported inside shapes generated from Deswik Mining Stope Optimiser (DSO) at a cut-off grade of 2.2 g/t gold that is based on a gold price of US$1,700/oz, a silver price of US$23/oz, and a gold and silver processing recovery of 93.873*Au(g/t)^0.021 and 60% respectively. |
| 7. | Goldlund Underground Mineral Resources are reported inside DSO shapes at a cut-off grade of 2.2 g/t gold that is based on a gold price of US$1,700/oz and a gold processing recovery of 90.344*Au(g/t)^0.0527. |
| 8. | Gold and Silver assays were capped prior to compositing based on probability plot analysis for each individual zones. Assays were composited to 1.5 m for Goliath, 2.0 m for Goldlund and 1.0 m for Miller. |
| 9. | Excludes unclassified mineralization located within mined out areas. |
| 10. | Silver grade and ounces are derived from the Goliath tonnage only. |
| 11. | Goliath Open Pit and Goldlund/Miller cut-off grades are 0.25 g/t and 0.30 g/t, respectively. |
| 12. | Mineral resources are inclusive of Mineral Reserves. |
| 13. | All figures are rounded to reflect the estimates’ relative accuracy, and totals may not add correctly. |
Operations
Mining
The PFS contemplates both open pit and underground mining from the Goliath deposit and open pit mining at the Goldlund and Miller deposits concurrently. The operations will feed a single processing facility located at
Goliath at 6,460 tpd or 2,358 ktpa. Goldlund and Miller feed will be hauled by contractor in highway trucks to Goliath.
The open pit operations will be conventional drill, blast, load, and haul. Loading will be undertaken on 10 m benches with one 11 m3 excavator and along with two 6 m3 excavators which will be used with 63 t haul trucks in the pit. Mining will commence at Goliath with one year of pre-production and two years of production. Production will move to Goldlund in Year 2 until Year 7. The final three stages of Goliath will be mined in Years 7 to 9. Miller will be mined in Years 8 and 9. High grade (HG) feed will be fed preferentially throughout the mine life, with lower grades used to fill the plant to capacity. Mining from the pits will end in Year 9, after which the plant will be fed from the low grade (LG) stockpiles from Goliath and Goldlund until the end of mine life, Year 13. Total material movement from the open pit operations average 14 Mtpa for the first eight years.
Underground mining will be conducted using a long hole open stoping (LHOS) method following a longitudinal retreat approach, with stopes extracted in a bottom-up sequence. The mining fleet will be supplied and operated via a contractor and will consist of modern mobile equipment typically used in narrow-vein LHOS scenarios. Development will begin after the Goliath open pit has started, with production nearest the crown pillar targeted early in the life of mine (LOM) such that those stopes are extracted and backfilled prior to deposition of tailings in the open pit. First ore is achieved in Year 1 with sustained commercial production attained in Year 3. The peak annual ore tonnage is scheduled for Year 7, with a steady decline in production in successive years as the number of active working faces decreases. After mining ceases in Year 13, it will enter closure stage, with approximately 3.8 Mt of ore processed from the underground mine.
Table 4: Segmented Production Schedule and Selected Financial Metrics
| Annual Averages | Year 1-5 | Year 6-9 | Year 1-9 | Year 10-13 | LOM | |
| Recovered Gold Ounces | koz | 116 | 101 | 109 | 48 | 90 |
| Head Grade – Gold | g/t | 1.71 | 1.42 | 1.58 | 0.69 | 1.3 |
| Recovered Silver Ounces | koz | 78 | 80 | 79 | 82 | 80 |
| Head Grade – Silver | g/t | 1.76 | 1.75 | 1.76 | 1.79 | 1.77 |
| Cash Cost* | US$/oz Au | $820 | $996 | $892 | $1,156 | $935 |
| AISC** | US$/oz Au | $1,008 | $1,081 | $1,037 | $1,176 | $1,072 |
| EBITDA | C$M | $145 | $102 | $126 | $38 | $99 |
| Sustaining Capital | C$M | $29 | $11 | $21 | $1 | $15 |
| Post-tax FCF | C$M | $106 | $66 | $88 | $18 | $67 |
| *Cash costs consist of mining costs, processing costs, G&A and refining charges and royalties. Calculated on a by-product basis. See notes on Non-IFRS Financial Measures for more details. |
| **AISC includes cash costs plus sustaining capital. Calculated on a by-product basis. See notes on Non-IFRS Financial Measures for more details. |
Metallurgical Recoveries
The testwork provided was analysed and several options for process routes were reviewed in the initial stages of the pre-feasibility study. Based on the analysis, a conventional leach and carbon-in-leach (CIL) process route was chosen as the most suitable for the deposit and project economics. Gold recoveries include a deduction of 0.6% for soluble and plant loss. Silver recoveries are estimated at 60%.
Table 5: PFS Gold Recoveries
| Deposit | Average Recovery |
| Goliath | 94.6 % |
| Goldlund | 89.5 % |
| Miller | 94.0 % |
| Total | 92.8 % |
Processing
The process plant was designed using conventional processing unit operations to treat up to 6,460 tpd (2.36 Mt/a) based on an availability of 8,059 hours per year or 92%. The crushing plant section design is set at 67% availability.
Ore is hauled from the mine to the primary crushing facility equipped with an apron feeder, grizzly feeder, and jaw crusher. The crushed ore will be conveyed to the secondary scalping screen, where undersize material will bypass the secondary cone crusher while oversized material will be crushed. The two streams will combine and be conveyed to the covered stockpile. The crushed ore will be ground by a SAG mill followed by a closed-circuit ball mill with hydro-cyclone classification. The cyclone feed pump will feed the cluster of hydro-cyclones and second feed pumps. The gravity circuit will be comprised of one scalping screen and a centrifugal batch concentrator. The scalping screen undersize will feed to the centrifugal concentrator, and the concentrate will be collected and subsequently leached by the intensive cyanidation reactor circuit. The scalping screen oversize, gravity concentrator tailings, and the intensive cyanidation reactor tailings will recirculate to the cyclone feed pump box. The cyclone overflow will flow to the high-rate pre-leach thickener prior to the conventional leach and CIL circuit with a final grind size of 80% passing 85 µm. The cyclone underflow will report back to the ball mill.
Gold and silver adsorbed in the CIL circuit will be recovered onto activated carbon and eluted using an AARL carbon elution circuit followed by electrowinning in the gold room. The gold-silver electrowinning sludge will be dried in an oven and mixed with fluxes and smelted in a furnace to pour gold doré bars.
Carbon will be reactivated in a carbon regeneration kiln before being returned to the CIL circuit. CIL tails slurry will be treated in cyanide destruction using the SO2/O2 air process before reporting to a final tailings thickener. Thickener underflow is pumped to the tailings storage facility while tailings thickener overflow reports to process water.
Tailings Management
The tailings management design was completed by SLR based on thickened tailings storage. There are two storage approaches for the project:
The remainder of tailings generated will be used as material for site reclamation, and for generation of paste backfill for the underground mine.
Contact water will be collected in ditches and ponds and be used to provide mill make up water. Surplus collected water will be discharged to the environment following water treatment, as required to meet applicable water quality standards.
Capital and Operating Costs
Capital Costs
The total initial capital cost for the Project is estimated to be $335 million, including $35 million for contingencies. Total sustaining costs are estimated to be $217 million over the life of the mine, including closure costs and salvage values.
Mining initial capital costs were developed by SRK Consulting (Canada) Inc. based on the PFS mine plan. Pre-production was assumed with an owner purchased and operated fleet with contract haulage. Capital costs on leased mining equipment are represented in initial capital where the lease payments or deposits occur within the project construction period and in sustaining capital where they occur during the operating period.
Sustaining capital comprises primarily of underground development during operations, mining equipment leases/purchases and site infrastructure relating to mining and TSF management.
Table 6: LOM Capital Costs
| Initial Capital Costs ($ millions) | |
| Mining equipment and Infrastructure | $16 |
| Pre-production mining | $51 |
| Processing Plant | $99 |
| Infrastructure | $79 |
| Project Indirects | $24 |
| Project Delivery and Owners Costs | $31 |
| Contingency | $35 |
| Total Initial Capital | $335 |
| Sustaining Capital Costs ($ millions) | |
| Mining Equipment | $42 |
| Underground Mine Development | $91 |
| Mining Infrastructure | $23 |
| TSF | $42 |
| Closure and reclamation costs | $29 |
| Salvage Value | ($10) |
| Total Sustaining Capital | $217 |
Operating Costs
Mine operating costs are estimated to be $4.22/t mined (open pit) and $61.23/t mined (underground), with unit costs estimated by SRK Mining Consulting (Canada) Inc. based on 2022 quotes and database costs. Processing costs have been estimated by Ausenco from first principles using 2022 prices for reagents and other inputs. G&A costs are based on benchmark salaries for staff and other costs from Ausenco databases. On-site accommodations and some warehousing and general administrative office costs are not included in the estimates given the site’s proximity to the town of Dryden, ON, and the expectation that these services would be available locally.
Table 7: LOM Operating Cost
| Item | Value | Units |
| Tonnes Mined, excluding pre-strip | 131.4 | Mt |
| Tonnes Milled, LOM | 30.3 | Mt |
| Payables Ounces | 1.175 | Moz |
| Mining Costs | $995
$4.22 $61.23 $32.83 |
C$M
C$/tonne mined (OP) C$/tonne mined (UG) C$/tonne milled |
| Processing & Water Treatment | $344
$11.34 |
C$M
C$/tonne milled |
| Mining Transportation | $119
$7.00 |
C$M
C$/tonne transported |
| G&A | $107
$3.54 |
C$M
C$/tonne milled |
| Total | $1,447
$47.71 |
C$M
C$/tonne milled |
| Au Off-Site Costs, Refining and Transport | $5.00 | C$/oz |
| Silver Credit | $29 | C$M |
| Royalties | $51 | C$M |
| Total Cash Costs* | $935 | US$/oz |
| Sustaining, Expansion, Closure Capital | $217 | C$M |
| Total AISC* | $1,072 | US$oz |
| *By-product basis. See notes on Non-IFRS Financial Measures |
Financial Analysis
At a US$1,750 gold price and a US$:C$ exchange rate of $1.34, the Project generates a post-tax NPV of $336 million and a post-tax IRR of 25.4%. Payback on initial capital is 2.8 years. Pre-tax, the NPV is $469 million, with a 29.3% IRR and a payback of 2.8 years. The valuation of the Project is discounted to July 1, 2023.
At spot metals prices and exchange rates (US$1,845 gold, US$22.00 silver, US$:C$ exchange rate of $1.355), the Project generates a post-tax NPV of $425, with a post-tax IRR of 30.1% and a 2.5 year payback period. Assuming a US$1,550 gold price, the Project would generate a post-tax IRR of 16.6% and generates a positive return on a post-tax basis above a gold price of US$1,250/ounce. At the end of the capital period, the Project would have a post-tax NPV of $711 million at the base case gold price.
The PFS assumes the Company exercises its right to repurchase 50% of the 2.2% Net Smelter Returns Royalty that the Company sold to Sprott Resources Streaming and Royalty Corp for US$20 million in April 2022 and 0.5% of the 1.5% Net Smelter Returns Royalty that the Company sold to First Mining Gold Corp. in August 2020 as part of the purchase of Tamaka Gold Corporation. In addition, several other smaller royalties across the property package are assumed to be repurchased. The cost of the repurchase of these royalties are excluded from project level economic analysis.
Table 8: Sensitivity Analysis NPV and IRR
| Gold Price $/oz | |||||
| $1,550 | $1,650 | $1,750 | $1,850 | $1,950 | |
| Pre-tax NPV (C$M) | $244 | $357 | $469 | $581 | $693 |
| Post-tax NPV (C$M) | $178 | $257 | $336 | $414 | $493 |
| Pre-tax IRR | 19.1 % | 24.4 % | 29.3 % | 33.9 % | 38.4 % |
| Post-tax IRR | 16.6 % | 21.1 % | 25.4 % | 29.6 % | 33.5 % |
| Pre-tax payback (years) | 3.7 | 3.2 | 2.8 | 2.5 | 2.3 |
| Post-tax payback (years) | 3.8 | 3.2 | 2.8 | 2.5 | 2.3 |
Table 9: Valuation Sensitivities to Certain Operating Parameters, post-tax, unlevered
| -20 % | -10 % | 0 % | 10 % | 20 % | ||
| Operating Cost | IRR | 32.1 % | 28.8 % | 25.4 % | 21.8 % | 17.9 % |
| NPV (C$M) | $479 | $407 | $336 | $264 | $192 | |
| Initial Capital Cost | IRR | 34.2 % | 29.4 % | 25.4 % | 22.1 % | 19.3 % |
| NPV (C$M) | $400 | $368 | $336 | $303 | $271 | |
| -10 % | -5 % | 0 % | 5 % | 10 % | ||
| $C:$US F/X | IRR
NPV (C$M) |
33.4%
$490 |
29.3%
$409 |
25.4%
$336 |
21.8%
$269 |
18.4%
$209 |
Environmental and Permitting Assessment
The Goliath Project, Goldlund Mine Project and Miller Project are three distinct project properties and will go through their own permitting processes as each site is developed. The Goliath Project site is prepared to move into the next permitting phase, which will be supported by the substantial baseline information gathered during the environmental assessment process.
Environment baseline data collection for the Goldlund Mine Project and Miller Project sites was initiated in 2021, which built upon basic scoping level aquatic information gathered in 2017. To date, baseline environmental studies have been conducted addressing aspects of surface water quality, aquatic resources (including sediment quality, benthic invertebrate community, fish community and fish habitat), hydrology, hydrogeology and groundwater quality, terrestrial resources, and geochemistry.
Provincial permitting will typically involve acquisition of environmental permits and approvals primarily from the Ministry of the Environment, Conservation and Parks (MECP), the Ministry of Natural Resources and Forestry (MNRF), and the Ministry of Mines (MINES). Typical provincial environmental approvals are expected to be required for construction and operation of each of the three Project sites, including: Mine Closure Plan; Forest Resource Licenses; Environmental Compliance Approval – Industrial Sewage Works for contact water management, treatment and discharge; Environmental Compliance Approval for air and noise emissions; Permits to Take Water; Work Permits and Land Use Permits for construction of roads, water crossings, work on/near shorelines and watercourse realignments.
A federal Fisheries Act Authorization and an amendment to Schedule 2 of the Metal and Diamond Mining Effluent Regulations will be required for Goliath Project citing of site infrastructure and the TSF.
As proposed in the PFS, the Goliath Mill ore input capacity has increased to the rate of approximately 6,500 t/day. In consideration of the Impact Assessment Agency’s Physical Activities Regulation, Section 19, (c),(d), if mine and mill rates exceed 5,000 t/day, but the area of mine or mill operations does not increase greater than 50%, a new environmental assessment is not required.
Community Consultations
The Company has actively engaged local and regional communities, First Nations and other stakeholders to gain an understanding of their issues and interests, identify potential partnerships, and build social acceptance for the three Projects. Stakeholders involved in Project consultations to date include those with a direct interest in the Project, and those who provided data for the baseline studies. The involvement of stakeholders will continue throughout the various Project stages.
Non-Indigenous public interest groups were identified as part of past, present and future consultation and engagement efforts. This includes the Village of Wabigoon, City of Dryden, Town of Sioux Lookout and other regional partners and stakeholders.
The three Project sites are located within the Treaty 3 (1873) area of Ontario, which affords hunting, trapping and fishing rights and protections, and it has been shared with Treasury that there are areas within the GGC property boundaries for the exercise of aboriginal and treaty rights. The Company is committed to working collaboratively with Indigenous and regional communities to ensure informed and engaged dialogue throughout the life of the Projects.
Additional Information
Following the release of the PFS, Treasury will undertake optimization studies prior to the commencement of a Feasibility Study.
NI 43-101 Technical Report
Treasury expects to file on SEDAR within 45 days of this news release the Technical Report for the PFS prepared in accordance with the requirements of NI 43–101, including a description of the updated Mineral Resource Estimate and the Mineral Reserve Estimate. For readers to fully understand the information in this news release, they should read the Technical Report in its entirety, including all qualifications, assumptions and exclusions that relate to the PFS. The Technical Report is intended to be read as a whole, and sections should not be read or relied upon out of context.
Qualified Persons
Floyd Varley, P. Eng, Maura Kolb, M.Sc., P.Geo., Director of Exploration and Adam Larsen, P. Geo., Exploration Manager, are each considered a “Qualified Person” for the purposes of NI 43-101 and have reviewed and approved the scientific and technical disclosure contained in this news release on behalf of Treasury.
QA / QC
The Company has implemented a quality assurance and quality control program to ensure sampling and analysis of all exploration work is conducted in accordance with the CIM Exploration Best Practices Guidelines. The drill core is sawn in half with one-half of the core sample dispatched to Activation Laboratories Ltd. facility located in Dryden, Ontario. The other half of the core is retained for future assay verification and/or metallurgical testing. Other QA/QC procedures include the insertion of blanks and Canadian Reference Standards for every tenth sample in the sample stream. A quarter core duplicate is assayed every 20th sample. The laboratory has its own QA/QC protocols running standards and blanks with duplicate samples in each batch stream. Additional checks are routinely run on anomalous values including gravimetric analysis and pulp metallic screen fire assays. Gold analysis is conducted by lead collection, fire assay with atomic absorption and/or gravimetric finish on a 50-gram sample. Check assays are conducted at a secondary ISO certified laboratory (in this case AGAT Laboratories located in Mississauga, Ontario) following the completion of a program.
Data Verification
The Qualified Persons for the mineral resource and mineral reserve estimates visited the site on July 7 and 8, 2021. During this visit, collar locations were verified, as were the core storage, security and sampling techniques and the assay lab was visited. The database provided to the QP by the Company was verified against original certificates provided by the assay laboratory and only minor corrections were made to the database based on the checks.
Check assays and twinned holes were previously completed, as well as check assays done based on the QP’s recommendations. The QP concluded that the Goliath Gold Complex database is suitable for mineral resource and mineral reserve estimation. Historical drillings were statistically validated and did not show a material bias. Therefore, the QP has concluded that all past drilling is not biased and suitable for the mineral resource and mineral reserve estimate.
In the opinion of the QP responsible for the preparation of the Technical Report, the data, assumptions, and parameters used to estimate mineral resources and mineral reserves, and to develop the metallurgical model, the economic analysis, and the PFS are sufficiently reliable for those purposes.
About Treasury Metals Inc.
Treasury Metals Inc. is a gold-focused company with assets in Canada. Treasury’s Goliath Gold Complex, which includes the Goliath, Goldlund and Miller deposits, is located in Northwestern Ontario. The deposits benefit substantially from excellent access to the Trans-Canada Highway, related power and rail infrastructure and close proximity to several communities, including Dryden, Ontario. The Company also owns several other projects throughout Canada, including the Weebigee-Sandy Lake Gold Project JV, and grassroots gold exploration property Gold Rock. Treasury is committed to inclusive, informed and meaningful dialogue with regional communities and Indigenous Nations throughout the life of all our Projects and on all aspects, including creating sustainable economic opportunities, providing safe workplaces, enhancing social value and promoting community well-being.
The Goliath Gold Complex is located in Treaty #3 (1873), and on land that has been used and occupied since time immemorial by the Anishinaabe Peoples. Treasury recognizes the unique connection between Indigenous Peoples and lands and how mining can affect this connection in various challenging ways. The Company recognizes the collective rights and interests of Indigenous Peoples in line with the United Nations Declaration on the Rights of Indigenous Peoples. Treasury is committed to understanding and respecting local communities’ cultural heritage, rights and norms. We seek to develop meaningful partnerships and dialogue with the communities associated with our Project to contribute to social and economic participation and benefits-sharing.
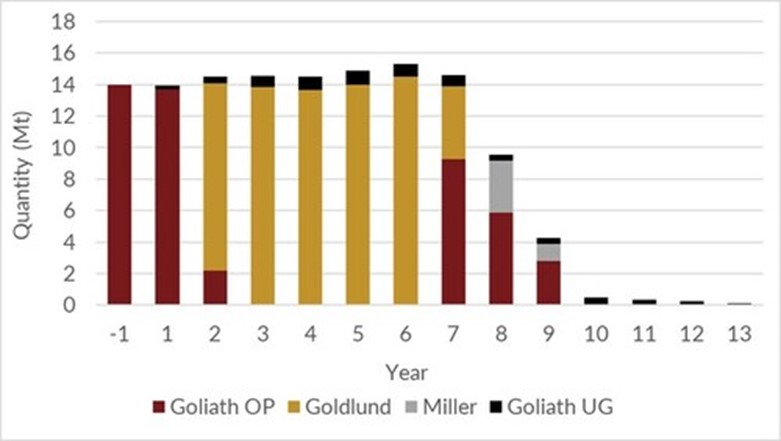
Chart 1: Annual Tonnes Mined (CNW Group/Treasury Metals Inc.)
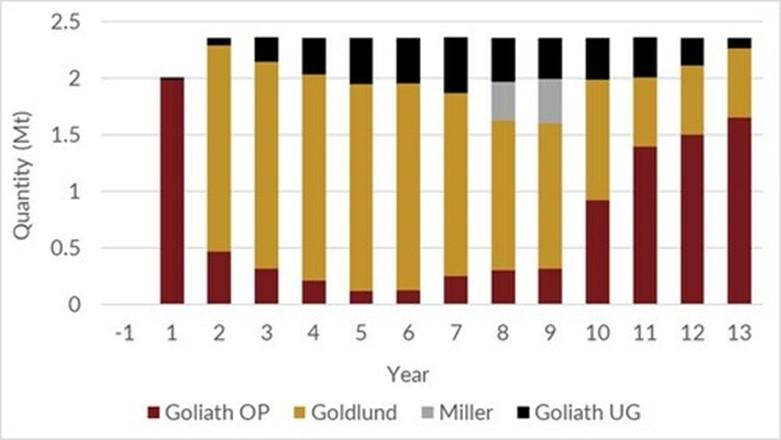
Chart 2: Annual Mill Feed (CNW Group/Treasury Metals Inc.)
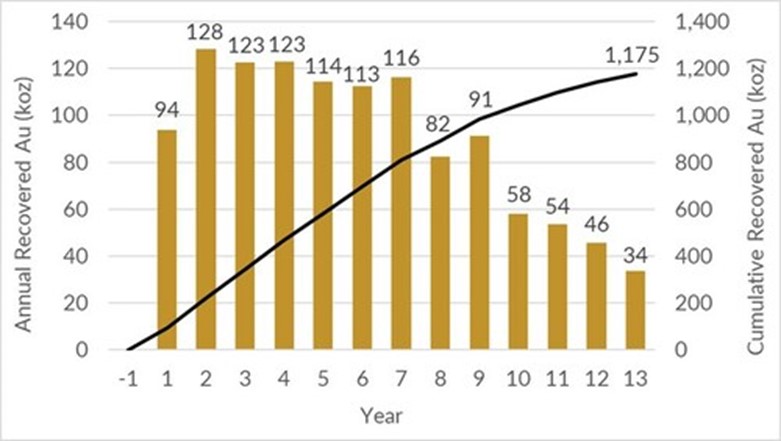
Chart 3: Annual Production (CNW Group/Treasury Metals Inc.)
Hudbay Minerals Inc. (TSX:HBM) (NYSE: HBM) today released its ann... READ MORE
Strategic acquisition of an established operating gold mine, loca... READ MORE
Cerro de Pasco Resources Inc. (TSX-V: CDPR) (OTCQB: GPPRF) (FRA: ... READ MORE
The Garneau Titanium Project Features Ilmenite-Rich Boulder with ... READ MORE
ValOre Metals Corp. (TSX‐V: VO) (OTCQB: KVLQF) (Frankfurt: KEQ0... READ MORE


