


Superior Gold Inc. (TSX-V: SGI) (OTCQX: SUPGF) announces financial results for the first quarter of 2023 for the Company’s 100%-owned Plutonic Gold Operations, located in Western Australia.
First Quarter Highlights
| 1 For Non-IFRS Measures noted above and included elsewhere in this news release, refer to the Non-IFRS measures section of the Company’s MD&A for a description of these measures. . |
Chris Jordaan, President and CEO of Superior Gold stated: “The Company remained focused on improving its leading key performance indicators during the first quarter of 2023. Development and production drilling rates remain on a positive trajectory since we ceased open pit operations in order to re-focus on the underground.
Importantly, drilled stocks increased by approximately five-fold to 95,466t compared to the end of Q4 2022. Development and production drilling rates along with improved stock inventories were delivered to plan and were much improved over 2022 levels. In addition, these initiatives have led to improving underground production from 11,923 ounces in Q4 2022 to 14,329 in Q1 2023, a 20% improvement. By continuing to focus on these leading performance indicators the Company expects to improve its operational flexibility throughout the remainder of 2023.
Plutonic requires consistent drilling and development and we are starting to see the benefits of the operational improvement program implemented in the fourth quarter of 2022. April production was 5,818oz of gold with sales of 5,783oz, delivering improved performance and cash flow. In April 2023, 87,547t of total ore were mined at an overall grade of 2.41g/t with a stope grade of 2.53g/t. The improved development rates, drilled stocks and ability to truck the ore to surface have all contributed to this performance as we continue to implement the Plutonic Operational Improvement Program.
We continue to advance work on the transaction with Catalyst for the scheduled special meeting of shareholders for June 26, 2023.”
Summary of Operational and Financial Results:
Operational details for the last three quarters are summarized in the table below:
| Operating Parameters1 | Three Months Ended
Mar 31, 2023 |
Three Months Ended
Dec 31, 2022 |
Three Months Ended
Sept 30, 2022 |
| Stope material mined (Tonnes) | 197,600 | 153,951 | 148,980 |
| Stope grade mined (g/t Au) | 2.41 | 2.41 | 2.62 |
| Stope production drilling (metres) | 41,371 | 46,382 | 22,466 |
| Development material mined (Tonnes) | 36,187 | 57,519 | 29,020 |
| Development grade mined (g/t Au) | 1.28 | 0.99 | 0.82 |
| Development metres | 1,853 | 1,971 | 1,608 |
| Surface material milled (Tonnes) | 7,588 | 138,143 | 261,437 |
| Surface material grade (g/t Au) | 0.52 | 0.67 | 0.65 |
| Total material milled (Tonnes) | 246,439 | 359,900 | 438,987 |
| Grade milled (g/t Au) | 2.14 | 1.46 | 1.32 |
| Gold recovery (%) | 85 % | 86 % | 86 % |
| Gold Produced (ounces) | 14,437 | 14,448 | 15,946 |
| Gold Sold (ounces)2 | 14,351 | 14,794 | 14,875 |
| Total cash costs ($/ounce)3 | $1,827 | $1,964 | $1,789 |
| All-in sustaining costs ($/ounce)3 | $1,969 | $2,091 | $1,989 |
| 1 Numbers may not add due to rounding. | |||
| 2 Difference between produced and sold is due to timing of sales vs production for the period. | |||
| 3 For Non-IFRS Measures noted above and included elsewhere in this news release, refer to the Non-IFRS measures section of the Company’s MD&A for a description of these measures. | |||
Financial details for the first quarter of 2023 and comparable quarter of 2022 are summarized in the table below:
| Financial Parameters
All amounts in $ millions except where noted |
Three months
Ended March 31, 2023 |
Three months
Ended March 31, 2022 |
| Revenue | 26,516 | 30,216 |
| Cost of sales | 29,618 | 26,691 |
| General and administrative | 2,237 | 1,465 |
| Operating income (loss) | (5,532) | 1,441 |
| Income (loss) before taxes | (7,331) | 1,281 |
| Net income (loss) | (7,362) | 1,424 |
| Earnings (loss) per share – basic and diluted | (0.06) | 0.01 |
| Adjusted net income (loss)1 | (6,352) | 1,424 |
| Adjusted net income (loss) per share – basic1 | (0.05) | 0.01 |
| Cash flow from operations after working capital changes | (2,189) | 412 |
| Weighted average number of common shares outstanding (basic) | 123,419,989 | 122,888,508 |
| 1 For Non-IFRS Measures noted above and included elsewhere in this news release, refer to the Non-IFRS measures section of the Company’s MD&A for a description of these measures. | ||
Plutonic Gold Operations
The Plutonic Gold Operations produced and sold 14,437 and 14,351 ounces of gold, respectively, for the first quarter of 2023. In comparison, 16,747 and 15,823 ounces of gold were produced and sold, respectively for the first quarter of 2022. The reduction over the comparable prior period in 2022 was primarily a result of lower grade tonnes milled from underground operations and no contribution of tonnages from open pit sources in the first quarter of 2023. During the comparable quarter of 2022, open pit tonnes milled were sourced from the Plutonic East and Perch open pits.
Total cash costs of $1,827/ounce sold were below the realized gold price of $1,846/ounce, while all-in sustaining costs of $1,969/ounce sold were above, for the three-month period ended March 31, 2023. Total cash costs of $1,558/ounce sold and all-in sustaining costs of $1,729/ounce sold were below the realized gold price of $1,910/ounce for the three-month period ended March 31, 2022.
The Company generated a net loss from operations of $5.5 million for the three months ended March 31, 2023 compared operating income of $1.4 million in the comparable period of 2022. The reduction was driven by primarily lower revenue from lower ounces sold, increased depreciation and a reduction in changes in inventory due to a build up of gold in circuit and the timing of sales at the end of the quarter of 2022
2023 Plutonic Operational Improvement Program and April 2023 Comparative Results
During the fourth quarter of 2022, the Company suspended open-pit mining operations and focused solely on the underground mine and the key leading performance indicators to target future improved operational results. The key performance drivers identified included: i) a commitment to further improving safety performance, ii) a drive to improve development rates to improve access to an increased number of stopes and at higher grades, iii) increased production drilling rates, iv) improved underground drilled and broken stock, and v) improved underground unit mining costs. The following figures illustrate the operation’s key leading performance indicators.
Development rates were 1,853 metres for Q1 2023, down 4% on a daily rate from 1,971 metres achieved in Q4 2022. Rates equivalent to Q4 2022 have been maintained in April. Lower rates were planned for Q1 and Q2, 2023 with the Company ramping up to a target in excess of 2,100metres per quarter later in 2023 given the latest optimised mine planning and schedules.
Production drilling rates were 41,371 metres for Q1 2023, down from 46,382 in the fourth quarter, but remain well above the rates achieved during the COVID impacted quarters of Q2 and Q3 2022. Rig availability was impacted in the latter half of Q1 and into April, however, the Company is commissioning a rental unit in May to improve rates. Higher productivity from the drill rigs in operation has contributed to an uplift in stope tonnes liberated per metre of long hole drilling and at these demonstrated rates, the Company revised the monthly target to between 18,000-18,500m/month.
Total underground ore mined has increased markedly from Q3 2022. Continued improvements has resulted in an increase in total ore mined to 89,958 tonnes for April, a 15% improvement over the Q1 2023 and a 27% increase relative to Q4 2022 average monthly rate.
Qualified Person
The scientific and technical information in this news release has been reviewed and approved by Ettienne Du Plessis, who is a “qualified person” as defined by National Instrument 43-101 – Standards of Disclosure for Mineral Projects. Mr. Du Plessis is not independent of the Company within the meaning of NI 43-101.
About Superior Gold
Superior Gold is a Canadian-based gold producer that owns 100% of the Plutonic Gold Operations located in Western Australia. The Plutonic Gold Operations include the Plutonic underground gold mine and central mill, numerous open-pit projects, and an interest in the Bryah Basin joint venture. Superior Gold is focused on expanding production at the Plutonic Gold Operations and building an intermediate gold producer with superior returns for shareholders.
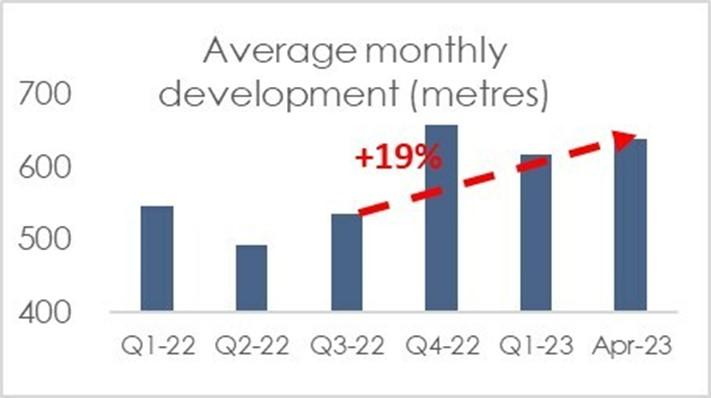
Figure 1. (CNW Group/Superior Gold Inc.)
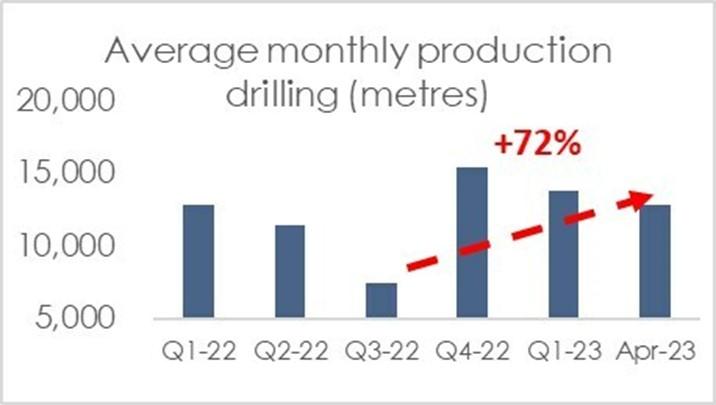
Figure 2. (CNW Group/Superior Gold Inc.)
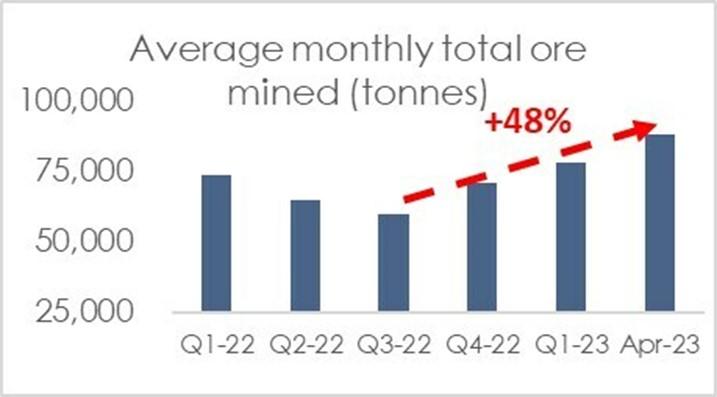
Figure 3. (CNW Group/Superior Gold Inc.)
Hudbay Minerals Inc. (TSX:HBM) (NYSE: HBM) today released its ann... READ MORE
Strategic acquisition of an established operating gold mine, loca... READ MORE
Cerro de Pasco Resources Inc. (TSX-V: CDPR) (OTCQB: GPPRF) (FRA: ... READ MORE
The Garneau Titanium Project Features Ilmenite-Rich Boulder with ... READ MORE
ValOre Metals Corp. (TSX‐V: VO) (OTCQB: KVLQF) (Frankfurt: KEQ0... READ MORE


