








Highlights
Selkirk Copper Mines Inc. (TSX-V: SCMI) (FSE: IO20) (OTCQX: SKRKF) is pleased to announce the results of an updated Mineral Resource Estimate for the Minto Project in the Yukon, Canada which is being used for the development of an updated Preliminary Economic Assessment.
Growing the Measured and Indicated Resource category by 280% in our Phase 1 drill program demonstrates the significant potential to grow mineable resources within the Minto Mine Property in a cost-effective and timely manner. It supports the overall restart program objectives and strongly suggests that we have the opportunity to further upgrade and enhance the quality of the copper-gold-silver mineralized lenses which have the potential to further improve the quality of our mine plans in the upcoming Feasibility Study as well as into the future.
Additionally, from this program, the exploration & geosciences team has developed an enhanced understanding of the geology and structural controls of the sixty-nine mineralized lenses which has created a coherent and actionable drill targeting methodology that has resulted in the discovery of several new lenses of high-grade copper-gold-silver mineralization within the mine footprint. This targeting methodology, which takes into consideration geological, geochemical, geophysical, structural, and topologic information, is being applied within the central mine area to further increase mineable resources, but also, for the first time to Selkirk Copper’s 26,850 hectares of mineral claims in the Minto-Carmacks belt.
We look forward to integrating results of our Phase 2 50,000 metre drill program, of which 37,000 metres of drilling has already been completed, into the growing Inferred, Indicated, and Measured Resources on the Minto Project. The Phase 2 program will to continue to upgrade the confidence of mineralization on the property and to support a feasibility study scheduled to start in Q3 2026.”
The Updated Mineral Resource Estimate
The updated MRE contains both underground and open pit resources. The underground contains Measured & Indicated Resources of 26.0 million tonnes grading 1.14% Cu, 0.49 g/t Au, and 4.4 g/t Ag, plus an additional Inferred Resource of 9.8 million tonnes grading 0.91% Cu, 0.36 g/t Au, and 3.5 g/t Ag. The open pit contains an additional 21.8 million tonnes of Indicated Resources grading 0.59% Cu, 0.17 g/t Au, and 1.8 g/t Ag, plus Inferred Resources of 7.1 million tonnes grading 0.55% Cu, 0.13 g/t Au, and 1.6 g/t Ag. A small amount of Measured Resources have been established, representing a higher category of confidence for some underground mining areas.
In total, the updated MRE contains 940 million lbs copper, 530 koz gold, and 4.97 million oz silver in the Measured & Indicated categories and an additional 281 million lbs copper, 142 koz gold, and 1.5 million oz silver in the Inferred category.
The resource estimate is summarized in Table 1 below, with sensitivities to various NSR cut-offs detailed in Table 2 and Table 3. The updated MRE was prepared by Sue Bird, P.Eng., of Moose Mountain Technical Services who is independent of Selkirk Copper. A technical report prepared in accordance with National Instrument 43-101 – Standards of Disclosure for Mineral Projects (the “Technical Report”) will be filed on the Company’s website and SEDAR+ within 45 days of the date of this press release.
Relevant assumptions used in the MRE are detailed below and will be further described in the Technical Report. The $30 (open pit) and $80 (underground) CAD$/tonne NSR cutoffs were selected as they correlate to marginal mining and processing cost assumptions expected in the upcoming PEA design basis. With the release of this updated MRE, Selkirk Copper’s previous technical reports, including the 2025 MRE1, are no longer current and should not be relied upon.
Table 1: Updated summary of mineral resources for the Minto Project
| Type | Cutoff (CAD$) |
Class | ROM | In situ Grades | Metal | |||||||
| Tonnage (000) | NSR (CAD$) | Cu (%) | Au (gpt) | Ag (gpt) | Ox Ratio | ASCu (%) | Cu (Mlbs) | Au (Koz) | Ag (Koz) | |||
| Open Pit | $30 | Indicated | 21,779 | $80.63 | 0.59 | 0.17 | 1.8 | 0.11 | 0.073 | 283 | 122 | 1,294 |
| Inferred | 7,052 | $74.61 | 0.55 | 0.13 | 1.6 | 0.08 | 0.048 | 85 | 30 | 354 | ||
| UG | $80 | Measured | 348 | $153.47 | 0.92 | 0.39 | 3.3 | 0.05 | 0.041 | 7 | 4 | 36 |
| Indicated | 25,679 | $189.20 | 1.15 | 0.49 | 4.4 | 0.06 | 0.067 | 650 | 404 | 3,638 | ||
| Meas + Ind | 26,027 | $188.72 | 1.15 | 0.49 | 4.4 | 0.06 | 0.070 | 657 | 408 | 3,674 | ||
| Inferred | 9,812 | $146.57 | 0.91 | 0.36 | 3.5 | 0.05 | 0.044 | 196 | 112 | 1,113 | ||
| Total | Varies as Above | Meas + Ind | 47,806 | $139.48 | 0.89 | 0.34 | 3.2 | 0.08 | 0.070 | 940 | 530 | 4,969 |
| Inferred | 16,865 | $116.48 | 0.76 | 0.26 | 2.7 | 0.06 | 0.046 | 281 | 142 | 1,467 | ||
|
Notes to Table 1:
|
||||||||||||
The mineral resource estimate includes Inferred mineral resources that are considered too speculative geologically to have economic considerations applied to them that would enable them to be converted to mineral reserves. Mineral Resources that are not Mineral Reserves do not have demonstrated economic viability. However, a primary objective of Selkirk Copper’s ongoing Phase 2 drill program is targeting the Inferred resources, as defined in this MRE update, at a similar drill spacing as the Indicated resources.
The Qualified Person(s) are of the opinion that issues relating to all relevant technical and economic factors likely to influence the prospects of eventual economic extraction can be resolved with further work. These factors may include environmental permitting, infrastructure, sociopolitical, marketing, or other relevant factors. Factors that may affect the estimates include: metal price assumptions, changes in interpretations of mineralization geometry or continuity due to future drilling results, changes to interpolation assumptions or methodology, metallurgical recovery assumptions, mining method assumptions, or operating cost assumptions.
Key Results from the Resource Estimate
The 2026 MRE represents a significant increase in tonnage and contained metal compared to the 2025 MRE1, as well as a significant increase in the proportion of Indicated resources.
These increases can be attributed to multiple factors, including the following:
The Phase 1 Drill Program was successful in the objective of resource expansion in four key locations:
The results of the Phase 1 Drill Program demonstrate the potential for significant new discoveries and expansion of known resources located close to the previous mining areas. The efficiency of the Phase 1 drill program to deliver these resources is a testament to the team’s ability to rapidly develop geological knowledge of the deposit and leverage it to deliver high-quality results.
Additionally, updated metal pricing and design basis assumptions utilized in the 2026 MRE elevated lower grade material above the NSR cut-off. This resulted in an overall increase of tonnage with reasonable prospects of eventual economic extraction, but also resulted in a lower average grade. Detailed evaluation of the 2026 MRE indicates that approximately half of the overall expansion of Indicated resources is due to increased metal prices and changes to design basis assumptions; whereas the other half is due to exploration success through drilling. Development of an updated Mine Plan is underway as part of the upcoming PEA Study, and this mine plan will seek to maximize value from the 2026 MRE towards the targeted 12-15 year mine life.
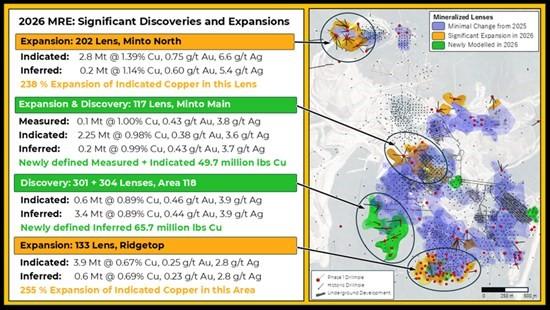
Figure 1: Plan view map highlighting four key areas of resource expansion and discovery contributing to resource growth in the 2026 mineral resource estimate. Results are described in comparison to 2025 MRE1.
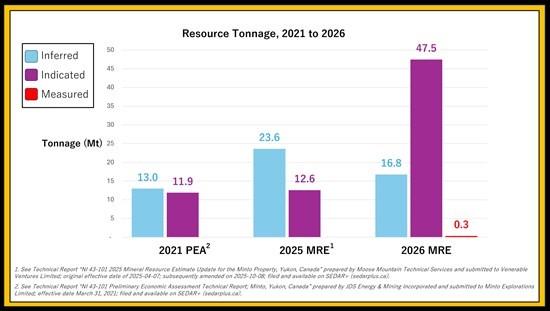
Figure 2: Visualization of resource tonnage in Inferred, Indicated, and Measured categories from the 2026 MRE compared to previous studies including the 2025 MRE1 and the 2021 PEA2. The details resource estimation and design basis are different for each study, refer to the documents listed in the References for more details.
MRE Cut-off Sensitivities
Table 2: Summary of the underground resources and their sensitivity to various NSR cut-offs
| Mining Type | Class | Cutoff | ROM | In situ Grades | Metal | |||||||
| (CAD$) | Tonnage (000) | NSR (CAD$) | Cu (%) | Au (gpt) | Ag (gpt) | Ox Ratio | ASCu (%) | Cu (Mlbs) | Au (Koz) | Ag (Koz) | ||
| Under Ground |
Measured | $60 | 380 | $146.60 | 0.882 | 0.377 | 3.14 | 0.05 | 0.041 | 7.4 | 4.6 | 38.3 |
| $70 | 368 | $149.25 | 0.897 | 0.383 | 3.2 | 0.05 | 0.041 | 7.3 | 4.5 | 37.7 | ||
| $80 | 348 | $153.47 | 0.923 | 0.393 | 3.3 | 0.05 | 0.041 | 7.1 | 4.4 | 36.5 | ||
| $90 | 326 | $157.95 | 0.949 | 0.404 | 3.4 | 0.05 | 0.042 | 6.8 | 4.2 | 35.2 | ||
| $100 | 290 | $165.80 | 0.993 | 0.425 | 3.5 | 0.05 | 0.042 | 6.4 | 4.0 | 32.8 | ||
| $110 | 253 | $174.84 | 1.042 | 0.450 | 3.7 | 0.04 | 0.043 | 5.8 | 3.7 | 30.4 | ||
| Indicated | $60 | 29,324 | $174.44 | 1.071 | 0.447 | 4.08 | 0.07 | 0.067 | 692.1 | 421.4 | 3,847.8 | |
| $70 | 27,526 | $181.57 | 1.108 | 0.467 | 4.2 | 0.06 | 0.067 | 672.4 | 413.3 | 3,751.2 | ||
| $80 | 25,679 | $189.20 | 1.148 | 0.489 | 4.4 | 0.06 | 0.067 | 649.8 | 403.7 | 3,637.8 | ||
| $90 | 23,747 | $197.68 | 1.193 | 0.514 | 4.6 | 0.06 | 0.067 | 624.4 | 392.4 | 3,510.1 | ||
| $100 | 21,613 | $207.79 | 1.246 | 0.544 | 4.8 | 0.06 | 0.069 | 593.7 | 378.1 | 3,356.1 | ||
| $110 | 19,551 | $218.63 | 1.303 | 0.577 | 5.1 | 0.06 | 0.070 | 561.7 | 362.5 | 3,193.7 | ||
| M+I | $60 | 29,704 | $174.08 | 1.068 | 0.446 | 4.07 | 0.07 | 0.067 | 699.5 | 426.0 | 3,886.1 | |
| $70 | 27,894 | $181.15 | 1.105 | 0.466 | 4.2 | 0.06 | 0.066 | 679.7 | 417.9 | 3,788.9 | ||
| $80 | 26,026 | $188.72 | 1.145 | 0.488 | 4.4 | 0.06 | 0.066 | 656.9 | 408.1 | 3,674.3 | ||
| $90 | 24,073 | $197.14 | 1.189 | 0.512 | 4.6 | 0.06 | 0.067 | 631.2 | 396.6 | 3,545.2 | ||
| $100 | 21,904 | $207.24 | 1.243 | 0.543 | 4.8 | 0.06 | 0.068 | 600.0 | 382.1 | 3,389.0 | ||
| $110 | 19,803 | $218.07 | 1.300 | 0.575 | 5.1 | 0.06 | 0.070 | 567.5 | 366.2 | 3,224.1 | ||
| Inferred | $60 | 11,810 | $133.59 | 0.836 | 0.323 | 3.3 | 0.06 | 0.045 | 217.6 | 122.5 | 1,238.0 | |
| $70 | 10,741 | $140.42 | 0.874 | 0.340 | 3.4 | 0.06 | 0.045 | 206.9 | 117.6 | 1,175.8 | ||
| $80 | 9,812 | $146.57 | 0.907 | 0.356 | 3.5 | 0.05 | 0.044 | 196.3 | 112.2 | 1,112.7 | ||
| $90 | 8,511 | $155.97 | 0.959 | 0.381 | 3.7 | 0.05 | 0.044 | 179.9 | 104.2 | 1,018.3 | ||
| $100 | 7,171 | $167.26 | 1.017 | 0.418 | 4.0 | 0.05 | 0.046 | 160.7 | 96.3 | 919.7 | ||
| $110 | 6,139 | $177.77 | 1.070 | 0.450 | 4.2 | 0.05 | 0.047 | 144.9 | 88.9 | 833.3 | ||
Table 3: Summary of the open pit resources and their sensitivity to various NSR cut-offs
| Mining Type | Class | Cutoff | ROM | In situ Grades | Metal | |||||||
| (CAD$) | Tonnage (000) | NSR (CAD$) | Cu (%) | Au (gpt) | Ag (gpt) | Ox Ratio | ASCu (%) | Cu (Mlbs) | Au (Koz) | Ag (Koz) | ||
| Open Pit | Indicated | $25 | 23,444 | $76.86 | 0.566 | 0.165 | 1.8 | 0.11 | 0.073 | 292.7 | 124.6 | 1,336.9 |
| $30 | 21,779 | $80.63 | 0.589 | 0.174 | 1.8 | 0.11 | 0.073 | 282.8 | 121.7 | 1,294.3 | ||
| $40 | 18,455 | $88.86 | 0.638 | 0.193 | 2.0 | 0.10 | 0.073 | 259.5 | 114.6 | 1,194.2 | ||
| $50 | 15,070 | $98.72 | 0.697 | 0.218 | 2.2 | 0.09 | 0.076 | 231.7 | 105.8 | 1,069.9 | ||
| $60 | 11,961 | $110.12 | 0.767 | 0.249 | 2.4 | 0.09 | 0.080 | 202.1 | 95.9 | 934.2 | ||
| Inferred | $25 | 7,673 | $70.80 | 0.521 | 0.125 | 1.5 | 0.08 | 0.047 | 88.1 | 30.9 | 369.9 | |
| $30 | 7,052 | $74.61 | 0.546 | 0.133 | 1.6 | 0.08 | 0.048 | 85.0 | 30.1 | 353.8 | ||
| $40 | 5,850 | $82.75 | 0.599 | 0.149 | 1.7 | 0.07 | 0.049 | 77.2 | 28.1 | 320.8 | ||
| $50 | 4,517 | $93.88 | 0.669 | 0.175 | 1.9 | 0.07 | 0.052 | 66.6 | 25.5 | 272.7 | ||
| $60 | 3,209 | $109.82 | 0.767 | 0.217 | 2.1 | 0.07 | 0.058 | 54.3 | 22.4 | 218.0 | ||
Details of the Mineral Resource Estimate
The 2026 MRE is supported by results from Selkirk Copper’s Phase 1 Drill Program, comprising 52,288 metres of drilling in 175 holes, as well as historical drilling. Results from Selkirk Copper’s ongoing Phase 2 Drill Program have not been included into this resource estimate. In total, the 2026 MRE is supported by 428,388 metres of drilling in 1,956 holes. This drilling database includes geochemical assays, lithological and mineralogical information, structural measurements, and density measurements. A robust program of QAQC and data verification was maintained to ensure the drilling database is appropriate for resource estimation.
The workflows for geological modelling and resource estimation used in the 2026 MRE is similar to the previous 2025 MRE1; however significant improvements have been implemented for both modelling and estimation. The geological modelling has been improved through observations and interpretations made by the Exploration team during the Phase 1 Drill Program, as well as deeper interrogation of historical geological data. The resource estimation has been improved through the implementation of “unfolding” of the lenses during the grade interpolations to more accurately model the grade distribution by using locally variable search orientations and distances.
Geological Context
An improved geological model has been developed based upon a comprehensive review of historical data from the Project and the surrounding Minto-Carmacks district, as well as new data and interpretations arising from the Phase 1 program. This site-specific model assists with cost-effective exploration targeting and delineation drilling, and informs development of the geological model used to support resource estimation. Key elements of this model are described below and summarized in Figure 3 and Figure 4.
Copper-gold-silver mineralization at the Minto deposit occurs predominantly within lenses of foliated granodiorite and migmatite. These lenses are typically sub-horizontal to gently dipping, tabular-shaped or sheet-shaped, and typically extending 100 – 1,000 metres along strike and 4 – 30 metres thick. Within these lenses, deformation textures vary from moderately foliated, to strongly foliated, to assimilation zone, to migmatite. Outside of the lenses the wall rock typically exhibits minimal deformation and near-barren grades. The transition from barren, weakly foliated granodiorite to high-grade intensely deformed migmatite commonly occurs over a width of a few centimetres to less than one metre. Higher-grade mineralization is typically associated with increased intensity of deformation and migmatization. Within the deposit area, multiple mineralized lenses occur within an area approximately 3 x 3 km and extend at depth to at least 650 metres below surface.
Within the mineralized lenses, the primary sulphide minerals are chalcopyrite, bornite, minor chalcocite, and pyrite. Copper sulfide minerals occur with varying texture, including disseminated, folioform, net-textured, and rarely semi-massive. Gold and silver occur as fine mineral inclusions within copper sulphides. Native copper occurs rarely in some areas as part of an assemblage that also includes chalcocite and bornite.
A rough sulphide zonation is apparent within some individual mineralized lenses (~500m scale), including a bornite-rich core, chalcopyrite rich halo, and pyrite-rich periphery. A sulphide zonation is also present at the deposit scale (~3km scale), with the northern part of the deposit characterized by more bornite-dominated mineralization (Minto Main and Minto North); whereas the southern part of the deposit is relatively more pyrite-rich (Ridgetop and southern Copper Keel).
Near-surface deposits, such as Ridgetop, Area 118, and southern Copper Keel include a near-surface horizon of copper oxide mineralization that consists of malachite, azurite, and chrysocolla. Oxidization intensity is variable with sulphide and oxide minerals occurring together in some areas. A sulphuric acid leach assay method is used to determine acid soluble copper and to calculate a ratio of sulphide copper vs oxide copper.
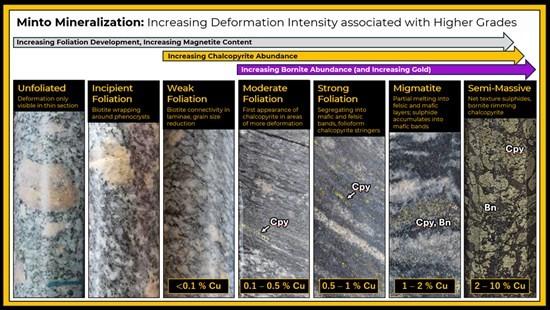
Figure 3: Photographs from drill core illustrating the relationship between deformation, texture, and mineralization.
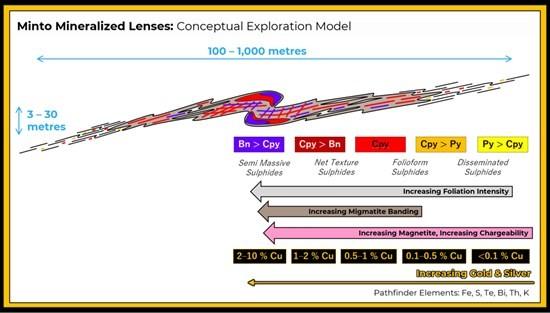
Figure 4: Conceptual model of mineralized lenses that occur throughout the Minto deposit area, depicting key criteria used for geological modelling and exploration targeting.
Resource Estimation Methodology
A total of 69 mineralized domains were modelled as three-dimensional solids using a combination of implicit modelling tools with explicit drillhole interval selection, boundary clipping, and structural orientation controls. The domains are defined using CuEq shells based on assay cut-off criteria of ≥0.3% CuEq over ≥5 m for open pit areas and ≥0.8% CuEq over ≥3 m for underground areas. These domains are interpreted to represent the higher-grade cores of foliated and migmatized mineralized lenses as described above. Lithology and structure were the primary controls used to correlate mineralized intervals and model domain geometries.
The mineralized domains range from approximately 4 m to 30 m in thickness, have average plan dimensions of approximately 400 m by 500 m, are commonly stacked or overlapping, and are generally subparallel. These domains exhibit gentle folding and undulation. The foliation within the lenses is parallel to the modelled lens geometry. Foliation measurements from oriented core were used to guide and validate the interpretation of resource domain geometries. Domain extrapolation was limited to the lesser of: 1) halfway to an adjacent drillhole interval below the applicable cut-off grade; or 2) 50 m from the nearest supporting mineralized intercept(s). These domains were used as the primary model to constrain estimation of copper, gold, silver, and specific gravity.
Oxidation domains were generated by modelling the probability of blocks exceeding a 20% oxide ratio using indicator kriging of oxide ratios calculated from assay data. Two oxidation domains were defined to support appropriate estimation of oxide ratio: a high-oxidation domain and a low-oxidation domain. The high-oxidation domain generally extends approximately 20 m to 30 m below the base of overburden or sediments, but locally extends to greater depths where surficial fluids are interpreted to have migrated along preferential pathways such as faults and paleo-topographic features.
Cumulative probability plots were used to assess grade distributions and define capping values of the assays and outlier restrictions of the composites during the interpolation of copper, gold, and silver. Most domains required minor capping and/or outlier restrictions.
Assay data were composited to 2 m intervals while honouring domain boundaries. A 2 m composite length was selected to minimize splitting of assay intervals, as more than 95% of assays grading greater than 1% Cu have sample lengths of less than 2 m. Residual composites less than 1 m in length were added to the preceding composite to avoid the use of short residual composites.
Copper, gold, and silver grades were estimated using inverse distance squared interpolation on the “unfolded” lenses with domain matching of the blocks and composites. This method was selected based on the stationarity of grades within the mineralized domains and validation of the resulting block estimates. A block percent model has been used with up to two lenses per block. For the open pit resource the weighted average whole block grades have been used, whereas for the underground resource the tonnage and grade within the lenses defines the resource.
Resource classification was based primarily on drillhole spacing and distance-to-sample criteria informed by variography, as summarized in Table 4 below. Post-processing was completed to review isolated blocks and ensure reasonable three-dimensional continuity of classification categories.
Table 4: Classification criteria for the 2026 Mineral Resource Estimate
| Classification | Criteria 1 | Value | Criteria 2 | Value | Criteria 3 |
| Measured | Unfolded Distance to the Nearest 3 DHs | 10 metres | Furthest Unfolded Distance to the Nearest 3 DHs | 15 metres | At least 3 DHs used to inform the Cu grade interpolations |
| Indicated | Unfolded Distance to the Nearest 2 DHs | 55 metres | Furthest Unfolded Distance to the Nearest 2 DHs | 71 metres | |
| Inferred | All other blocks that have been interpolated with at least a Cu grade. | ||||
The block model tonnage and grade estimates were validated through comparison with declustered composite data, swath plots, grade-tonnage curves, and visual review in section and plan.
The resources have been depleted inside a 20 metre buffer from existing underground stopes and 6 m from existing underground developments.
Additional details regarding estimation methodology will be provided in the technical report.
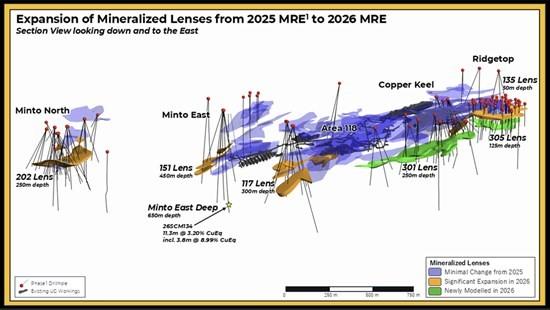
Figure 5: Section view showing expansion of mineralized lenses within the 2026 MRE, compared against the 2025 MRE1.
Metallurgical Assumptions
A substantial body of metallurgical test work has been completed on the Minto property since 2005, including bench-scale flotation testing, grind size sensitivity studies, mineralogical analysis, and gravity recovery evaluations across multiple ore zones and degrees of oxidation. In addition to formal test work programs, an extensive reconciled plant operating dataset generated during commercial operations between 2007 and 2023 provides the primary basis for metallurgical assumptions adopted in the 2026 MRE, which also assume the addition of new gravity recovery equipment to improve precious metals recoveries.
Recent metallurgical test work completed on historical drill core samples qualitatively confirms the sensitivity of flotation performance to copper oxide. Additional metallurgical test work to further validate the flotation performance of planned mining areas is currently in progress and will be incorporated into the upcoming Feasibility Study.
The following equations have been developed for overall recoveries at Minto and were used in NSR calculations for the 2026 MRE. Table 5 provides a summary of Copper and Gold recoveries at various oxide ratios at a fixed 1% copper grade.
Copper Recovery† (%) = 95.5+1.07 *(Cu%) -113*(Oxide Ratio)
Gold Recovery† (%) = 35.63+0.58032*(Cu Recovery %)-1.3341*(Cu%)^0.8932
Silver Recovery† (%) = 69.4+1.9*(Ag%)
†Copper recoveries are capped at 98%; Gold and Silver recoveries are capped at 85%
Table 5: Preliminary Recovery Estimates as a function of Oxide Ratio, using a fixed 1% copper grade in the recovery equations.
| Oxide Ratios* | 0% | 10% | 20% | 30% |
| Copper Recovery† @ 1.0 %Cu | 96.6% | 85.3% | 74.0% | 62.7% |
| Gold Recovery‡ @ 1.0 %Cu | 85.0% | 83.8% | 77.2% | 70.7% |
| *Note: Underground Measured & Indicated average Oxide Ratio is 6%, and Underground Inferred average Oxide Ratio is 5%. Open Pit Measured & Indicated average Oxide Ratio is 11% and Open Pit Inferred average Oxide Ratio is 8% †Note: Average historical Life of Mine copper recovery was 91.7% ‡Note: Average historical Life of Mine gold recovery was 72.6% |
||||
Design Basis Assumptions
The following Design Basis was established for the purpose of the MRE. While it is anticipated to align with the PEA design basis, there may be discrepancies due to changes during finalization of ongoing PEA work.
Table 6: MRE Design Basis key assumptions
| Assumption | Unit | Value |
| Copper Price | $USD/lb | $4.60 |
| Gold Price | $USD/oz | $3,300 |
| Silver Price | $USD/oz | $40 |
| Foreign Exchange | $USD/$CAD | 0.72 |
| Concentrate Grade Cu* | % | 38% |
| Concentrate Moisture | % | 8% |
| Copper Payable | % | 97.50% |
| Gold Payable | % | 98% |
| Unit Au Deduction | g/t | 1 g/t |
| Silver Payable | % | 92% |
| Unit Ag Deduction | g/t | 30 g/t |
| Concentrate Transport Cost | $USD/dmt | $200 |
| Cu Concentrate Treatment Charge | $USD/dmt | $35 |
| Copper Refining Charge | $USD/lb | $0.035 |
| Gold Refining Charge | $USD/oz | $5.00 |
| Silver Refining Charge | $USD/oz | $0.50 |
| NSR Royalty Cu/Au/Ag | % | 1.50% |
| OP Mining OPEX | $CAD/t mined | $4.58 |
| UG Mining OPEX** | $CAD/t mined | $95.64 |
| Processing OPEX | $CAD/t milled | $30.00 |
| G&A OPEX | $CAD/t milled | $20.00 |
| *Concentrate Cu Grade pinned at 38%. Au and Ag concentrate grades calculated by variable mass recovery **Marginal UG mining cost of CAD $50.00 assumed for the purposes of RPEEE shapes and reporting cut-offs |
||
Resource Estimate Visualizations
Included below are representative cross sections depicting the grade and continuity of mineralized lenses for key areas within mineral resource estimation.
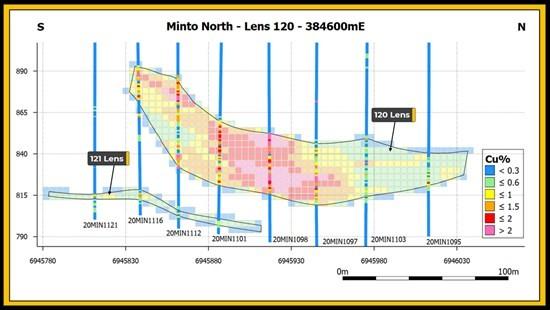
Figure 6: Cross section showing assay and block Cu grades in Lens 120 and 121, Minto North.
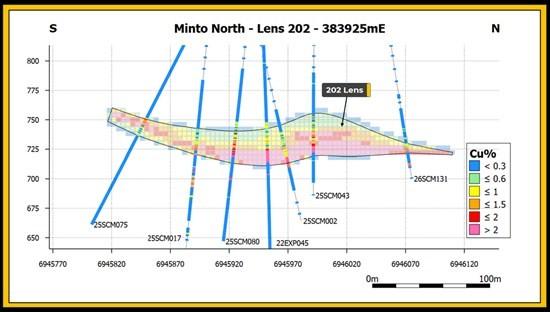
Figure 7: Cross section showing assay and block Cu grades in Lens 202, Minto North.
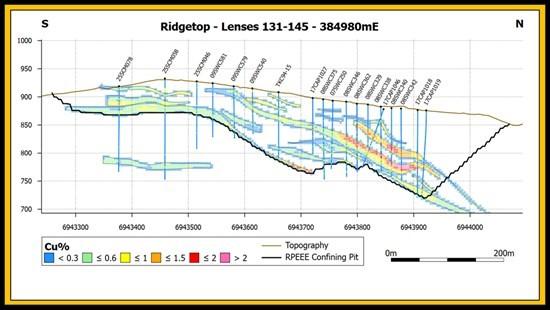
Figure 8: Cross section showing assay and block Cu grades in the Ridgetop open pit, Lenses 131-145.
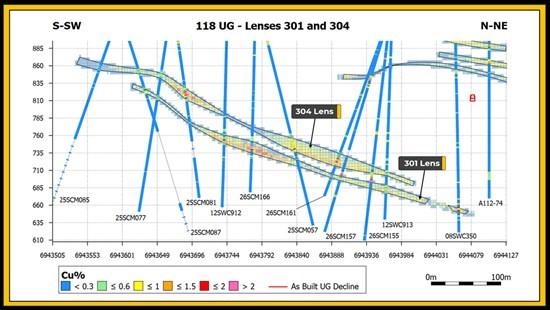
Figure 9: Cross section showing assay and block Cu grades in Lens 301 and 304, Area 118.
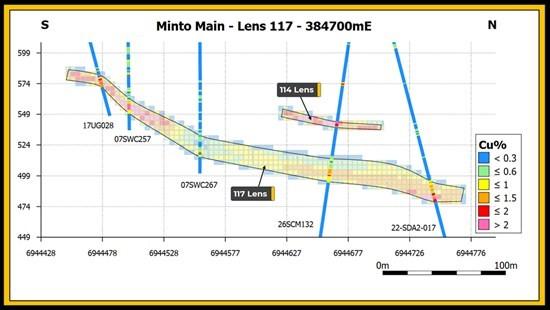
Figure 10: Cross section showing assay and block Cu grades in Lens 117 and 114, Minto Main.
References
1 See Technical Report “NI 43-101 2025 Mineral Resource Estimate Update for the Minto Property, Yukon, Canada” prepared by Moose Mountain Technical Services and submitted to Venerable Ventures Limited; original effective date of 2025-04-07; subsequently amended on 2025-10-08; filed and available on SEDAR+ (sedarplus.ca).
2 See Technical Report “NI 43-101 Preliminary Economic Assessment Technical Report; Minto, Yukon, Canada” prepared by JDS Energy & Mining Incorporated and submitted to Minto Explorations Limited; effective date March 31, 2021; filed and available on SEDAR+ (sedarplus.ca).
Technical aspects of this news release have been reviewed, verified and approved by Leif Bailey, P.Geo., Director of Geoscience & Exploration of Selkirk Copper Mines Inc., who is a Qualified Person as defined by National Instrument 43-101 – Standards of Disclosure for Mineral Projects.
Sue Bird, P. Eng, V.P. of MMTS, and a Qualified Person as defined by National Instrument 43-101 – Standards of Disclosure for Mineral Projects, has reviewed and approved the scientific and technical disclosure contained in this news release relating to the Resource Estimate. Ms. Bird has verified the data incorporated in the Resource Estimate by certificate checks, standards, blank and duplicate plots. Ms. Bird experienced no limitations with respect to data verification activities related to the Minto Project.
About Selkirk First Nation
Selkirk First Nation is centered in Pelly Crossing, a community in central Yukon, 280 km north of Whitehorse. They are a self-governing First Nation, having signed its Final and Self-Government Agreements in 1997. Selkirk First Nation owns 4,740 square kilometres of Settlement Land, including 2,408 square kilometres where they own both the surface and subsurface. Selkirk First Nation is one of three self-governing Northern Tutchone First Nations in the Yukon. The Selkirk First Nation, indirectly, holds a controlling equity stake in Selkirk Copper.
About Selkirk Copper
Selkirk Copper is a well-financed, newly formed company with a controlling interest held by the Selkirk First Nation through its wholly owned subsidiary, that, in partnership with the Selkirk First Nation, is completing a thorough exploration drilling campaign and a restart and redevelopment plan for the former Minto copper-gold-silver mine based on best-in-class environmentally sustainable mining, development and reclamation practice. Selkirk Copper controls 26,850 hectares of prospective mineral claims located in the Minto-Carmacks copper belt as well as significant open-pit and underground infrastructure, a 4,100 tonne per day processing plant, 400-person full-rotation camp, water treatment facilities, numerous ancillary buildings, and mobile equipment centered on the former Minto copper-gold-silver mine. Selkirk Copper’s mineral tenure, operation infrastructure, access roads and powerline, is located on or adjacent to Lands of the Selkirk First Nation much of which is surrounded by prospective Selkirk First Nation Category A Lands.
Brutus Mining Inc. (CSE: BRU) (FSE: ZI3) is pleased to announce that it has closed its non-brokered ... READ MORE
Jaguar Uranium Corp. (NYSE American: JAGU) is pleased to announce an independent Mineral Resource E... READ MORE
Auro Metals Inc. (TSX-V: AURO) (OTCQB: AURFF), is pleased to announce the assay results of the fina... READ MORE
Endeavour Silver Corp. (NYSE: EXK) (TSX: EDR) is pleased to announce that repairs to the primary bal... READ MORE
Scorpio Gold Corp. (NASDAQ: SGLD) (TSX-V: SGLD) (OTCQB: SRCRF) (FSE: RY9) is pleased to announce re... READ MORE


