








Highlights
Scorpio Gold Corp. (NASDAQ: SGLD) (TSX-V: SGLD) (OTCQB: SRCRF) (FSE: RY9) is pleased to announce results from four drill-holes of the Phase Two drill program at the Manhattan District Project, Nevada, USA: 26MN-113, 26MN-115, 26MN-116, and 26MN-118, see Figure 1. The results are tabulated in Table 1 and discussed below. Scorpio Gold has drilled 114 drill holes to date from its Phase Two diamond drilling program, 25MN-011 through 25MN-045, 26MN-046 through 26MN-123, for a grand total of 32,585 m. With the results herein, Scorpio Gold has reported assays on 107 of these (25MN-011 through 25MN-045, 26MN-046 through 26MN-116, and 26MN-118, totalling 30,889 m, and assays are pending from 7 holes (26MN-117 and 26MN-119 through 26MN-123), totalling 1,696 m. The pending results will be reported as they become available.
“Manhattan keeps delivering on the two things that matter most in this market: scale and grade. Hole 26MN-115 — 19 gram per tonne gold over 5 metres contained within 3 grams across 48 metres — confirms that high grade feeder zones sit within an expanding bulk tonnage envelope. Just as importantly, every hole at Goldwedge is sharpening our structural understanding of the system: we can now trace mineralization along the Reliance Fault, from the Zanzibar sediments in its hanging wall through to the Caldera volcanics at the contact, and that model is directly guiding where we drill next. Grades like these put a potential underground startup on the table as a nearer-term path to production, while the broader district — eight and a half kilometres of strike anchored by existing historic resources — needs modern, systematic drilling to expand toward its true district scale potential. Few juniors can offer that combination of near-term optionality and district-scale upside, and we intend to keep advancing both,” said Zayn Kalyan, CEO and Director of Scorpio Gold.
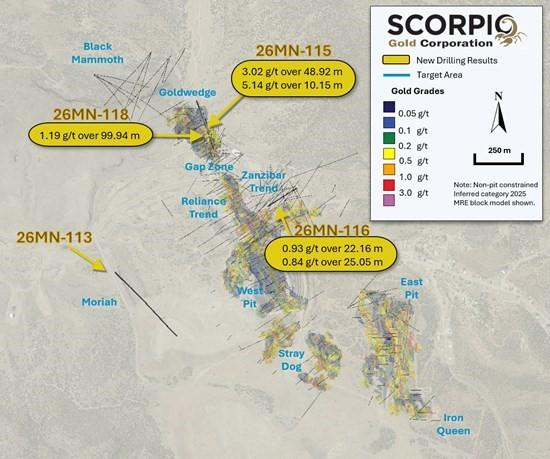
Figure 1. Surface Plan Map of drill holes.
Goldwedge: Drill holes 26MN-115 and 26MN-118 are both approximately 50 m step-outs along the projected Reliance Fault from high grade gold intercepted in drill hole 26MN-091, within the Manhattan Caldera Volcanics. Recent drilling at Goldwedge, including the results herein, has demonstrated consistently strong mineralization, especially in the Paleozoic sediments of the Ordovician Zanzibar Formation, located in the hanging wall of the Reliance Fault. The Reliance Fault is considered one of many feeders to mineralization. Additionally, recent results have proven that the Manhattan Caldera Volcanics can likewise host lower grade envelopes around high grade feeder structures, as demonstrated by the following previously reported intercepts:
The Gap Zone: The Gap Zone is the previously undrilled area that connects Goldwedge to the Reliance Trend and ultimately, the historic West Pit. Mineralization is hosted entirely within the meta-sediments of the Gold Hill Formation and is dominantly controlled by veins and structures related to the steeply dipping Reliance Fault. First tested in early 2025, significant mineralization at the Gap Zone includes:
Zanzibar Trend: The Zanzibar Trend is the previously underexplored area between Mustang Hill and Goldwedge along the faulted contact of the Paleozoic meta-sediments and the Oligocene aged volcanics of the Manhattan Caldera. High grade gold mineralization is encountered along two main controlling features: sub-vertical structures parallel to the main contact fault, and along gently to moderately dipping bedding planes primarily in the Cambrian Gold Hill Formation. Drill hole 26MN-116 steps out approximately 50 m to multiple drill holes along the trend, including 26MN-067, 25MN-045, and 26MN-087. The results reported herein add to the significant mineralization encountered along the Zanzibar Trend, including:
Black Mammoth: Black Mammoth is a ~200+ m step-out from Goldwedge. Strong gold mineralization can be found within the Ordovician Zanzibar sediments along structures related to the Black Mammoth Fault, and on both sides of the major fault defining the contact between the Paleozoic sediments and the Oligocene aged volcanics of the Manhattan Caldera. Results at Black Mammoth will be reported as they become available. Significant mineralization includes:
All 2026 drill holes tested within and beyond the Inferred Resource Constraining Pit targeting new mineralization outside of the 2025 MRE block model, see Figure 2. For further details see “Mineral Resource Estimate and NI 43-101 Technical Report, Manhattan Property, Nye County, Nevada” with an effective date of June 4, 2025, on Scorpio Gold’s website at Technical Report.
| Drill Hole ID | Target Azimuth / Dip |
From (m) | To (m) | Intercept¹ (m) | Gold (g/t) |
| 26MN-115 | Goldwedge | 118.87 | 167.79 | 48.92 | 3.02 |
| 388 m | 342° / -45° | ||||
| including | 151.79 | 157.03 | 5.24 | 19.29 | |
| 173.58 | 183.73 | 10.15 | 5.14 | ||
| 210.92 | 227.62 | 16.70 | 0.46 | ||
| 26MN-116 | Zanzibar Trend | 95.71 | 117.87 | 22.16 | 0.93 |
| 285 m | 056° / -50° | ||||
| including | 98.66 | 102.41 | 3.75 | 3.72 | |
| 166.33 | 170.38 | 4.05 | 0.87 | ||
| 205.07 | 230.12 | 25.05 | 0.84 | ||
| including | 213.33 | 216.80 | 3.47 | 3.63 | |
| 26MN-118 | Goldwedge | 59.28 | 68.88 | 9.60 | 0.58 |
| 344 m | 344° / -62° | 98.61 | 198.55 | 99.94 | 1.19 |
| including | 126.95 | 139.75 | 12.80 | 1.86 | |
| and | 147.82 | 152.00 | 4.18 | 5.13 | |
| 227.38 | 235.52 | 8.14 | 0.25 | ||
| 26MN-113 | Moriah | 51.79 | 53.95 | 2.16 | 0.35 |
| 716 m | 135° / -45° | ||||
| ¹ Intervals contain no more than 3 continuous metres grading less than 0.1 g/t gold. | |||||
Table 1. Results from the current batch of drill holes. Note: There is insufficient geological information to estimate a true width for the drill intercepts reported.
Goldwedge Results:
26MN-115: This drill hole contains three significant intercepts hosted in both the Ordovician Zanzibar Formation and the Oligocene Volcanics of the Manhattan Caldera (See cross-section A-A’ in Figure 2 and cross-section B-B’ in Figure 3). The gold mineralization is focused into a structurally complex zone of faulted and brecciated limestones and limey mudstones of the Ordovician Zanzibar Formation on the hanging wall of the main contact fault separating the Paleozoic sediment package from the Manhattan Caldera Volcanics (See cross-section B-B’ in Figure 3). The first and longest interval averages 3.02 g/t gold over 48.92 m from 118.87 m and is typical of the Goldwedge area in that it is generally composed of brecciated Zanzibar limestone and mudstone, with multiple small gouge zones as well as sulfide and quartz healed breccias that can be well mineralized with gold (See annotated core photos in Figure 5). The Goldwedge target zone is interpreted as a flower structure associated with the dextral strike/slip fault zone that juxtaposes the Paleozoic sediments of the Zanzibar and Gold Hill Formations against the much younger volcanic rocks of the Manhattan Caldera. This allows for many fluid pathways to the surface, resulting in high grade intercepts along the individual fault planes, enveloped by moderate grades in the surrounding breccia (See cross-section B-B’ in Figure 3). The second interval averages 5.14 g/t gold over 10.15 m from 173.58 m and represents the main fault structure. Lenses of multiple rock types are entrained within the fault damage zone, including limestones and mudstones of the Zanzibar Formation, as well as ash tuff and lapilli tuff from the Manhattan Caldera volcanics. The third intercept lies entirely within the Manhattan Caldera Volcanics and averages 0.46 g/t gold over 16.70 m from 210.92 m downhole. This interval is structurally continuous with the neighboring drillhole 26MN-091 which contained 6.95 g/t gold over 11.98 m (see press release dated June 9, 2026) and represents a secondary structure running parallel to the main fault zone.
26MN-118: Drillhole 26MN-118 contains three notable gold intercepts hosted in both the Paleozoic meta-sediments of the Zanzibar and Gold Hill Formations, as well as the Volcanics of the Manhattan Caldera. The geology of this drillhole is very similar to the neighboring drillhole 26MN-115 discussed above, encountering the complex upward flaring structures that cut through the Goldwedge zone proximal to the main fault separating the sedimentary rocks southwest of the fault from the volcanic rocks to the northeast (Figure 3 and Figure 4). The first significant gold mineralization encountered in this drillhole averages 0.58 g/t gold over 9.60 m from 59.28 m with the highest grades in this interval being found in gouge zones in otherwise brecciated limestones and mudstones of the Ordovician Zanzibar Formation. The second interval is the most continuous and averages 1.19 g/t gold over 99.94 m from 98.61 m within brecciated limestones and mudstones of the Zanzibar formation, as well as altered siliciclastic sediments of the Cambrian Gold Hill Formation. Near the bottom of the interval there are clasts of Oligocene aged volcanics that have been entrained in the larger structural zone from the footwall country rock of the Manhattan Caldera. Throughout the interval, discrete structural zones are defined by stronger alteration and gouge, as well as elevated gold grades. In some cases, the breccias have been fully healed by a quartz/sulfide matrix and can contain high grade gold values (Figure 6). The final notable intercept occurs fully within the volcanic rocks of the Manhattan Caldera, along a subsidiary structure that is sub-parallel to the main contact fault. It averages 0.25 g/t gold over 8.14 m from 227.38 m downhole and appears to be continuous with both drillhole 26MN-115 and other neighboring drillholes at approximately 50m step outs from each other.
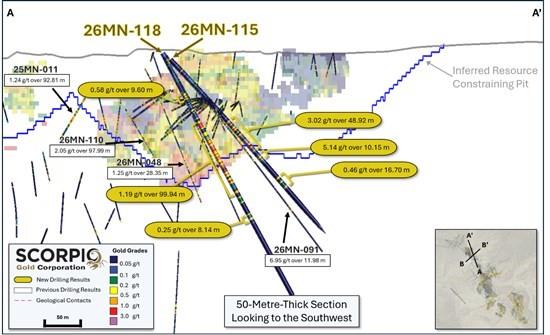
Figure 2. Cross-section A-A’, showing gold grades with reported intervals highlighted.
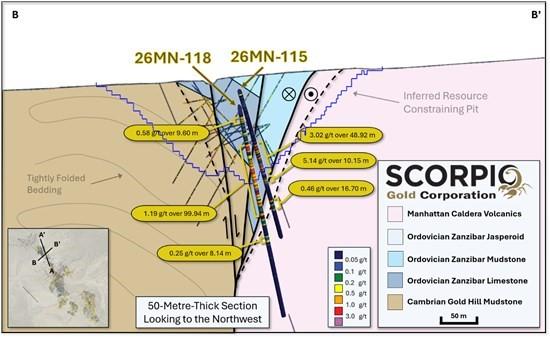
Figure 3. Cross-section B-B’, showing gold grades with reported intervals highlighted and schematic of flower structure interpretation.
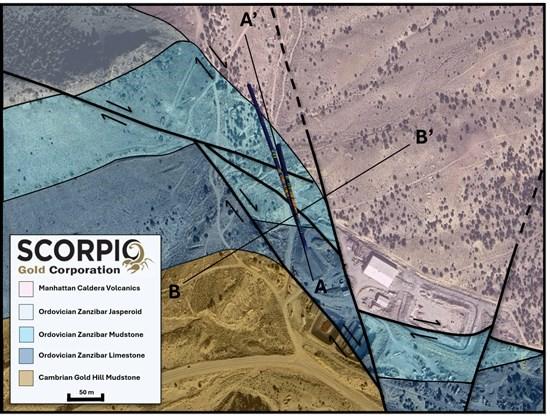
Figure 4. Plan view of Goldwedge target area and interpreted geology.
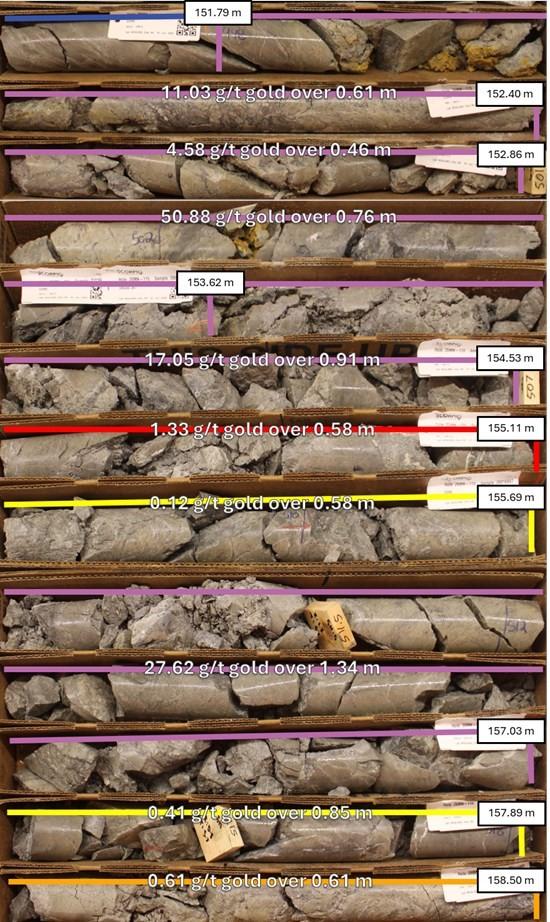
Figure 5. Drill hole 26MN-115, interval 151.79 m to 158.50 m, displaying brecciated and altered meta-mudstones locally healed by quartz/adularia and fine-grained sulfide matrix.
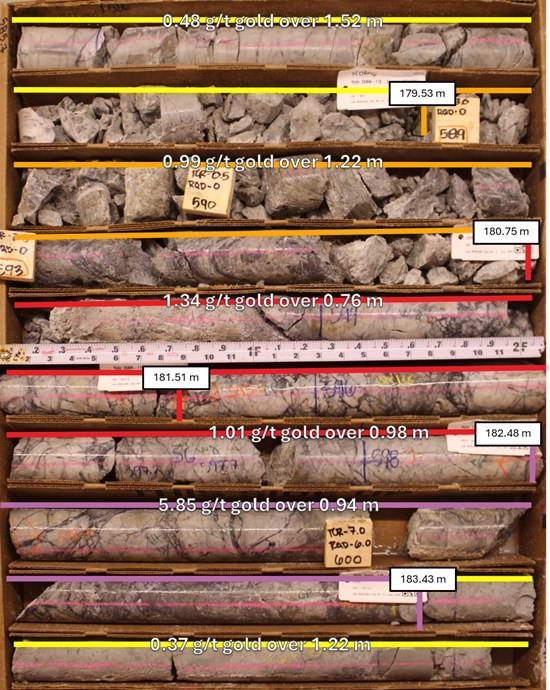
Figure 6. Drill hole 26MN-118, interval 178.00 m to 184.65 m, displaying brecciated and altered meta-mudstones and marbles locally healed by quartz/adularia and fine-grained sulfide matrix.
Zanzibar Trend Results:
26MN-116: This drill hole contains three significant gold intercepts, all hosted within the Cambrian Gold Hill Formation. The first interval contained an average grade of 0.93 g/t gold over 22.16 m m from 95.71 m downhole. It is a hosted within alternating beds of meta-mudstones and dolomitic marbles crosscut by small scale structures that typically have moderate clay alteration along them. Proximal to the clay altered zones the host rocks are strongly silicified, containing dissolution vugs as well as drusy epithermal quartz veins. The second notable interval in this drillhole contained an average grade of 0.87 g/t gold over 4.05 m from 166.33 m downhole, and is geologically similar to the first intercept. The third significant intercept in drillhole 26MN-116 contained an average of 0.84 g/t gold over 25.05 m from 205.07 m and is notable for containing the same characteristics as the first two intercepts, with the addition of some quartz/sulfide healed breccia zones correlating to the higher grades in this drillhole. Results from this drillhole confirm that there are multiple controls on the gold mineralization at the Zanzibar Trend, specifically sub-vertical structures that are related to and generally parallel with the main fault separating the Paleozoic sediments and the Oligocene-aged Volcanics of the Manhattan Caldera, and the gently to moderately north-dipping bedding within the Zanzibar and Gold Hill Formations. Where these two controls intersect, strong gold mineralization can be found.
Moriah Results:
26MN-113: This was the first known drillhole at the Moriah Target, which is notable for the extensive historic workings in the area including large adits and deep shafts. Field mapping had identified the same prospective Zanzibar Limestones that are preferred gold hosts at Goldwedge and the Zanzibar Trend, as well as extensional faults and veining associated with the epithermal system seen elsewhere on the property. The drillhole did intersect prospective units and structure near the top of the hole, and moderate silicification and veining near the bottom, however significant gold mineralization was not encountered. Further work will be undertaken to interpret the geological information gathered from this drillhole to refine the targeting strategy at the Moriah target.
QA/QC
HQ sized diamond drill core samples were cut in halves, then bagged and secured with security tags to ensure integrity during transportation to the Elko, NV, MSALABS facility for preparation. For quality assurance, unmarked coarse blanks, unmarked certified reference materials, and requested laboratory duplicates were inserted into the sampling sequence. QA samples were systematically inserted into each batch of samples, amounting to approximately 10% of the run of samples. Samples were analyzed for gold using a two-cycle PhotonAssayTM analysis method (~500 g) of crushed material (70% passing 2 mm). All MSALABS facilities comply with ISO 17025:2017.
About the Manhattan District
Manhattan, located in the Walker Lane Trend of Nevada, USA, is road accessible and lies approximately 20 kilometers south of the operating Round Mountain Gold Mine (https://www.kinross.com/operations/default.aspx#americas-roundmountain), which has produced more than 15 million ounces of gold. For the first time, the Company has consolidated Manhattan’s past-producing mines under a single entity that holds valuable permitting and water rights. Historically, Manhattan has produced approximately 700,000 ounces of gold from high-grade placer and lode operations dating from the late 1890s through to the mid-2000s.¹ The maiden mineral resource estimate (the “Maiden MRE“) covering the Goldwedge and Manhattan Pit areas of Manhattan is comprised of 18,343,000 tonnes grading 1.26 g/t gold for a total of 740,000 oz contained gold in the inferred category.²
A historical mineral resource estimate covers the Black Mammoth, April Fool, Hooligan, Keystone, and Jumbo areas of Manhattan and comprises 1,652,325 tonnes grading 5.89 g/t gold for a total of 303,949 oz contained gold.³ The deposit is interpreted as a low-sulfidation, epithermal, gold-rich system situated adjacent to the Tertiary-aged Manhattan caldera in the Southern Toquima Range of Nevada. A “Qualified Person” as defined in National Instrument 43-101 – Standards of Disclosure for Mineral Projects has not done sufficient work to make the Historical MRE current, and the Company is not treating the Historical MRE as current.
Notes
Qualified Person
The scientific and technical information in this news release has been reviewed, verified and approved by Leo Hathaway, P. Geo., Executive Technical Director of Scorpio Gold, a “Qualified Person”, as defined under National Instrument 43-101 Standards of Disclosure for Mineral Projects. Verification included review of laboratory certificates, review of field logs and chain-of-custody records, inspection of blank/standard/duplicate performance, and review of collar and down-hole survey data. No limitations or failures to verify were identified.
About Scorpio Gold Corp.
Scorpio Gold holds a 100% interest in the Manhattan District located in the Walker Lane Trend of Nevada, USA. Scorpio Gold’s Manhattan District is ~4,780-hectares and comprises the advanced exploration-stage Goldwedge Mine, and four past-producing pits that were acquired from Kinross in 2021 (see news release dated March 25, 2021 https://scorpiogold.com/news/scorpio-gold-closes-purchase-of-kinross-manhattan-property-nye-county-nevada/). The consolidated Manhattan District presents an exciting late-stage exploration opportunity, with over 140,000 metres of historical drilling, significant resource potential, and valuable permitting and water rights.
Brutus Mining Inc. (CSE: BRU) (FSE: ZI3) is pleased to announce that it has closed its non-brokered ... READ MORE
Jaguar Uranium Corp. (NYSE American: JAGU) is pleased to announce an independent Mineral Resource E... READ MORE
Auro Metals Inc. (TSX-V: AURO) (OTCQB: AURFF), is pleased to announce the assay results of the fina... READ MORE
Endeavour Silver Corp. (NYSE: EXK) (TSX: EDR) is pleased to announce that repairs to the primary bal... READ MORE
Scorpio Gold Corp. (NASDAQ: SGLD) (TSX-V: SGLD) (OTCQB: SRCRF) (FSE: RY9) is pleased to announce re... READ MORE


