
Rick Mills – “Uninverted Yield Curve Signaling Recession”
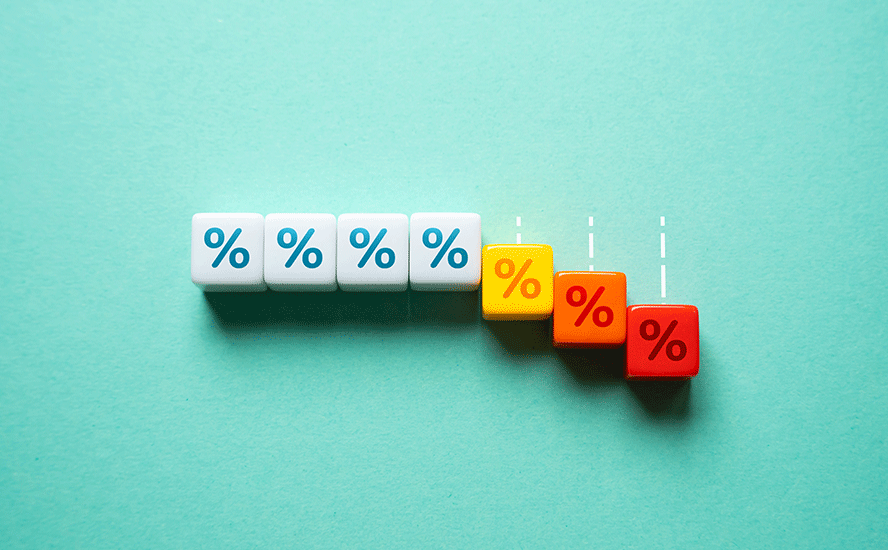
In a typical healthy market, the yield curve (typically the spread between the US 10-year Treasury note and the 3-month or the 2-year note) shows lower returns on short-term investments and higher yields on long-term investments. This makes sense, as investors earn more interest for tying up their money for longer. The yield curve is said to “invert” when short-term yields are higher than long-term yields.
The yield curve has inverted 28 times since 1900, and in 22 of those times, a recession followed. For the last six recessions, a recession began six to 36 months after the curve inverted. Typically a recession follows six to 12 months after the yield curve inverts.
In fact we can get even more specific with the timeline of when a recession follows a yield curve inversion.
Yield curve uninversion
After a little over two years of inverting, the yield curve in early August “uninverted”, i.e., it snapped back to normal. Interest rates on long-term bonds were higher than the rates on shorter-term bonds like 3-month and 2-year Treasuries.
After US job openings fell to the lowest since the start of 2021, the yield on the 2-year Treasury note on Sept. 4 fell briefly below the 10-year note. It’s only the second time this has happened since 2022.
Prima facie, this seems like a good thing. Investors now have more confidence that the economic future is brighter and that locking in their money at higher rates is safe.
However, according to Motley Fool contributor James Brumley:
Except the uninversion of the long-inverted yield curve isn’t quite what it seems to be on the surface. The inversion has been undone mostly because the market’s now betting on more aggressive rate cuts than previously expected, suddenly dragging long-term interest rates much lower than shorter-term rates have fallen. And regardless of how it happens, the reversal of such an inversion doesn’t necessarily mean we’ve sidestepped trouble. The recessions often predicted by a yield curve’s inversion typically don’t start until after the inversion is unwound.
In other words, now’s a good time to start thinking about playing a little defense.
Brumley advises dumping any questionable holdings, and sticking with more resilient stocks, riding out the turmoil.
To prove that timing a coming recession doesn’t really start ticking until the uninversion begins, we only have to look at history.
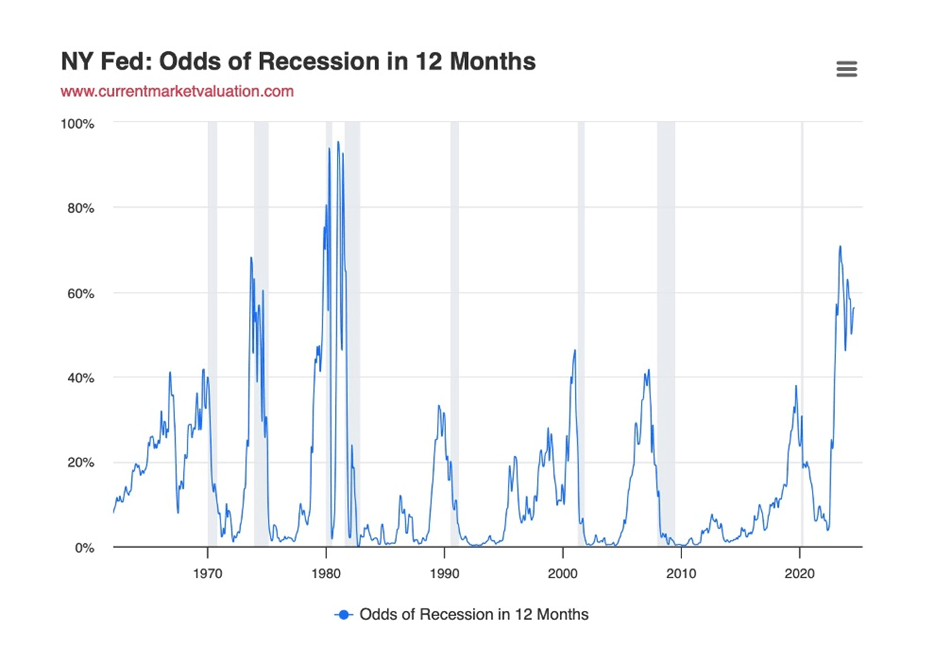
In the chart below, US recessions are highlighted in gray. Economic weakness takes hold a few months after interest rates start trending lower.

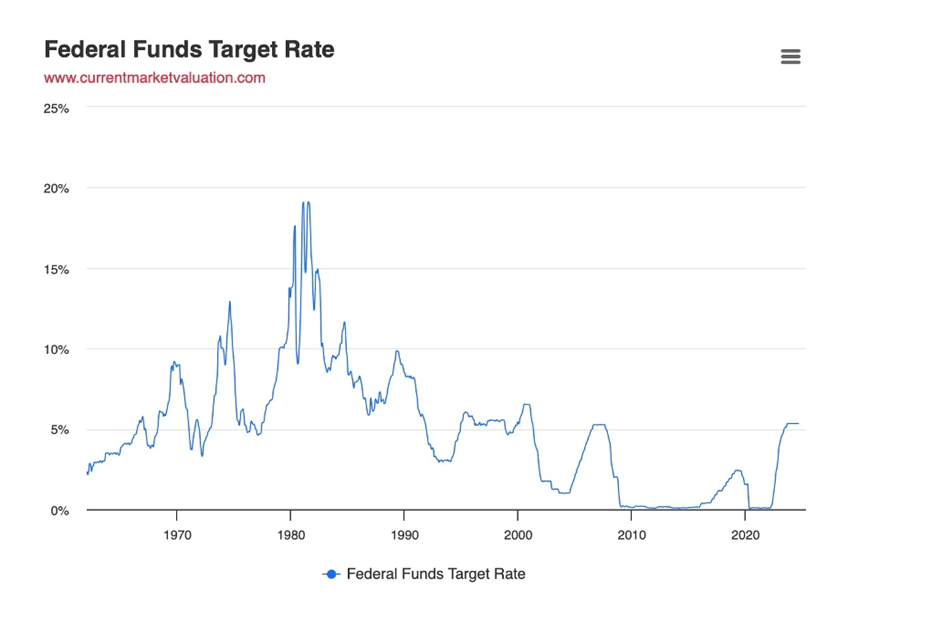
Notice interest rates turning upward since since 2022; that’s the monetary tightening cycle pursued to quell inflation. When rates fall again, as they are expected to, at least a quarter point this month, will a recession follow as it has done historically?
The New York Fed currently assigns a 56% probability that the US will be in recession in July 2025.
Of course we can’t know for sure. Brumley thinks this time might be different. The current inversion lasted a long time, had a deep trough, and was caused by a once-in-a-lifetime event, the covid-19 pandemic.
Below is the foundation of the yield curve, the federal funds rate. This is the interest rate that banks use to lend/borrow from each other overnight.
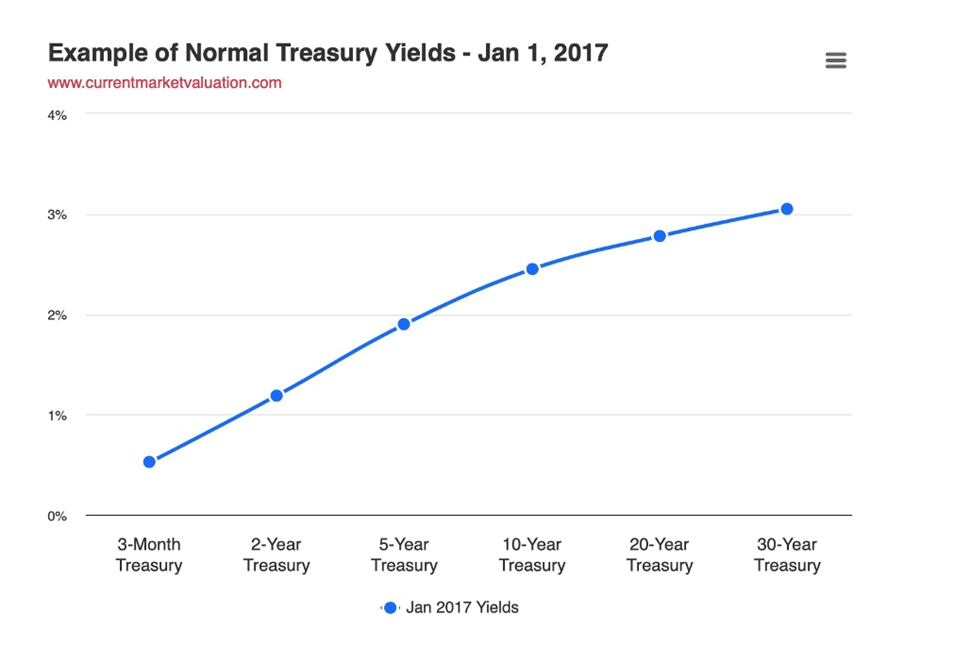
It is almost always the case that as the maturity period increases, the interest rate on Treasury bonds increases as well. This is called a normal yield curve, and is illustrated in the rates below, from January 2017.
The current yield curve is shown below, along with the prior two month-ending curves, courtesy of Current Market Valuation.
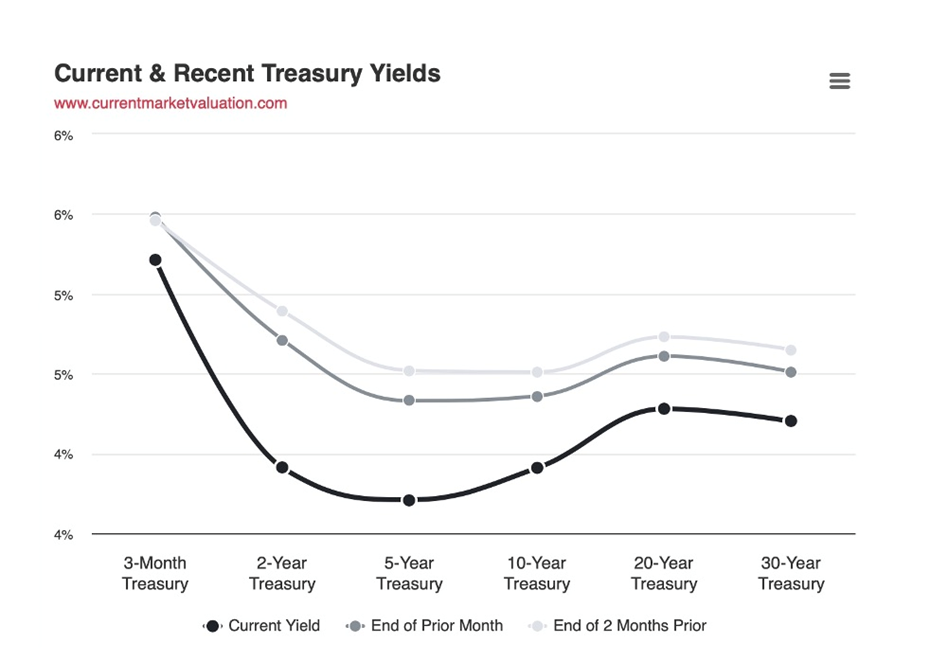
Whether or not the yield curve is normal, flat or inverted is normally determined by examining the relationship between the 3-month and 10-year rates.
As before, prior economic recessions are highlighted as gray vertical bands. Notice that every single recession is preceded by a yield curve inversion.
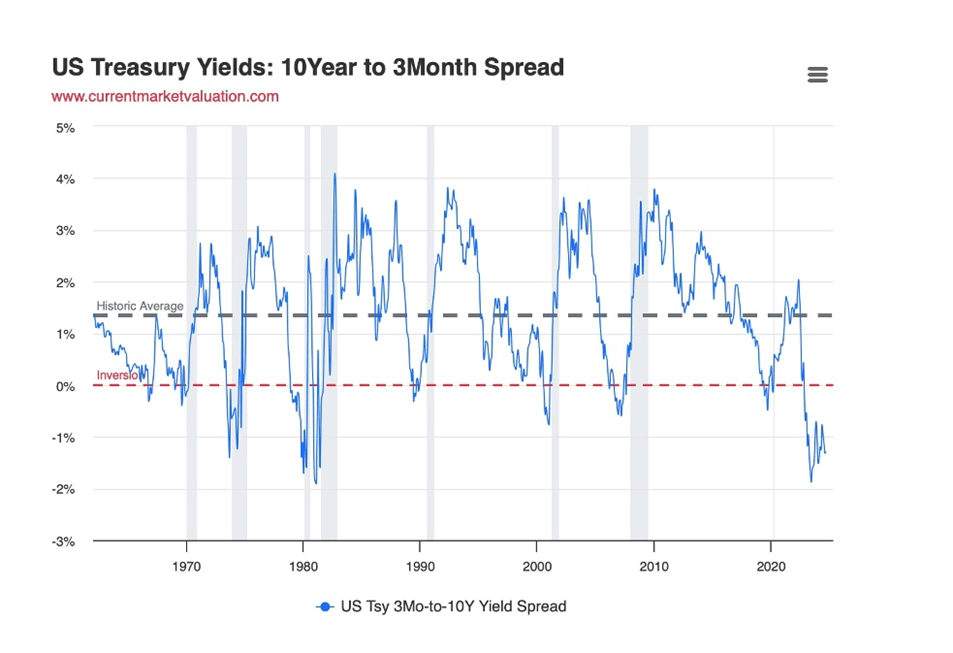
Again, is a recession this time guaranteed to follow? Critics says the yield curve model doesn’t show the full picture. Rather than signaling a recession, the yield curve inversion could be a byproduct of non-traditional monetary measures, i.e., the quantitative easing that started in 2008.
According to Current Market Valuation, Programs like quantitative easing, which involve large-scale purchases of long-term securities, have driven down long-term interest rates and can potentially cause yield curve inversions, or materially change the yield curve from historic trends.
Also, a yield curve inversion doesn’t tell us how long or how severe the recession might be.
Thirdly, strong international demand for US Treasuries during times of economic or political turmoil can drive down long-term yields, potentially leading to a yield curve inversion.
Hard vs soft landing
This isn’t Ahead of the Herd’s first rodeo when it comes to analyzing yield curves. The last time, back in December 2023, our article ‘Hard Landings Recession Predictions Wrong’ took aim at those who believe the Fed’s steeply rising interest rate hikes would cause a recession.
I was right in my prediction that the Fed would pause in June 2023.
I’ve also voiced my opinion that we will get a soft landing with no, or an extremely shallow and very short recession. Remarkably, the Federal Reserve has raised interest rates fast enough to reverse the inflation rate, without causing a severe downturn. And it’s done it in an extremely short amount of time.
I’m sticking with my prediction of a quarter-point cut in September and possibly another 25 basis-points reduction before the end of the year, with the rate easing cycle continuing well into the new year. I do not see a recession until late in in 2025.
While some economists are forecasting a 50-point cut in September, I think that would panic the market and is something the Fed would want to avoid.
Sahm rule
In fact the rosy employment picture has been, until recently, an important reason for the US avoiding recession, despite several indicators pointing towards one. These included the Leading Economic Index (LEI), the inverted yield curve, and the ISM Manufacturing Index (ISM), also known as the Purchasing Managers Index (PMI).
Claudia Sahm is a former Federal Reserve economist and the creator of the Sahm rule, a fourth recession indicator.
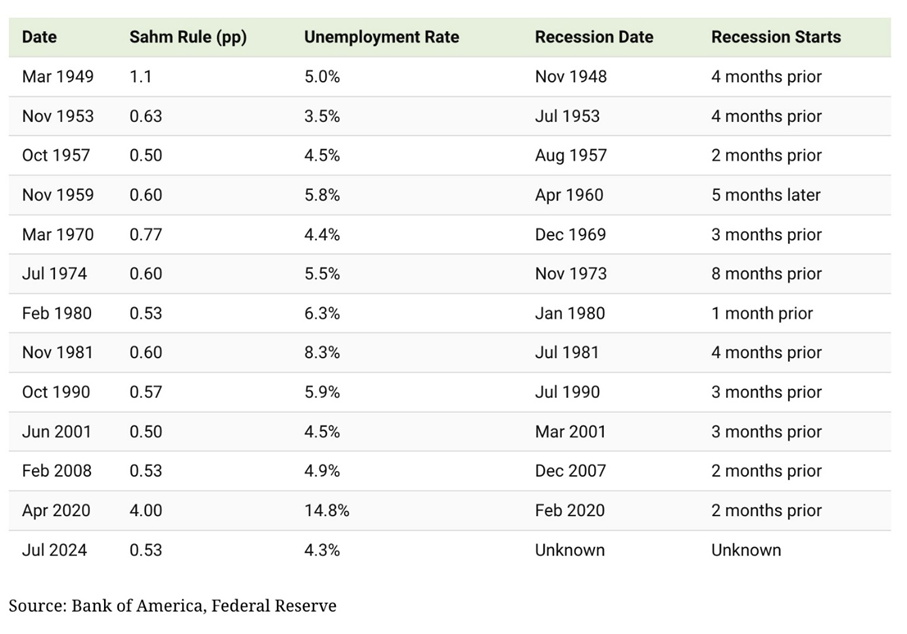
The Sahm rule is fairly simple. It says if the three-month average of the unemployment rate is half a percentage point or more above its low in the prior 12 months, the economy is in a recession. The Sahm rule flashed red in July amid a weaker jobs report. The current value is 0.53, meaning we are technically in recession.
However, as Visual Capitalist writes,
In 2024, the rise in unemployment is due to an expanding labor pool, driven in part by workers migrating to America who haven’t found a job yet. Notably, an influx of unemployed entrants into the labor pool is driving half of this increase in the percentage points, triggering the Sahm Rule. By contrast, previous recessions saw rising unemployment being fueled by layoffs.
 Source: Visual Capitalist
Inflation fading
Let’s take a closer look at inflation, since it is so important in guiding the Fed’s interest rate decisions.
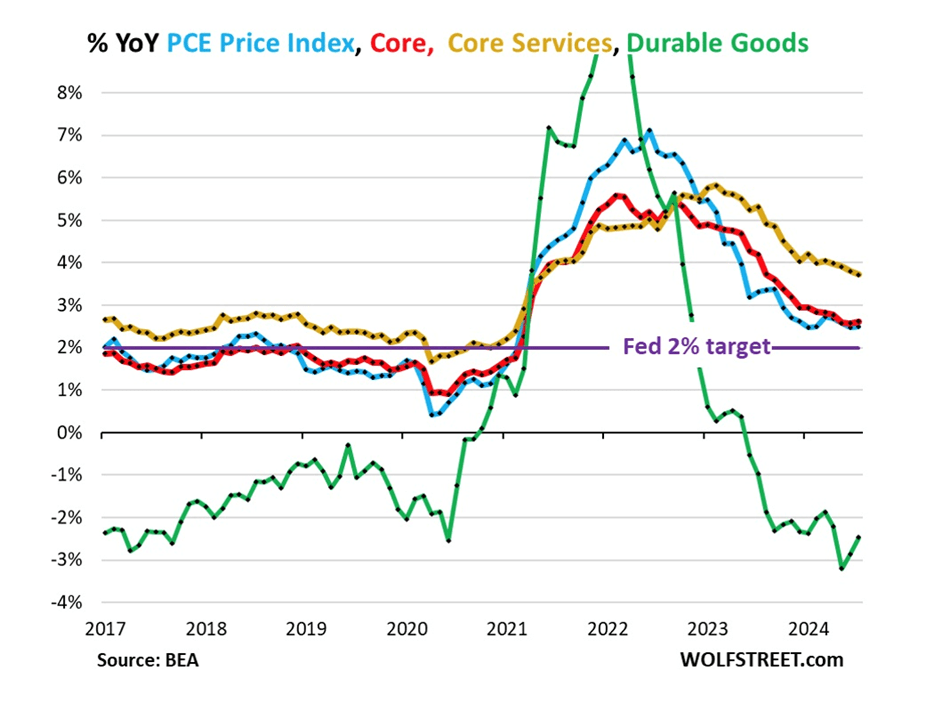
According to Bloomberg, as of Aug. 30, the Fed’s favored inflation gauge, the core PCE, advanced just 2% in July, in line with expectations and reinforcing the Fed’s plan to start cutting rates in September.
Core PCE increased by only 0.2% from June, and on a three-month annualized basis, rose by 1.7%, the slowest this year.
Fed Chairman Jerome Powell recently said “the time has come” for central banks to start lowering borrowing costs. Britain and Canada have already done so, with the Bank of Canada slashing interest rates by 0.25% for a third consecutive meeting. The BOC said it’s “reasonable” to expect more easing to come if inflation keeps decelerating, according to Bloomberg.
In Europe, consumer prices rose 2.2% in August from a year ago — the tamest since mid-2021 and significantly lower than the 2.6% pace a month earlier. (Bloomberg, Aug. 31, 2024)
There are also emerging cracks in the US labor market. On Aug. 29, it was reported that risks to the US job market are prompting the central bank’s turn toward interest-rate reductions:
August indexes in each of the five recently released regional manufacturing reports show shrinking payrolls at factories, and gauges of employment at service providers are settling back. Measures of hours worked are also slipping.
The Fed has a dual mandate of keeping inflation in check (within 2%) while also keeping unemployment low. The condition of the labor market helps inform expectations of consumer spending — the main engine (70%) of the economy.
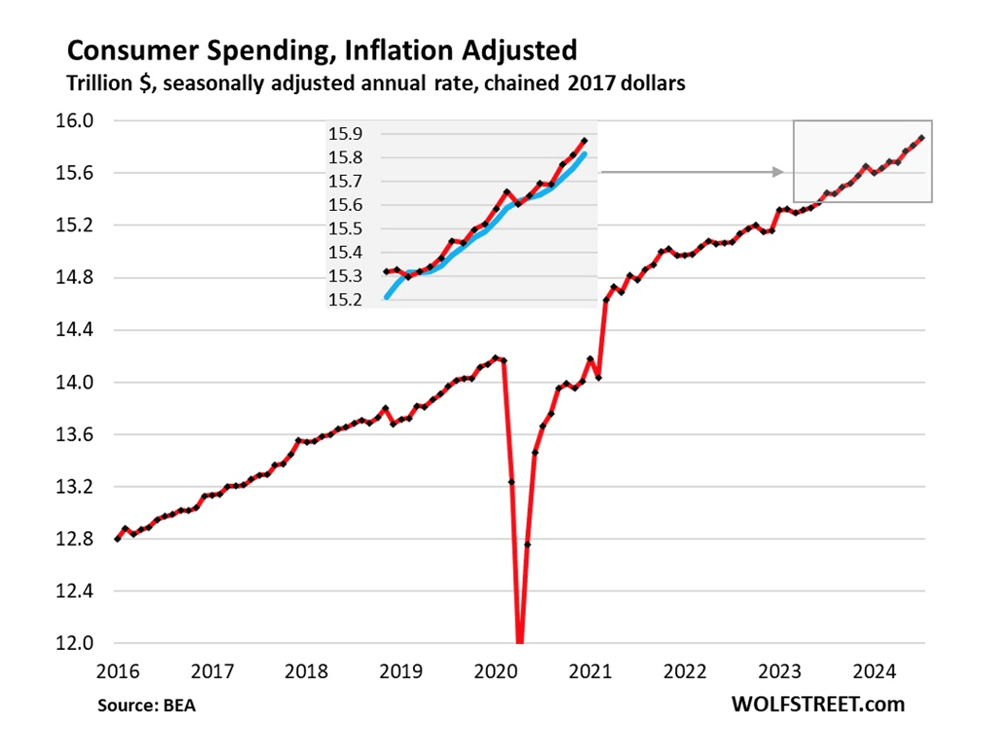
Inflation-adjusted consumer spending reportedly climbed 0.4%, an acceleration from July.
However, Bloomberg Economics says “July’s spending, income and inflation data were consistent with or modestly better than expectations, and may revive talk of a ‘Goldilocks’ economy. But we think details of the report show activity is cooling, with a more notable slowdown in income and spending likely in the second half of the year.”
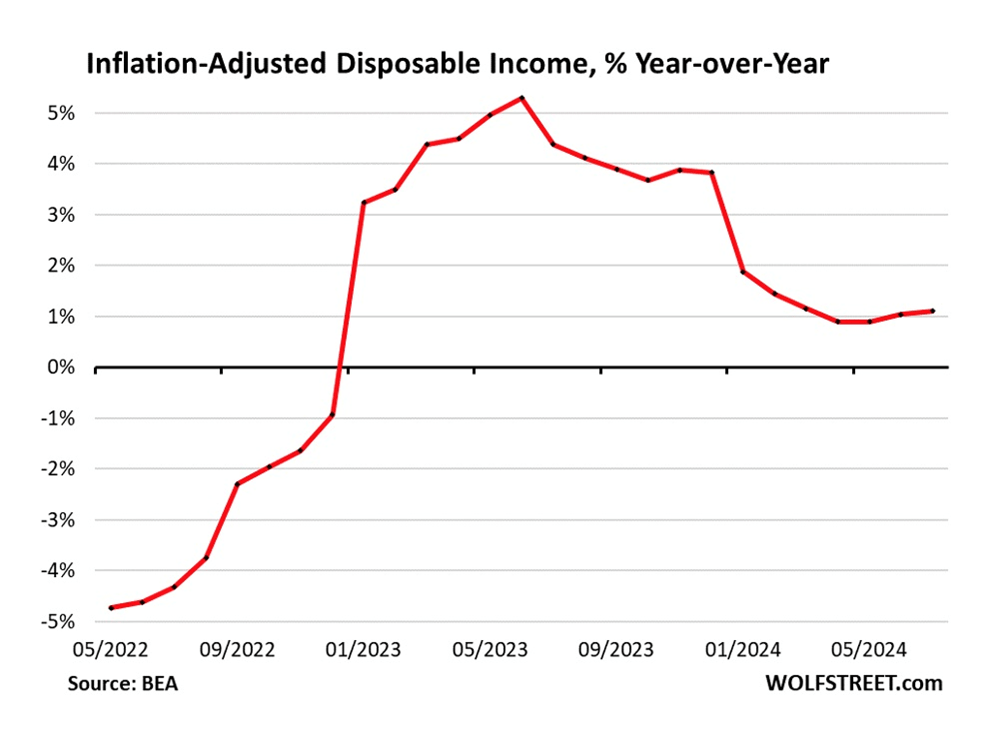
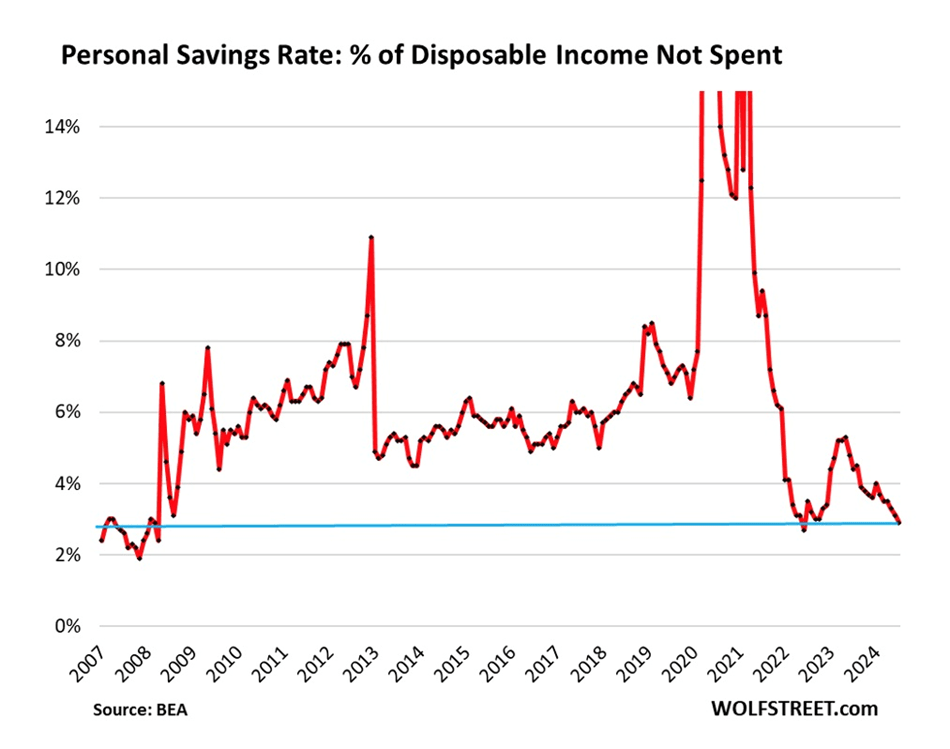
The report also showed disappointing news on income growth. On an inflation-adjusted basis, disposable income growth barely rose for a second month, and the saving rate slipped to 2.9%, the second-lowest reading since 2008.
Wages and salaries, unadjusted for inflation, climbed 0.3% — a slight pickup from June but well below most of the gains in 2023.
All of this is fuel for the first interest rate cut in September since the spring of 2022.
But consumers are hurting
Other signs of a weakening US economy and pain beginning to be felt by consumers include:
- Aging business districts are contending with empty offices and a slow return of workers, while neighborhoods just miles or even blocks away are faring better — or even thriving. Such disparities are unfolding the US, exposing deep divides in the commercial real estate market.
- Americans are seeking to change their insurance coverage more frequently than in the past, after a surge in premiums that’s squeezed household budgets, a new industry report shows. While the overall cost of living has climbed some 20% since the start of the pandemic in 2020, auto insurance bills have jumped by almost 50%.
- Nvidia’s stock is flashing a sell signal, and according to veteran strategist Bill Blain, via Business Insider, this marks the peak of a decades-long market cycle. Blain said that While investors are pricing in ambitious rate cuts over the next year, policy easing will likely be “limited” from the Fed, he said, adding that he believed 4%-6% interest rates would constitute the market’s new normal.
 Source: Wolfstreet.com
While consumer sentiment improved in August for the first time in five months, as slower inflation and the prospects for rate cuts lifted expectations about personal finances, Bloomberg says consumers remain hamstrung by still-elevated borrowing costs, less hiring and a higher cost of living…
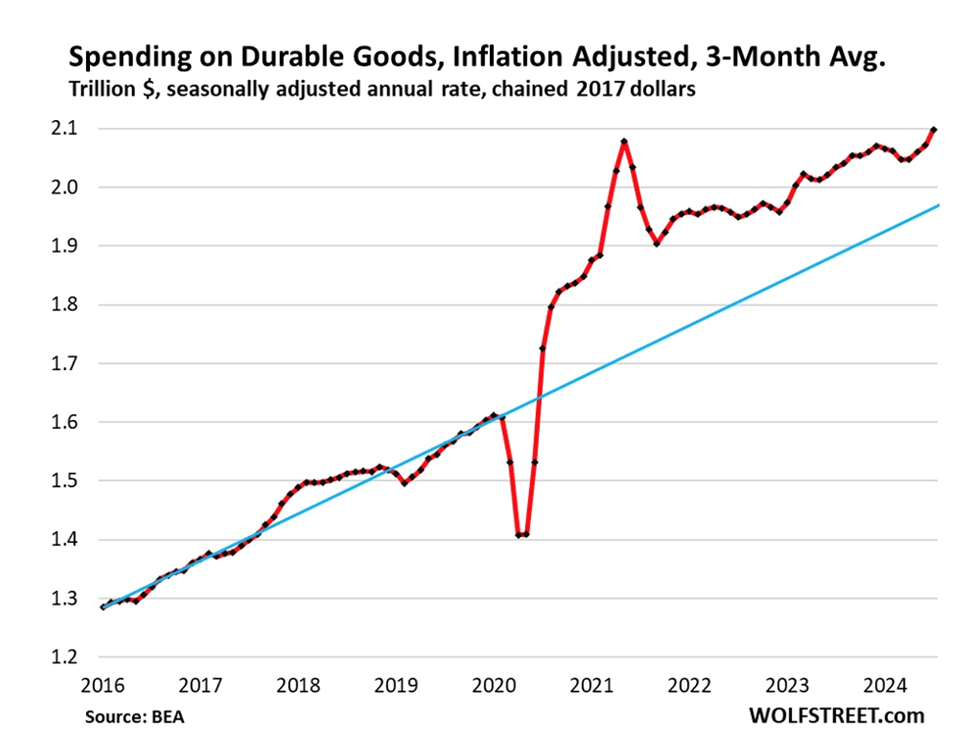
As a result, buying plans for durable goods such as cars and appliances slipped to the lowest level since the end of 2022.
(This is according to a University of Michigan report.)
While a separate report earlier Friday showed solid consumer spending at the start of the third quarter, discretionary income barely rose and the saving rate dropped to a two-year low.
That helps explain why consumers view their finances as currently stretched. The university’s report showed sentiment about current personal finances held at the lowest level since October and well below the historical average.
 Source: Wolfstreet.com
 Source: Wolfstreet.com
 Source: Wolfstreet.com
 Source: Wolfstreet.com
Government spending 80% in Canada
From Macroeconomics 101, a nation’s Gross Domestic Product (GDP) is composed of consumption, investment, government spending and exports. An article I read recently scared the Living Bejesus out of me for what it said about Canada’s GDP.
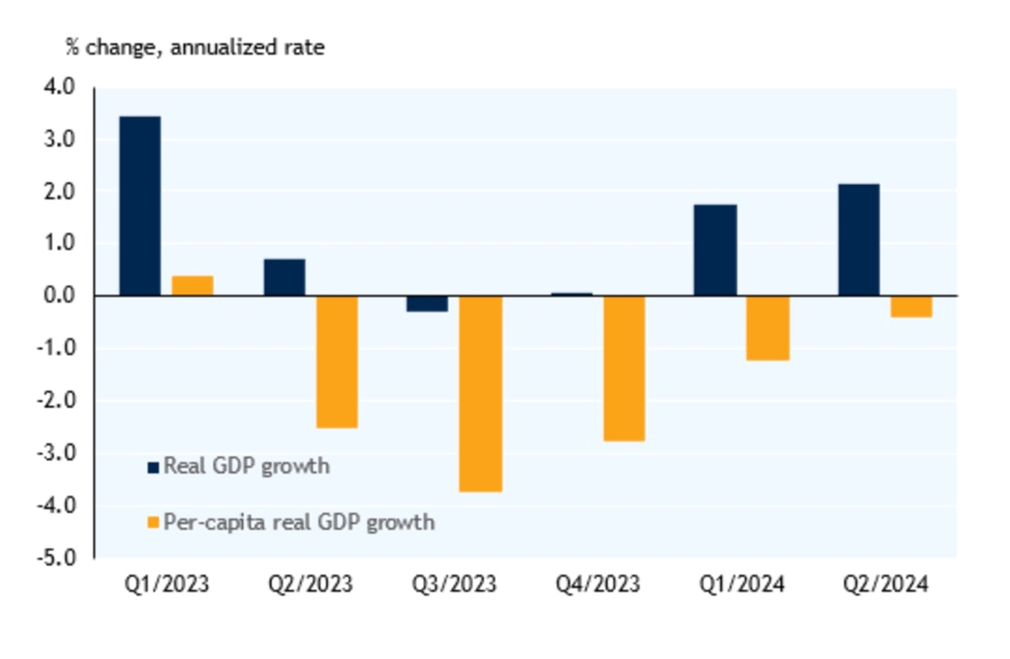
While Stats Can data showed real (after inflation) GDP rose more than expected in the second quarter, a deeper dive revealed that productivity further eroded on a per capita basis, household spending weakened, and that government spending accounted for a whopping 80% of GDP growth in Q2.
“Canada increasingly resembles an economy in recession, despite not quite meeting the country’s preferred definition of one”: ‘Better Dwelling’
The article goes on to say that real GDP per capital fell 0.1% in Q2 2024, the fifth quarter it has declined. Per capital growth fell in seven out of the past eight quarters, “marking a recession by some definitions.”
Source: RBC
If $8 out of every $10 spent in Canada is by government, it makes me wonder whether the same thing is happening south of the border.
I’d bet it is.
Both the Republicans and the Democrats have spent like drunken sailors since Trump became president in 2016 — at first due to pandemic-related relief programs, which overlapped presidencies, and then Biden’s clean-energy/ infrastructure bills including the Chips and Science Act, the $1.2 trillion infrastructure bill and the Inflation Reduction Act.
Trump also presided over a huge tax cut in 2017. According to the Center for American Progress, tax cuts under presidents Bush and Trump have added $10 trillion to the debt since their enactment and are responsible for 57% of the increase in the debt ratio since 2001.
BNN Bloomberg recently reported that Republican nominee Donald Trump and running mate JD Vance are campaigning on a grab bag of tax cut proposals that could collectively cost as much as $10.5 trillion over a decade, a massive sum that would exceed the combined budgets of every domestic federal agency.
Trump spent about $8 trillion during his first term and Biden spent $6.5 trillion. The national debt currently sits at $35 trillion and growing.
Who is responsible for inflation, Trump or Biden?
What, and who, caused the inflation the Fed is currently fighting? – Richard Mills
Remember that “Budgets and deficits stand for the first year because the federal fiscal year runs from Oct. 1 to Sept. 30. This makes it impossible for the incoming president to influence whether the budget has a deficit from January, when they take office, through the remainder of the fiscal year.”
This means Trump was responsible for 2020 and 2021 spending and budget deficits. In October 2020, inflation was at 1.2%. A year later, inflation was at 6.2%. Trump’s fiscal policies more than quintupled prices in one year.
If we take October 2021 as the start of the first fiscal year he was responsible for, Biden is only to blame for a 2.9% rise in inflation (9.1% minus 6.2%).
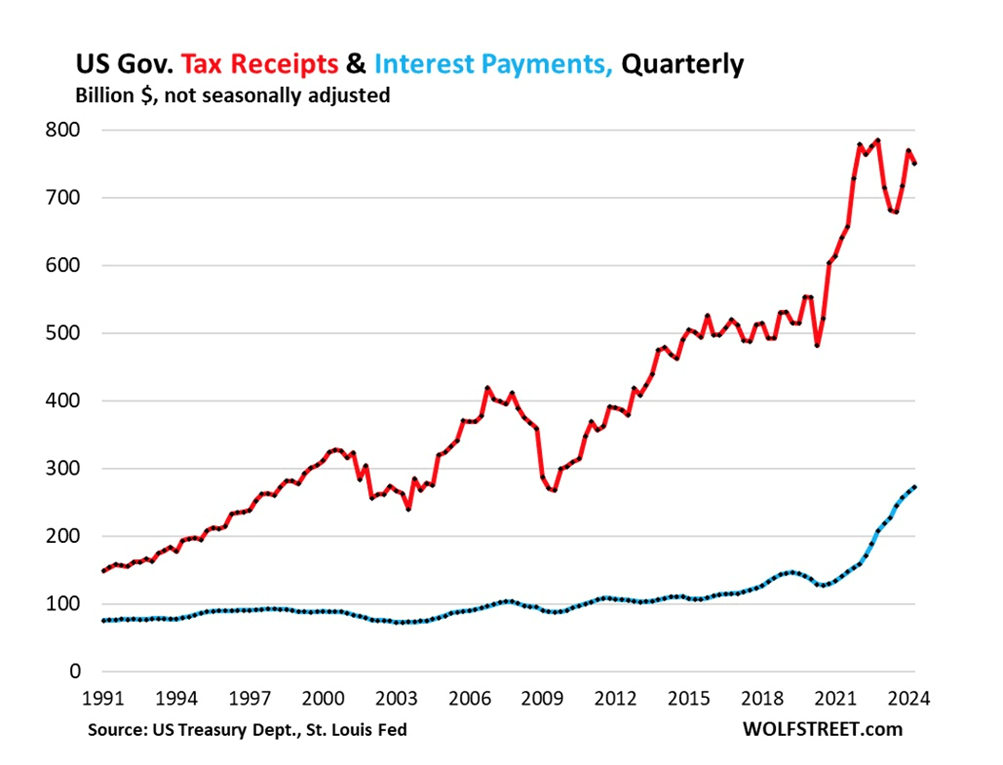
Wolf Richter did some research into the portion of tax receipts consumed by interest payments. He found tax receipts by the federal government in Q2 jumped by $69 billion, or by 10.2%, year-over-year to $751 billion, according to a measure released Aug. 29 by the Bureau of Economic Analysis.
Other noteworthy tidbits:
- Interest payments by the government on its gigantic and ballooning pile of debt surged by $45 billion, or by 20%, year-over-year in Q2 to $272 billion (blue)
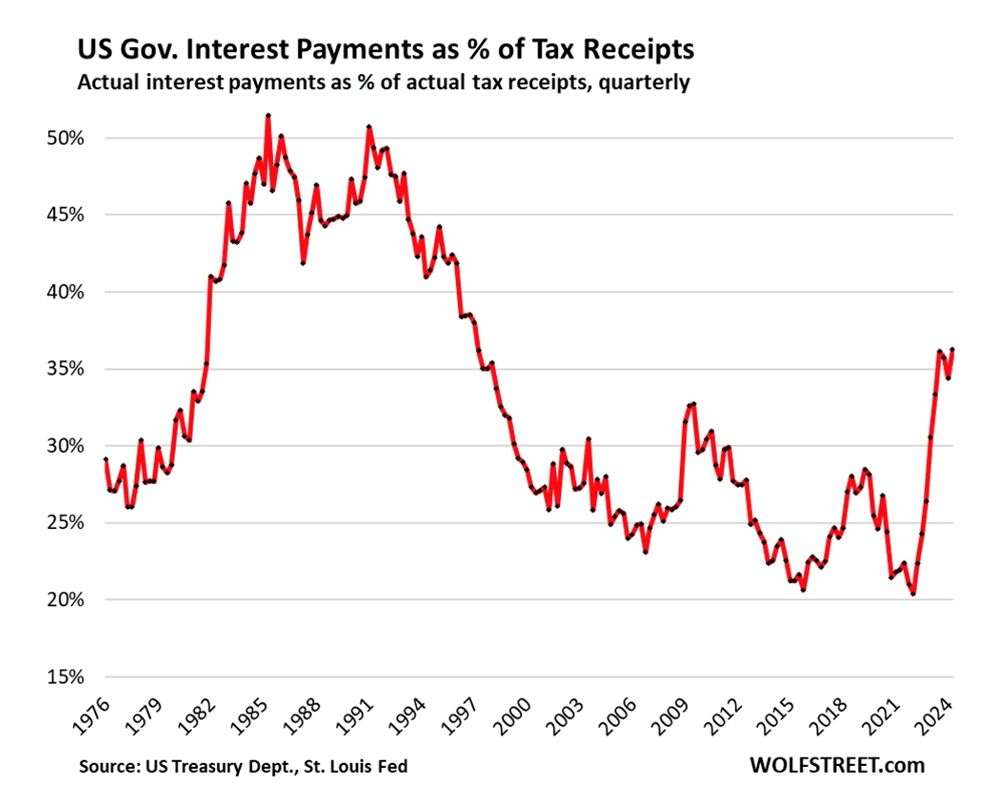
- The ratio of interest payments as a percentage of tax receipts in Q2 rose to 36.3%, a notch higher than in Q3 2023, and the highest since 1997. This ratio shows to what extent interest payments are eating up the national income.
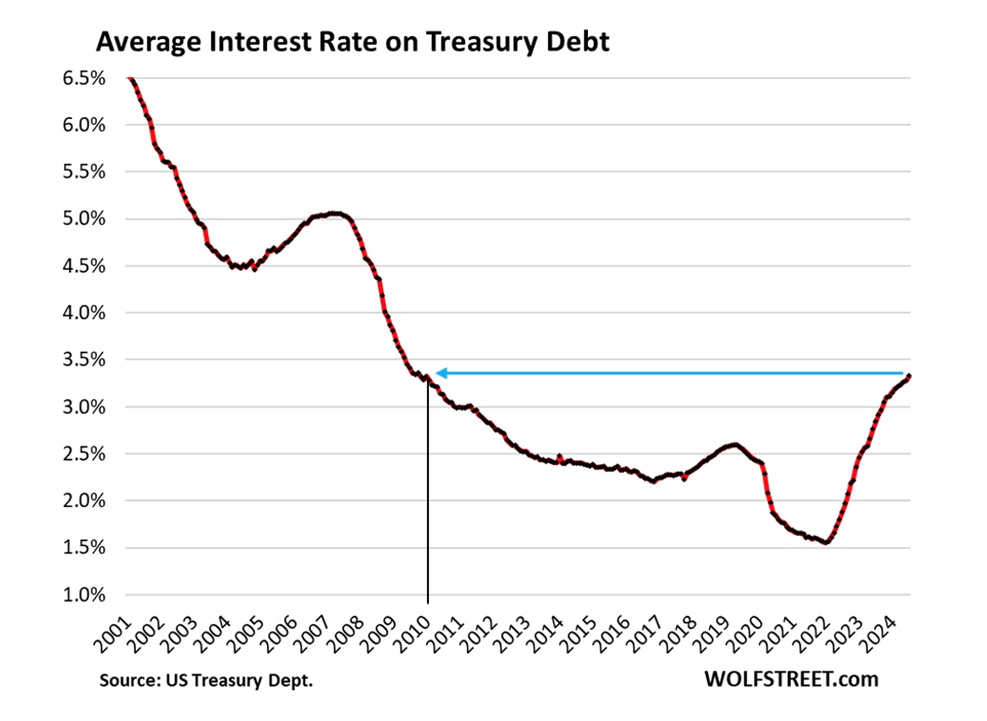
- T-bill yields have been over 5% since early 2023. This is the most expensive debt that the government currently has, and the government has increased this debt by 50% over the past year. In July, the average interest rate that the Treasury department paid on its total debt was 3.33%, the highest since January 2010, though that’s still fairly low by historical averages.
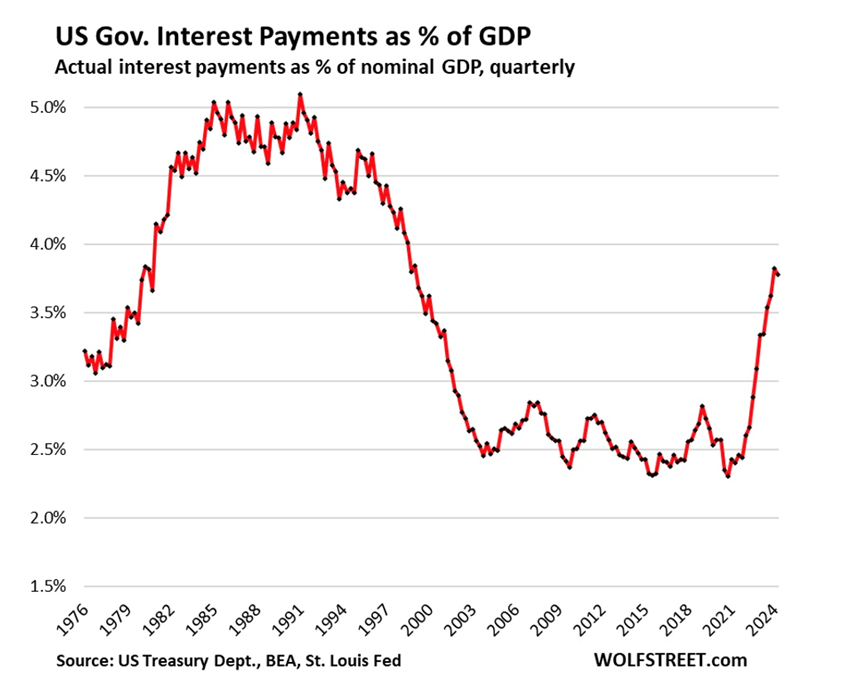
- Interest payments dipped a hair to 3.8% of GDP in Q2, the second worst since 1998, just behind Q1… This does not look good:
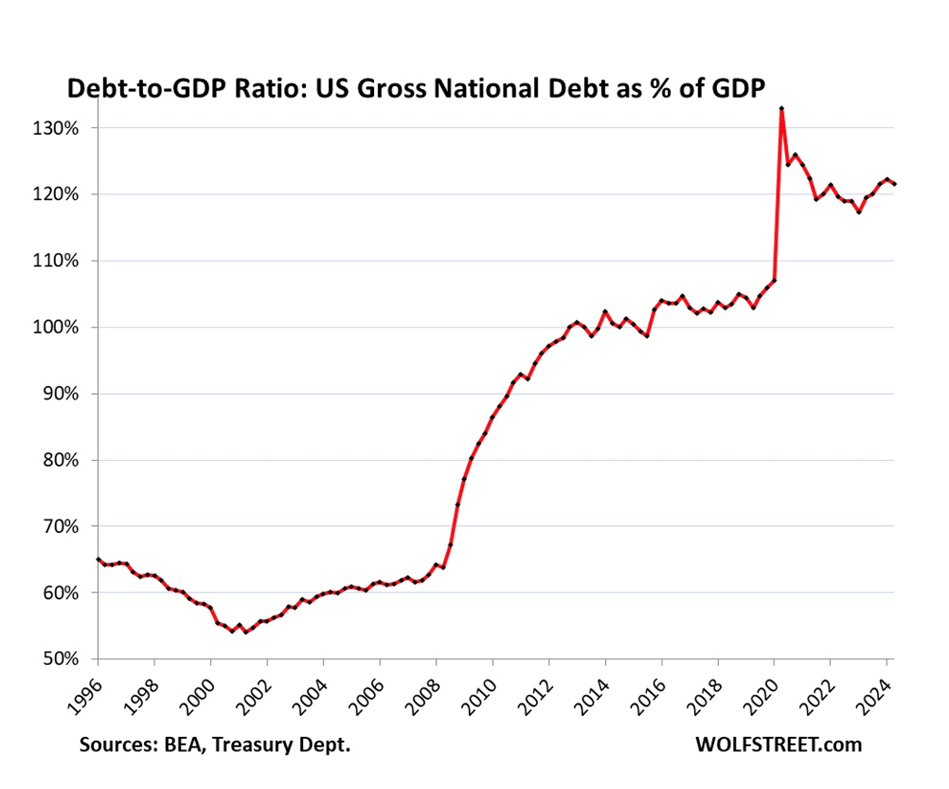
- Total debt as % of GDP dipped a hair to 121.6% in Q2.
Conclusion
Consumer spending is 70% of the US economy and the same percentage of the global economy. Why do you think central bankers have been so focused on reducing inflation and keeping people employed? Because when consumers stop spending and working economies grinds to a halt.
Developed-world governments continue to spend beyond their means, borrowing and printing money to pay for their exorbitant expenditures. None of it has any consequences, other than inflation, due to fiat currencies. It doesn’t matter how high interest rates go, they just keep borrowing, adding to deficits and national debts.
This is unsustainable and eventually will come to a crashing halt. When an individual borrows money he/she starts a loan by paying mostly interest. Gradually the principal gets paid down and the loan is paid off.
The politicians in power are no different, except they don’t care about paying off their loans. They issue Treasury bills to get people, corporations and other governments to buy their debt. They pay out interest to bondholders but how much of the principal is actually being paid down? Very little I would argue.
How long before interest payments are so high that governments can no longer afford them? That would mean a debt default.
In the US, Canada and Europe, governments keep kicking the debt can down the road. Interest rate reductions have already begun in the UK and Canada and they are soon to happen in the US. Are we zero bound? We all know what that means: a goosed stock market, more borrowing, more debt.
How many kicks of the can have we got left? If we continue down this path, the result will not be your garden-variety recession but another Great Recession or even a Depression.
Subscribe to AOTH’s free newsletter
Legal Notice / Disclaimer
Ahead of the Herd newsletter, aheadoftheherd.com, hereafter known as AOTH.
Please read the entire Disclaimer carefully before you use this website or read the newsletter. If you do not agree to all the AOTH/Richard Mills Disclaimer, do not access/read this website/newsletter/article, or any of its pages. By reading/using this AOTH/Richard Mills website/newsletter/article, and whether you actually read this Disclaimer, you are deemed to have accepted it.
MORE or "UNCATEGORIZED"
Imperial Provides Update on Mount Polley 2025 Production and Exploration
Imperial Metals Corporation (TSX:III) reports that 2025 metal pro... READ MORE
Ascot Resources Announces Key Elements of 2026 Vision, Proposes Name Change to Cambria Gold Mines Inc. and Updates Restructuring
Ascot Resources Ltd. (TSX-V: AOT.H) (OTCID: AOTVF) is pleased to ... READ MORE
Discovery Reports Excellent Exploration Results from All Porcupine Targets
Hoyle Pond1 S Zone: High-grade intersections confirm potential to... READ MORE
First Quantum Minerals Reports Fourth Quarter 2025 Results
First Quantum Minerals Ltd. (TSX: FM) reports results for the three mont... READ MORE
Fireweed Metals and Ross River Dena Council Sign Exploration and Collaboration Agreement for Mactung and Macpass Projects
Fireweed Metals Corp. (TSX-V: FWZ) (OTCQX: FWEDF) and the Ross Ri... READ MORE


