







Silver had a phenomenal 2025, more than doubling from around $30/oz to above $70 by late December, and the rally continued into the new year.
Since then, however, silver and gold have both been volatile.
From a record peak of $5,594 an ounce on Jan. 29, gold suddenly fell 9.5% on Jan. 30 to 4,883/oz. The selloff was sparked by President Trump announcing that he plans to nominate Kevin Warsh, a former Federal Reserve governor, as Fed Chairman once Powell’s term runs out in May.
Warsh, a fiscal hawk who has previously criticized quantitative easing, wants to unwind the Fed’s massive balance sheet, and may not lower interest rates as Trump has long criticized Powell for failing to do.
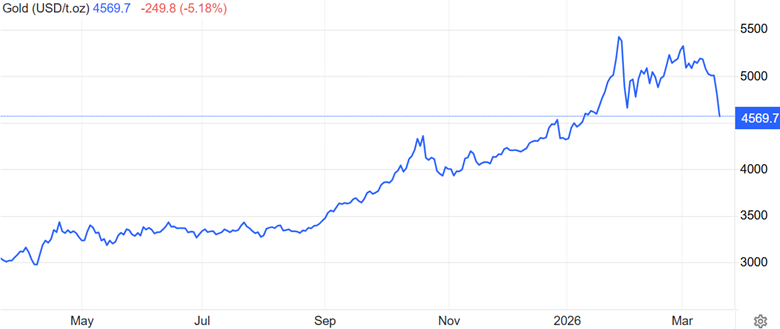
There was also no doubt some profit-taking, with gold having appreciated a whopping 66% in 2025, and traders forced to sell to cover margin calls.
The silver price fell up to 36% on Jan. 30, its biggest one-day wipeout on record, as Bloomberg describes it. The metal had just completed a rapid surge of more than 50% in only a few weeks.
Bloomberg reports, The worst silver sell-off in history at the end of January was accelerated by the growing footprint of retail investors in leveraged exchange-traded funds [who were forced to sell], according to the Bank for International Settlements.
Leveraged (2x or 3x long) exchange-traded funds (ETFs) and exchange-traded commodities (ETCs) provided extremely amplified exposure to silver. Following the massive rally in 2025 and early January 2026, silver prices reversed, leading to severe declines in leveraged long products as they mechanically unwound their futures exposure.
Fast forward to this week, and precious metals took another hit.
Everything changed with the war in the Middle East instigated by the United States and Israel, which attacked Iran on Feb. 28.
With oil prices spiking due to the closure of the Strait of Hormuz, inflation fears are back, and suddenly, the prospect of cutting interest rates is off the table.
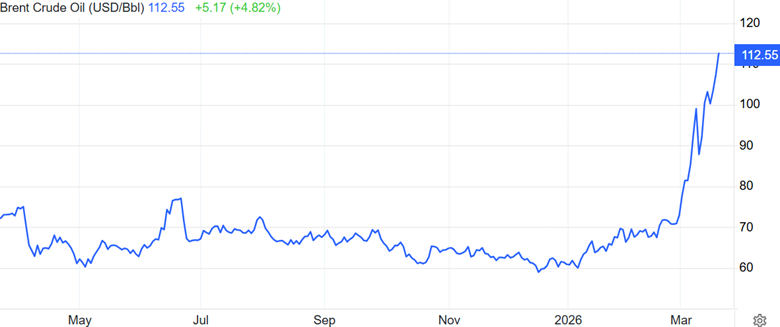
In a 180-degree turn, the word in financial circles is now for the Fed to raise interest rates to quell galloping inflation.
Spot gold fell Wednesday, March 18 to a one-month low of $4,874.19, “pressured by a stronger dollar and a jump in oil prices that stoked inflation fears and reinforced bets that the U.S. Federal Reserve will not cut interest rates soon,” Reuters stated.
Also, “a Labor Department report showed US producer prices increased more than expected in February and could accelerate further due to the war.”
Spot silver fell 3% to $76.90.
As we expected, The Fed held rates steady Wednesday, within a range of 3.5 to 3.75%.
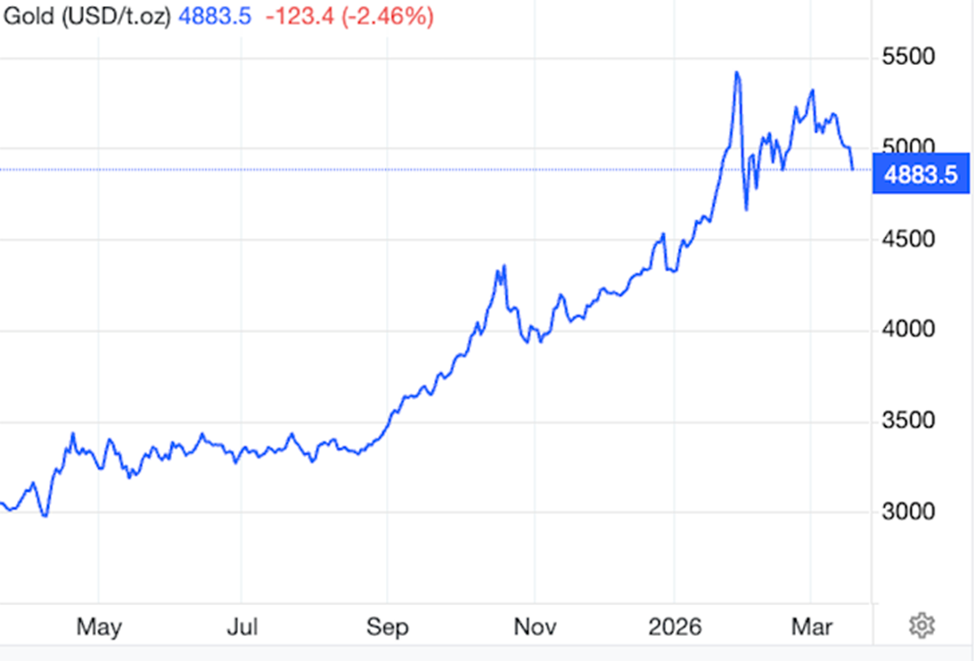
Source: Trading Economics
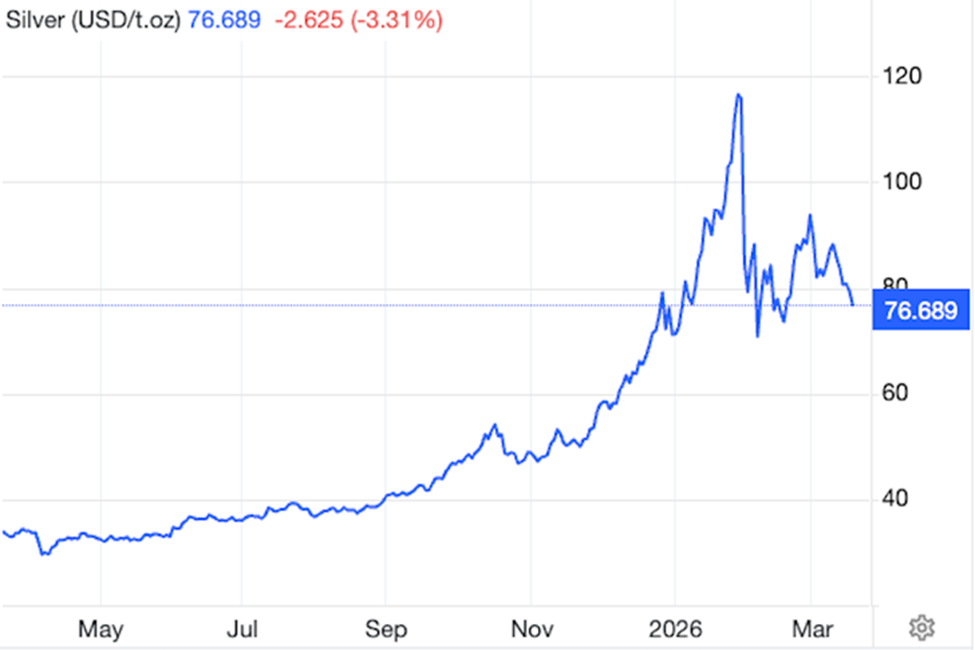
Source: Trading Economics
Sixth year of deficits
In an op-ed piece carried by Kitco News, Frank Holmes, CEO of US Global Investors, says RBC expects the physical silver market to remain tight in the near term, projecting a gold/silver ratio of 60-65 over the next few years. Covered silver producers and precious metal royalty equities are pricing an average silver price of $122/ounce, quite a bit higher than the current spot level of $76.
There is a significant, ongoing structural shortage of physical silver in 2026, marking six consecutive years of deficits where industrial and investment demand outweighs supply. While exchange-traded paper silver exists, physical silver is increasingly scarce, with major inventories in London, New York, and Shanghai experiencing rapid depletion.
Analysts estimate the cumulative supply deficit since 2021 at roughly 820 million ounces — nearly a full year of global mine production, gone.
Record demand from industrial sectors, particularly solar panels, electronics and electric vehicles, is outpacing flat mining supply.
The three largest silver inventories (Shanghai, COMEX, and LBMA) are dropping simultaneously, with nearly a billion ounces vanishing from visible stocks since 2021.
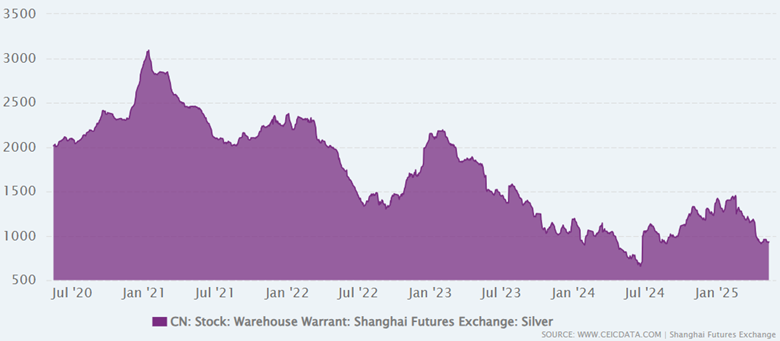
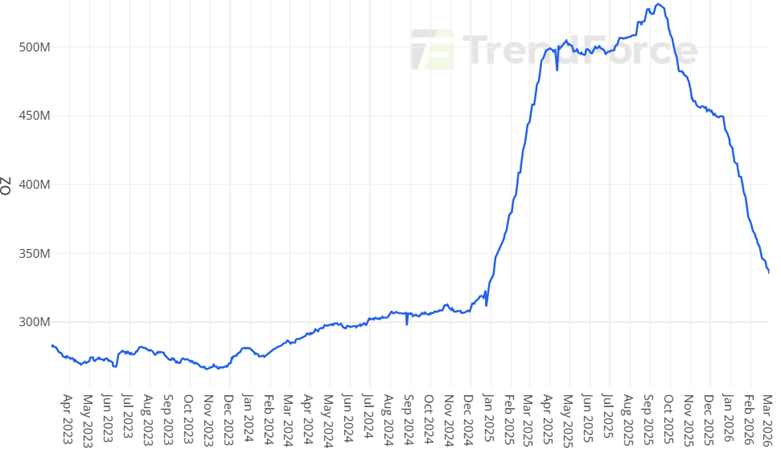
Source DataTrack COMEX
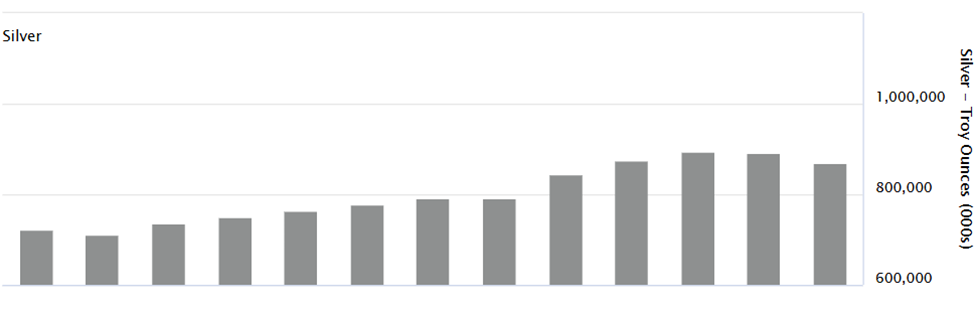
Source LBMA London vault Silver
Strong demand has led to shortages in physical silver products (bars and coins) and tight supply in the physical market.
Where is physical silver going?
The short answer is solar panels.
First, COMEX silver inventory is either eligible metal — belonging to its owner and not available for exchange delivery — or registered metal, which has been warranted for delivery against futures contracts.
Second, we must differentiate between industrial silver users and institutional investors. Industrial users rarely source their metal from COMEX registered inventory. It comes from offtake agreements with mines, with refined silver bought directly from smelters. This ensures consistent supply and a hedge against spot price volatility. This procurement method also provides the specific forms, purities, and quantities needed for manufacturing, bypassing the high-premium, smaller-lot exchange market.
According to Real Clear Markets, by 2025, the solar industry was consuming between 200 and 250 million ounces annually, roughly a fifth of global supply.
EVs consume another 40-60Moz a year, with semiconductors, 5G, medical devices, and AI data centers drawing enough silver to close the gap between what mines produce and the world uses.
Future demand includes solid-state batteries, which may require up to a kilogram of silver per pack versus 25-50 grams in lithium-ion battery cells; and nuclear reactor control rods designated for new reactors to power the AI energy buildout. “The silver market has no clear answer for where that metal comes from,” states Real Clear Markets.
Who’s buying COMEX silver?
According to RCM, for 15 consecutive months, through early 2026, physical silver has been leaving COMEX warehouses at volumes the exchange has never processed. For 2025, the COMEX settled 474Moz of physical silver, more than twice the 203Moz settled in 2024.
As of early 2026, registered silver had fallen about 75% from its 2020 peak.
So, who is buying all the COMEX silver?
According to the exchange’s delivery data, in January 2026 JP Morgan issued (sold) 99% of 8.1Moz of silver in a single day’s delivery notices.
Despite these deliveries, open interest in the contract increased by nearly 1,500 contracts on the same day. According to Real Clear Markets,
New buyers were arriving faster than metal was clearing. Someone was on the other side of all of it, and the data does not name them directly.
Andy Schectman, who runs Miles Franklin Precious Metals and has been watching these flows for three decades, calls it a full-blown run on physical metal — driven by the biggest money in the United States standing for delivery at levels the exchange has never seen. He is not describing retail investors or Reddit communities. He is describing sovereign-adjacent capital, institutional funds, the kind of accumulation that does not announce itself.
Real Clear Markets speculates that one of the buyers is Sprott Physical Silver Trust, one of the largest silver ETFs in the world, noting that Sprott in January doubled its capital raise program to $2 billion, enough to buy approximately 18Moz of silver at then-current prices — or 16% of COMEX registered inventory in a single move.
Sprott is betting that physical allocated silver is worth more than the paper claims against it, and it is committing capital to that thesis at a scale that moves markets.
Probably true. The other likely buyer is Asia. JP Morgan has reportedly been shipping physical metal eastward at premiums of $10 per ounce or more above COMEX prices, with Asian recipients paying the VAT.
That buyers absorbed both the premium and the tax — willingly, repeatedly — says something about how urgently they valued the physical bar over any paper substitute.
Finally, Real Clear Markets notes that China recently classified silver a strategic material and tightened export licenses. During the first 11 months of 2025, China was a net exporter of refined silver, shipping more than 4,000 tons. It then abruptly stopped, the inference being that China is keeping the silver for itself. RCM’s conclusion?
The industrial demand story is why silver is scarce. The delivery data is what happens when the people who understand scarcity decide to act on it.
Concentrate shortage
Most silver is produced as a byproduct of copper, lead, and zinc mining.
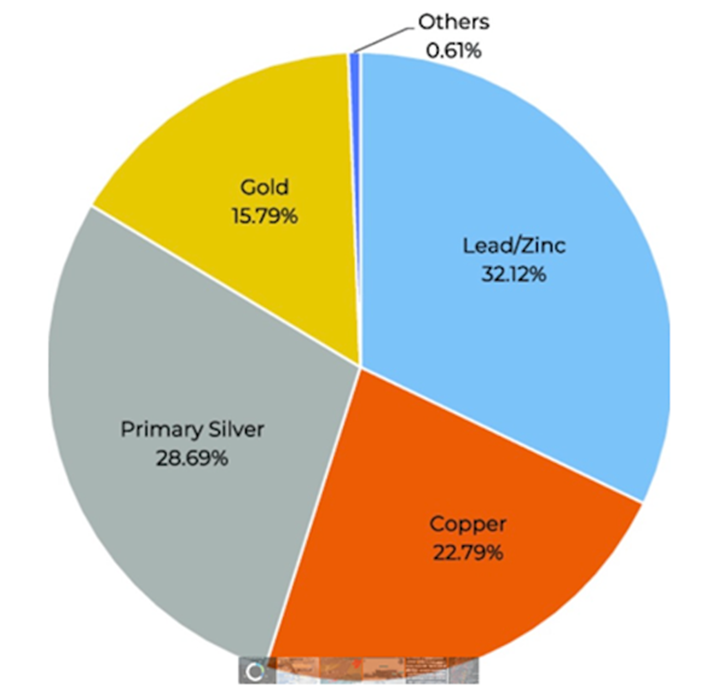
Silver production by source metal. Source: Newman et al.
In fact, there are few pure-play silver mines; only three mines in the United States are majority silver; they are Greens Creek in Alaska, the Lucky Friday mine in Idaho, and the Rochester mine in Nevada.
Roughly 70–80% of the world’s silver supply is produced as a byproduct of mining for copper, lead, and zinc. Dedicated silver mines are rare. As a result, production cannot quickly increase when demand rises or prices spike.
New mines take time. It often requires 7–15 years to move from discovery to meaningful output. At the same time, many existing mines are dealing with lower quality ore and rising operating costs.
— The Coast News Group, ‘Silver’s Supply Squeeze’
There is currently a shortage of copper and lead-zinc concentrates, which is impacting the silver market because there is less silver-in-concentrate to be separated out by smelters, made into finished products and shipped to end users.
Copper
There is a significant structural shortage of copper concentrate, with projections suggesting the deficit will persist, potentially reaching a 50% supply gap compared to demand by 2040. This crunch is caused by declining ore grades, mining disruptions (strikes, accidents), and slow development of new mines, which has caused treatment and refinement charges (TC/RCs) to plummet to historic lows. Major mines such as Grasberg, Kamoa-Kakula and Escondida have faced disruptions, resulting in over a million tonnes of lost output.The shortage has severely impacted smelting profitability, particularly in China, where low treatment charges have led to production cuts.
Heap leaching, which is widely used in Africa for oxide copper ores and increasing in popularity, is effective for extracting both copper and silver.
Many operations in Namibia and the African Copperbelt reprocess old mine tailings dumps, which are rich in copper and often contain significant silver, using acid leaching to improve overall recovery.
Several copper mines in Africa, particularly in the Democratic Republic of Congo (DRC) and Zambia, utilize sulfuric acid for their heap or dump leaching copper operations.
The Middle East accounts for a significant portion of global sulfur, with reports indicating it produces around 24% to 44% of the world’s sulphur, predominantly as a byproduct of oil and gas refining. Roughly half of the global seaborne sulphur trade transits the Strait of Hormuz.
Over 90% of sulphur imported into Africa’s copper belt comes from the Middle East and most operations would have less than 2 months supply. Without Middle East sulphur to make sulphuric acid – because supply chains are cut off – silver supply will be negatively impacted.
The shift toward electrification, data centers and AI is boosting demand, creating an untenable gap between supply and requirements.
The market is expected to remain tight through at least 2026, with the need for substantial investment to build new, large-scale mines.
Zinc
There has also been a marked shortage of zinc concentrate entering 2026, driven by years of declining mine production, despite a recent 30% surge in Chinese imports to meet rising smelting capacity. This tight supply has forced treatment charges to extremely low levels.
The zinc market is facing a substantial deficit. A shortfall of over 300,000 tonnes of zinc concentrate in 2024 suggests a trend that is extending into 2026.
Smelter treatment charges — what miners pay smelters to process ore — dropped to near zero or negative in some deals by early 2026, signaling a severe shortage of raw materials.
Global zinc mine production fell for three consecutive years (2022-2024), reducing the available feedstock for smelters.
Despite the global shortage, China’s imports of zinc concentrates hit a record 5.33 million tonnes in 2025 due to massive domestic smelting expansion, further tightening global supply.
Iran and Russia mainly ship their zinc concentrates to smelters in China, and the conflict in Iran has led to canceled shipments from that country.
Chinese smelters are now looking for alternative feedstock to cover their needs, and are also facing disruptions to supplies from Russia, where a major new mine has ramped up more slowly than expected.
Lead
It’s the same story for lead. The market for lead concentrate remains tight, with limited increases in volume expected through 2026.
A deficit in lead raw materials is expected to persist, keeping the market competitive.
Disruptions at key mines like Boliden’s Tara mine (closed in 2023, ramping up again in 2024-25) and logistical challenges have reduced supply.
Sanctions and operational issues, such as those impacting Russia’s Ozernoye mine, have caused delays and disrupted supply chains.
Lower mine production has forced smelters outside of China to cut production, with some, such as Toho Zinc’s Annaka operation, closing permanently.
Primary silver mines’ output down
Primary silver mine production has faced significant long-term challenges, with analysts warning of continued constraints and a lack of growth, leading to a structural market deficit.
Global silver mine production has been under pressure, with some key primary producers slashing 2026 guidance, including a 9% cut by Fresnillo, the world’s largest primary producer.
With demand frequently outpacing supply, 2026 shows a projected 67-million-ounce shortfall.
Mine supply is not expected to surpass 2016 peak levels for at least five more years due to an insufficient number of new projects coming online.
Declining ore grades at major mines and unfavorable mining regulations — such as Mexico’s moratorium on new mining concessions — are restricting output. Since 2018, no new mining concessions have been granted, a policy upheld by President Sheinbaum, who has stated no new concessions will be issued during her administration. The government has heavily targeted open-pit mining, citing severe environmental damage and excessive water usage in water-scarce regions.
The average all-in sustaining cost (AISC) is projected to rise as energy costs increase, particularly impacting the 70-80% of silver that comes as a byproduct of base-metal mining.
While some companies (e.g., Pan American Silver) reported record production in specific quarters, the overall industry is experiencing a broken supply response, where high prices have not yet translated into significantly increased primary output.
Gold production flat
Global gold mining production has largely plateaued, showing minimal growth since 2018 despite high prices, with experts projecting a gradual decline or peak after 2025-2027. While production hit record levels in 2024-2025, aging mines, declining ore grades, and fewer new discoveries are limiting future supply.
Gold mines have been mining at a higher grade than the reserve grade for much of the last decade. Purposely mining areas of the orebody with the highest-grade material is known as high grading.
Mining the high-grade accessible areas of their deposits was one way for operations to bolster margins when facing low metal prices.
Small wonder the #1 risk identified for mining companies over 2026 is rising operational complexity which is being driven by more complex ore bodies, much deeper mines and significantly declined ore grades.
And mining capital is increasingly favoring brownfield expansions, which offer 50% to 70% faster production timelines compared to new greenfield projects.
Global mined production has remained relatively steady (around 3,000–3,300 tonnes per year) over the past several years.
Experts, including from the World Gold Council, indicate that mining production is likely near a peak, expected to plateau between 2025 and 2027 before potentially falling.
Large gold mining companies saw reserves shrink roughly 26% from 2012–2017, and no major new gold deposits were found in 2023 or 2024, pointing to long-term supply challenges.
While global supply was somewhat stable, countries like Mali have seen production slumps, and major miners like Barrick reported lower quarterly output in 2025.
Rising costs, political instability, and lower quality ore (lower grade) are contributing to the difficulty of increasing production.
Despite higher gold prices, the industry is struggling to significantly increase output, suggesting a potential long-term trend of falling supply.
2026 silver run
According to an AI-generated summary by TradingKey:Silver prices surged above $90/oz in early 2026 due to a confluence of four structural forces: a physical run on paper silver, China’s export controls, increased central bank accumulation, and rising demand from nuclear power for AI and clean energy. The credit crisis in the paper silver system is forcing institutional investors to demand physical delivery, draining COMEX and LBMA inventories and spiking lease rates. China’s reclassification of silver as a strategic material, restricting exports, has fragmented the global market and exacerbated supply shortages. Emerging market central banks are accumulating silver as a monetary and strategic asset, alongside significant demand for nuclear reactor control rods. These factors indicate a fundamental shift in silver’s valuation, moving it beyond an industrial commodity to a triple-identity asset: industrial, monetary, and strategic.
Conclusion
Despite selloffs at the end of January and today, March 18, the market dynamics for silver haven’t changed. Industrial and institutional demand is exceeding mined supply, with 2026 expected to record the sixth straight year of deficits.
Most silver demanded by industry was going towards solar panels. But other sectors are growing rapidly, acting as the new primary drivers of silver consumption.
AI and data center infrastructure are currently experiencing a monstrous appetite for silver, as it is used extensively in high-performance computing, connections, and servers to prevent overheating.
EV consumption continues to rise, with 25-50 grams of silver used per vehicle, significantly higher than internal combustion engines. Automotive demand is projected to grow by 3.4% annually through 2031. Add in solid state batteries and EV’s are huge users of silver.
The accelerated rollout of 5G infrastructure and increasing complexity in semiconductor chips require massive amounts of silver for electrical contacts and conductive paths.
Silver use in advanced medical electronics and devices is steadily increasing.
Mine supply is not expected to surpass 2016 peak levels for at least five more years due to an insufficient number of new projects coming online.
Declining ore grades at major mines and unfavorable mining regulations — such as Mexico’s moratorium on new mining concessions — are restricting existing output.
Most silver is produced as a byproduct of copper, lead, and zinc mining. Silver is also found within gold deposits.
Because pure silver mines are rare, production can’t quickly increase when prices spike. Even when a new mine comes online, it often takes seven to 15 years to get to meaningful output.
Making matters worse, there is a shortage of copper and lead-zinc concentrates from which most silver is refined. Treatment charges are so low, even negative, that smelters in some cases are having to pay miners just to keep their operations going.
Without copper concentrate, nearly 23% of silver supply is gone. Without lead-zinc concentrate, 32% of silver supply is gone.
Global gold mining production has largely plateaued, showing minimal growth since 2018 despite high prices — diminishing another source of silver supply.
Meanwhile, institutional investors are backing up the truck for registered silver from metal exchanges like the COMEX.
The three largest silver inventories (Shanghai, COMEX, and LBMA) are dropping simultaneously, with nearly a billion ounces vanishing from visible stocks since 2021.
China used to be a net silver seller but Beijing, apparently aware of its scarcity, is now hoarding silver, having declared it a strategic material and tightening export licenses.
Will the silver mining industry be able to produce, or discover, enough silver that it’s able to meet future demand?
The silver market is experiencing a severe structural deficit, with demand consistently outstripping both primary mining output and recycling, leading to a projected sixth consecutive year of shortages in 2026. Despite rising prices and increased recycling efforts, the shortfall persists, with the 2026 deficit projected to reach 67 million ounces.
Given all that we know about silver, it seems impossible to us that the market is, or will be, in surplus, despite global silver output forecast to increase by 1.5% in 2026 to 1.05 billion ounces, the highest level in a decade.
The silver deficit is real and prices, despite some short-term volatility, will soon reflect market realities and rise accordingly.
Remember: While most of the mined gold is still around, either cast as jewelry, or smelted into bullion and stored for investment purposes, the same cannot be said for silver. It’s estimated around 60% of silver is utilized in industrial applications with 80% of that amount ending up in landfills, like solar panels and electronics, leaving only 40% for investing.
Subscribe to AOTH’s free newsletter
Legal Notice / Disclaimer
Ahead of the Herd newsletter, aheadoftheherd.com, hereafter known as AOTH.
Please read the entire Disclaimer carefully before you use this website or read the newsletter. If you do not agree to all the AOTH/Richard Mills Disclaimer, do not access/read this website/newsletter/article, or any of its pages. By reading/using this AOTH/Richard Mills website/newsletter/article, and whether you actually read this Disclaimer, you are deemed to have accepted it.
Divests US$13.5M McEwen Copper Debt to Further Enhance Liquidity ... READ MORE
Aura Minerals Inc. (NASDAQ: AUGO) (B3: AURA33) is pleased to anno... READ MORE
Montero Mining and Exploration Ltd. (TSX-V: MON) (OTC Pink: MXTRF... READ MORE
Barksdale Resources Corp. (TSX-V: BRO) (OTCQB: BRKCF) (FSE: 2NZ) ... READ MORE
Getty Copper Inc. (TSX-V: GTC) (OTCQX: GTCDF) is pleased to an... READ MORE


