


Gold is up 51% year to date and reached a record-high $4,059/oz on Oct. 8, silver is doing even better at a YTD increase of 70%, palladium is up 59%, and platinum has gained 76%. Copper is up 24%, currently trading at $4.86/lb and continues its climb from $2/lb in 2016, having recently spiked to $5.80/lb.
Commodity prices will of course depend on the supply and demand for each, but the Globe and Mail points out that several commodities are under-valued compared to the overheated US stock market.
Take copper, which after inflation is 30% below its 2011 peak, or oil and the Bloomberg Commodities Index (BCOM) which are 70% under their previous peaks in 2008.
The S&P 500 by contrast continues to hit all-time highs, having almost tripled since the pre-financial crisis peak in 2007.
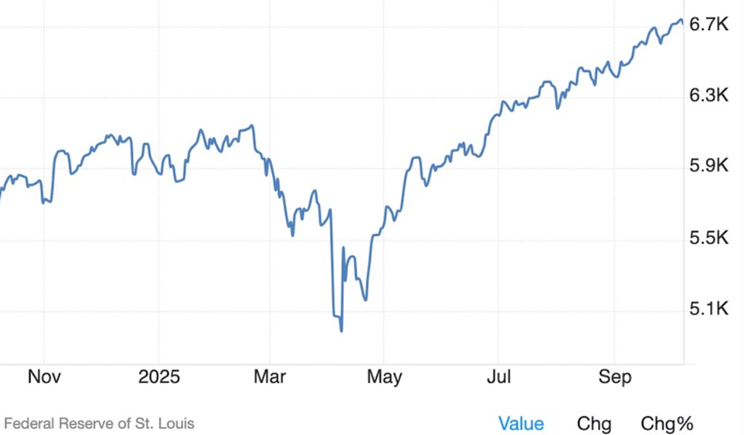
1-year S&P 500. Source: Trading Economics
Kitco News ran a chart in 2024 showing that equities are expensive and commodities are cheap.
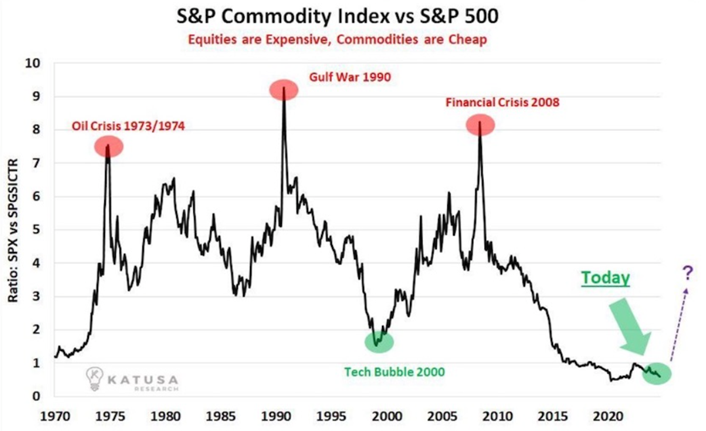
During periods of easy money, risk assets like stocks tend to outperform as investors chase gains, but during times of economic strife, commodities become the safe haven for many investors. According to one analyst, now is the time to prepare for a commodity super-cycle.
“The last [two] times we saw these valuations for commodities was 1971 and 2000,” tweeted MN Consultancy founder Michaël van de Poppe. “Commodities & Crypto are extremely undervalued and it’s likely that commodities go into a 10-year long bull market.”
“I’m expecting a lot of upside from these two asset classes,” Poppe said.
As shown in the image above, commodities are currently valued at levels lower than in the lead-up to the dot-com bubble of 2000 and the 2008 financial crisis, and if history is any guide, they could soon rapidly catch up to the field as investors rotate out of an overheated stock market.
Meanwhile investors are shying away from bonds due to inflation. The inflation threat has them demanding higher yields especially on long-term bonds
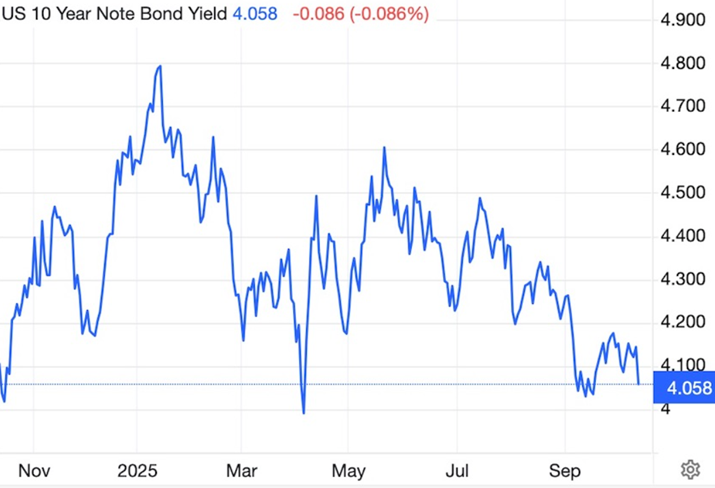
10-year Treasury yield. Source: Trading Economics
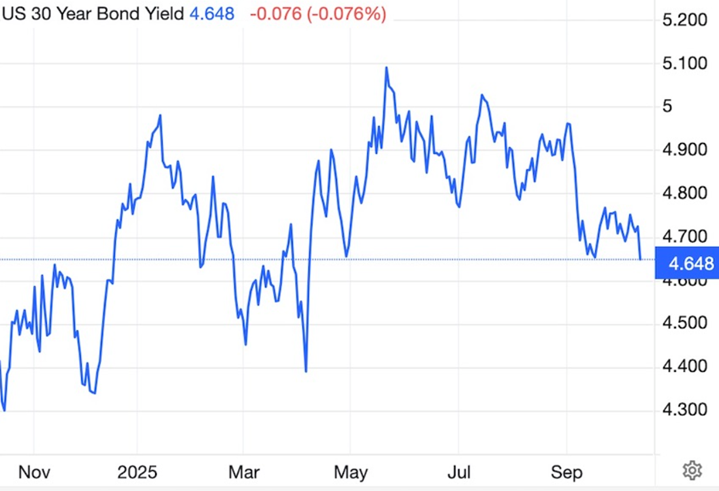
30-year Treasury yield. Source: Trading Economics
While much has been written on the dawn of a new commodities super-cycle, including The Globe and Mail and this post by Kitco News in 2024, heavily referencing my writing at the time, there is evidence to prove that the super-cycle has already begun.
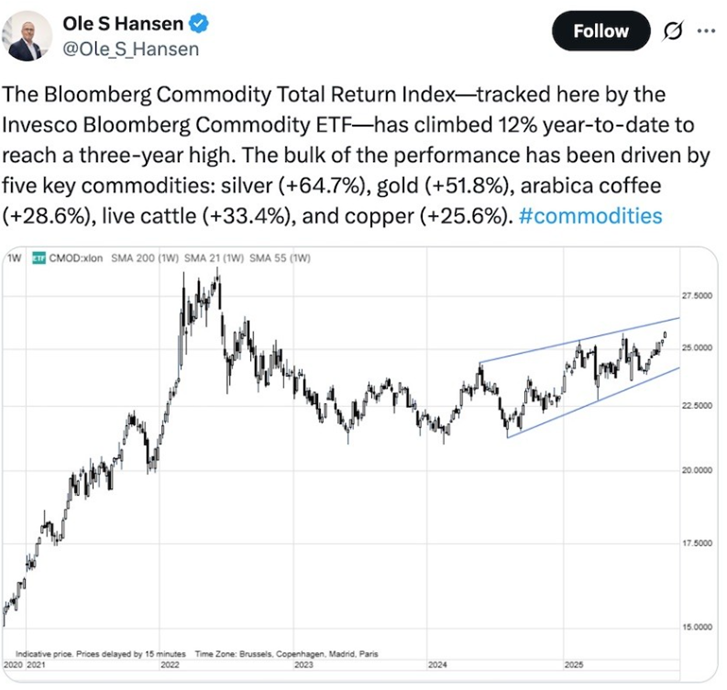
Take the following post by Ole Hansen, head of commodity strategy at Saxo Bank and another frequently quoted commodities and precious metals pundit:
Source: X
In a related post, Hansen showed a silver chart breaching $50 an ounce, the highest price in 40 years.
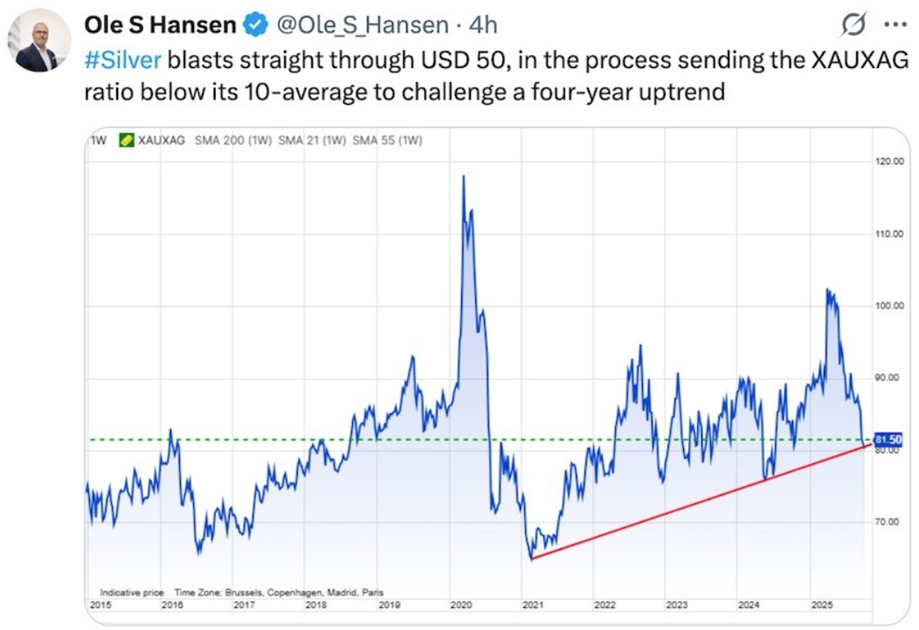
Source: X
A video has Hansen saying that gold, which this week punched through $4,000/oz, is basically a culmination of a year-long rally that has been ongoing literally since 2024. When gold rallies as hard as it does, together with silver and platinum, it is a reflection of a world where there’s a lot of uncertainty, both politically and economically. With that, we’re seeing investors increasingly moving into gold.
Let’s take each of the commodities Hansen mentions in turn.
Gold
On Tuesday, Oct. 7, gold surpassed $4,000 an ounce for the first time ever, with gold futures hitting $4,011/oz. On Wednesday gold reached $4,059/oz but it has since slipped back below $4,000.
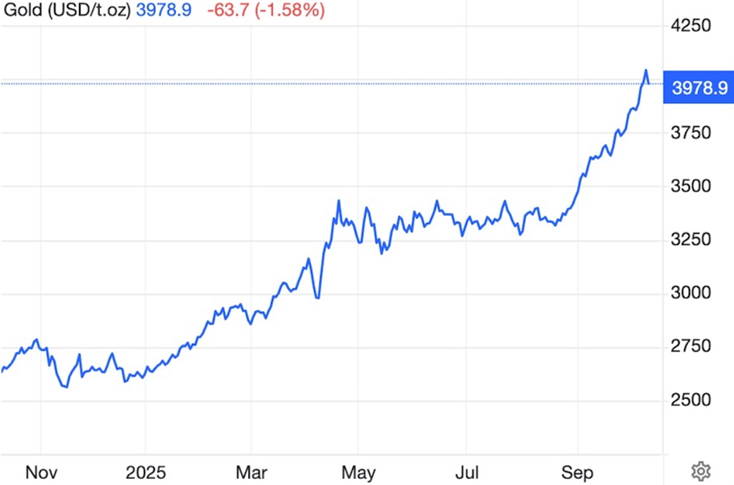
Source: Trading Economics
Factors causing gold to move include interest rates, real interest rates, inflation, the US dollar, geopolitical tensions, and economic events such as recessions, or the trade war currently being waged by US President Donald Trump. The latest worry among investors that is drawing them into gold is the US government shutdown, now into its second week.
In a recent article we looked at why gold is rising and concluded that’s it’s all based on fear.
The gold ‘fear trade’ is on — Richard Mills
During 2020, the covid-19 pandemic year, gold rose from $1,287 on Jan. 1 to $1,807 on Dec. 1, a gain of $520 or 40%.
Afterward, inflation took off due to supply chain disruptions and the huge amount of money-printing that took place in the form of economic stimulus. As inflation went from 0.1% in May 2020 to a 40-year high of 9.2% in June 2022, gold rocketed from $1,413/oz to $1,906, another nearly $500 gain or 34% increase.
Gold has received a significant boost from President Trump in his second term, and it has kept climbing as his trade war continues.
Unemployment has ticked up from 4% at the beginning of the year to 4.3% currently. Inflation accelerated to 2.9% in August, the highest since January.
If the employment situation worsens and inflation keeps climbing, look for economic growth to sputter as the US enters stagflation — an unsavory mix of inflation, low growth and high unemployment.
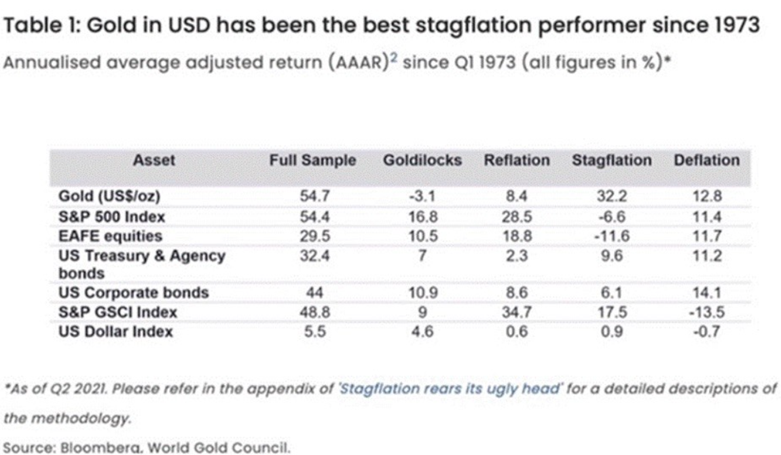
How has gold done during stagflation? As it turns out, quite well. The gold price climbed during the stagflationary 1970s and surged from $100 per ounce in 1976 to around $650 in 1980, when CPI inflation topped out at 14%.
In fact, gold outperforms other asset classes during times of economic stagnation and higher prices. The table below shows that, of the four business cycle phases since 1973, stagflation is the most supportive of gold, and the worst for stocks, whose investors get squeezed by rising costs and falling revenues. Gold returned 32.2% during stagflation compared to 9.6% for US Treasury bonds and -11.6% for equities.
Bad economic news leads to precious metals being are an attractive alternative to stocks. Gold/ silver perform even better if the dollar weakens. Investors also like gold and silver when inflation is high; unlike fiat currencies, precious metals don’t lose their value.
Precious metals have been on a tear this year and that is no surprise considering the current political climate in the US, and the geopolitical tensions throughout the globe, particularly Israel-Iran missile strikes, Gaza, and the ongoing war between Russia and Ukraine.
We also can’t forget the South China Sea. China is sending aircraft carriers out into the Pacific and making big waves against Taiwan.
Incidents like these — wars, territorial disputes, and bad economic news such as inflation, low economic growth or a pending recession — normally push investors towards safe havens like gold and silver.
Central bank buying is another major cause of exploding gold prices.
The World Gold Council (WGC) says gold is attracting more attention from central banks than at any time in the last decade.
In its annual central bank gold survey, published in June, the WGC said 95% of respondents expect global gold reserves to increase over the next 12 months. 43% of central bank reserve managers said they plan to increase their gold holdings this year, compared to 29% in last year’s survey. (Kitco News)
Over the past three years, central banks have purchased over 3,000 tonnes of the precious metal. Analysts predict they could add another 1,000 tonnes to their reserves this year.
Demand is largely being driven by emerging market central banks, which are diversifying their holdings away from the US dollar, more so than developed market central banks.
Central banks worldwide are on track to buy 1,000 tonnes of gold in 2025, which would be their fourth year of massive purchases as they diversify reserves from dollar-denominated assets into bullion, consultancy Metals Focus said, via Reuters.
French bank Société Générale (SocGen) upped its gold allocation from 7% to 10% for a protective hedge as the US Federal Reserve begins a rate lowering in the face of rising inflation. The French bank expects gold prices to average $4,128 an ounce in 2026.
“From an asset allocation perspective, we have looked at gold in the context of the USD’s dominance being challenged. The key drivers supporting gold remain firmly intact,” the analysts said.
They added that they expect gold prices to remain well supported as falling interest rates and elevated inflation push real yields lower, increasing demand for gold as an alternative store of value.
At the same time, the analysts said that the ongoing global diversification trend away from the US dollar makes the precious metal an important monetary asset. They added that they don’t expect higher prices to be a barrier to further central bank purchases. (Kitco News)
Retail investors are also jumping on the gold bandwagon, despite high prices.
Global gold ETFs saw their third consecutive month of inflows in August, led by Western funds.
Silver
Interest rate cuts are a tailwind for precious metals. Gold is up over 50% year to date, surpassing $4,000 an ounce for the first time this week. Silver had done even better, rising 70%. On Thursday silver breached $50 for the first time since 1980.
Silver’s time to shine — Richard Mills
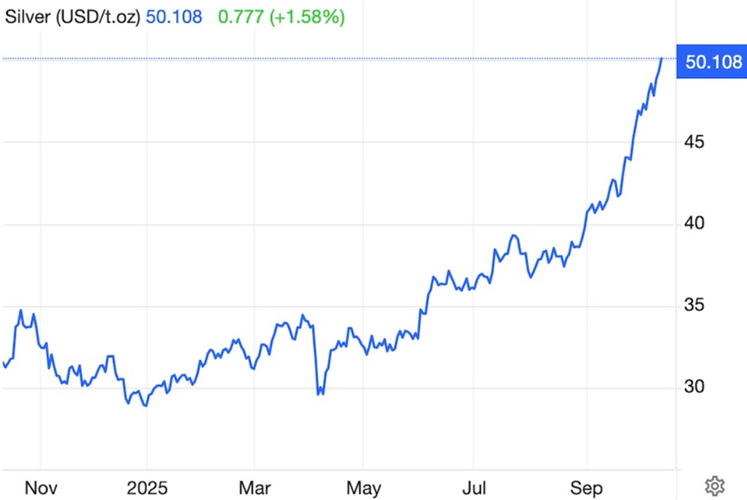
Source: Trading Economics
Goldmoney’s Alasdair Macleod notes the prospect of the gold-silver ratio declining from its current 88 to 50, pushed down by the falling dollar. “With gold at $4,000 and a ratio of 50, that makes silver $80.
“This is not a forecast, only an illustration of silver’s potential,” Macleod writes.
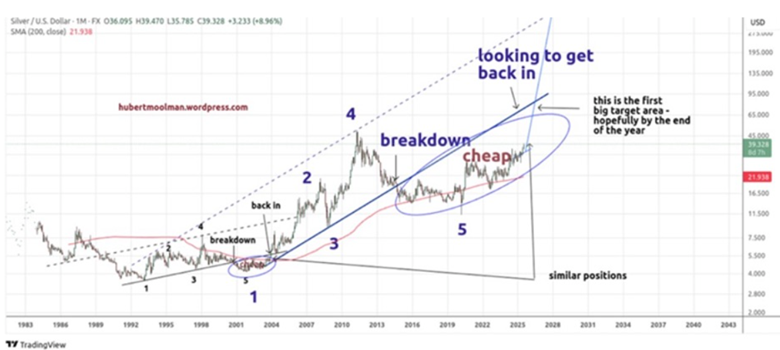
Precious metals analyst Hubert Moolman posted a Silver/ US Dollar chart dating from 1983. He says that based on the fractal in the chart (a fractal is a pattern of five consecutive price bars that signals a potential trend reversal or continuation), “it is expected that we are now likely in a sustained silver rally similar to 2010-2011, for example.” Silver hit a then-record high of $49.51 in April 2011.
Further, Moolman showed in a previous article that significant silver peaks occurred within 8.5 years after the Dow/gold ratio peak, with the Great Depression silver peak occurring the soonest (6 to 7 years after).
“Given that silver actually rallied on a sustained basis for at least 2 years before each of these peaks, we are likely to see silver rally for most of the coming 20 months,” he wrote.
FX Empire says momentum points to higher highs beyond the 42% gain silver has already made this year:
“Structural deficits are colliding with an unprecedented demand boom,” explains GSC Commodity Intelligence. “This is the kind of perfect storm that doesn’t come around often. Breakouts above the $40–$42 resistance zone unlock a direct path to $50 an ounce — and once that level gives way, the market will move faster than most traders can imagine.”
Surging lease rates are another indication of a tightening silver market.
Silver lease rates are the interest rates that borrowers pay to lease or borrow physical silver. Elevated lease rates often indicate a tightening physical market, where it’s more difficult or expensive to obtain physical silver.
Bloomberg wrote on Sept. 8 that traders fear possible tariffs on silver could squeeze already tight supplies in London, where inventories have dwindled as investors pile into gold and silver ETFs.
That scarcity is already filtering through to the market. Silver futures on Comex are trading at an elevated premium of about 70 cents above London’s benchmark spot price, and the cost of borrowing silver in the UK capital on a short-term basis has spiked above 5% for the fifth time this year — well above historical levels of near-zero…
“If you look at US ETF holdings, they’ve absolutely exploded. So, there’s been ongoing demand,” said David Wilson, senior commodities strategist at BNP Paribas SA.
Copper
A major incident involving a landslide at the world’s second largest copper mine, Grasberg in Indonesia, has upended the copper market and sent the price of the base metal soaring.
On Sept. 8., 800,000 tons of mud slid into the Grasberg Block Cave mine — the underground portion of the former open pit — killing two workers and displacing five, who are still missing.
Mine operator Freeport McMoran (NYSE:FCX) suspended operations, declaring “force majeure”, essentially an “act of God” or similar unforeseen circumstance that releases an operator from its contractual obligations to customers.
US-based Freeport advised that, while the incident only impacted one production block, it also damaged other infrastructure at the site.
The company therefore thinks its fourth-quarter sales of copper and gold will be “insignificant”, instead of its previous forecast to ship 445 million pounds of copper and 345,000 ounces of gold.
News of the force majeure saw the price of copper jump 3% to $5.15 a pound, compared to $4.45 at the start of the year. (The Register). Prices are up 17% this year after peaking at $5.50 in May 2024.
On the last day of September, Bloomberg reported copper recorded its biggest monthly advance since June.
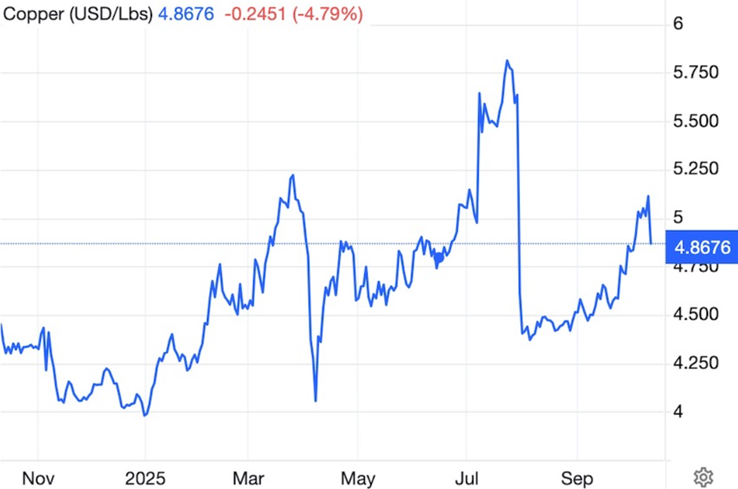
Source: Trading Economics
The supply implications from the halt at Grasberg are grave. In a note, analysts at Societe Generale SA wrote that the copper market could be on track for the widest annual supply deficit since 2004.
Freeport has slashed production guidance for this year and 2026.
Meanwhile demand for copper continues apace.
Electrification and decarbonization are driving demand for metals, especially critical metals like copper.
EVs for example contain four times as much copper as gas-powered cars. Technology companies are investing hundreds of billions of dollars to build AI data centers requiring reams of copper wiring.
Demand for copper — the cornerstone for all electricity-related technologies — is set to grow by 53% to 39 million tonnes by 2040, according to BloombergNEF. A shortfall of 30% could occur by 2035.
Goldman Sachs shifted from a projected surplus of 105,000 tons in 2025 to a deficit of 55,000 tons.
The bank upped its December LME copper price forecast to $10,200-$10,500 a ton from its previous $9,700/t prediction.
Citi Bank now sees a market deficit of 400,000 tons in 2026 (400,000 tons of copper equates to approximately 15.04 days of global supply, using the 2023 refined copper production figure of 26.6 million tons as a basis for global supply) and expects prices to rally to $12,000 a ton over the next six to 12 months.
It revised its output assumptions at Grasberg to 500,000 tons for both 2025 and 2026, down from previous estimates of 680,000 and 774,000 tons, respectively.
Bank of America has also raised its copper price forecasts, flagging ongoing setbacks at some of the world’s largest mines, notably Grasberg in Indonesia, El Teniente in Chile, and Kamoa-Kakula in the Democratic Republic of Congo, as catalysts for rising copper prices.
Mining.com reports the bank now expects copper to average $11,313 per tonne in 2026, an 11% upgrade from its prior estimate, then rising to $13,501 in 2027, for a 12.5% increase. At its peak, copper could reach $15,000 per tonne, the bank’s strategists added, which equates to $6.80 per pound, a price never before reached.
The S curve meeting the J curve makes Copper the new oil — Richard Mills
Some are even calling copper the new oil.
In a recent Financial Post video, Mike Philbrick, chief executive at ReSolve Asset Management Global, talks about the bull market and what investors should be looking at in the AI boom.
Philbrick starts by noting that we are currently in an inflationary environment where inflation, volatility and interest rates are more volatile. That calls for a more resilient investment portfolio.
We are definitely in a race for AI dominance, “but that S curve of tech adoption meets a J curve of resource realities.”
Philbrick is talking about resource scarcity, in particular, a paucity of copper when it comes to the amount of new technology demanded.
“We have an AI build-out that’s creating a real demand-side shock,” he says.
“If you’ve got data center backlogs, multi-year capex that’s going on, you’ve got acute bottlenecks in power, you’ve got turbines, transformers, generators, memory, drive, all of that is in short supply.
And all of that needs to be built out. That means more energy, more grids.
“What’s required for that? Metals, industrial gear, all of those types of things, copper, nickel, silver, all of these core atoms that are going to create the infrastructure for the AI now needs to be produced. And that’s a J-curve. That’s a dip before you get the rip…
“Copper is going to be the new oil. All of the energy or the power that has to run to these data centers is run on copper cables.”
Coffee
Arabica coffee and cattle are the two non-mineral commodities that Saxo Bank economist Ole Hansen says has driven the Bloomberg Commodity Total Return Index to a 3-year high.
CBC News reports that earlier this year, coffee prices hit record highs due to supply issues in major producing countries such as Brazil and Vietnam. US tariffs have also elevated prices.
According to Statistics Canada, the average monthly price of 340 grams of ground coffee is 34% more expensive since January. Canadians paid 27.9% more for coffee in August than they did a year earlier. Coffee brands such as Keurig and Folgers have increased their prices. Popular, affordable restaurant chain Tim Horton’s says it’s increasing its coffee prices for the first time in three years, adding about 3 cents per cup.
The chart below shows Arabica coffee futures hovering near their highest level since mid-September.
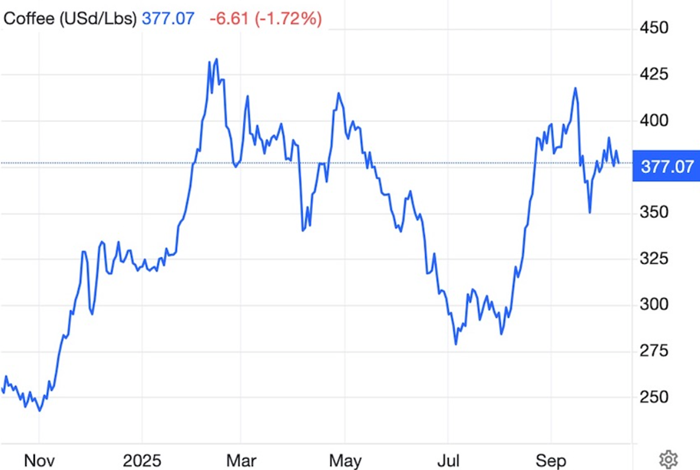
Source: Trading Economics
Cattle
Over the past month, the price of live cattle has risen 1.67%, but it’s the year-on-year number that is the headline grabber: +24.27% according to Trading Economics.
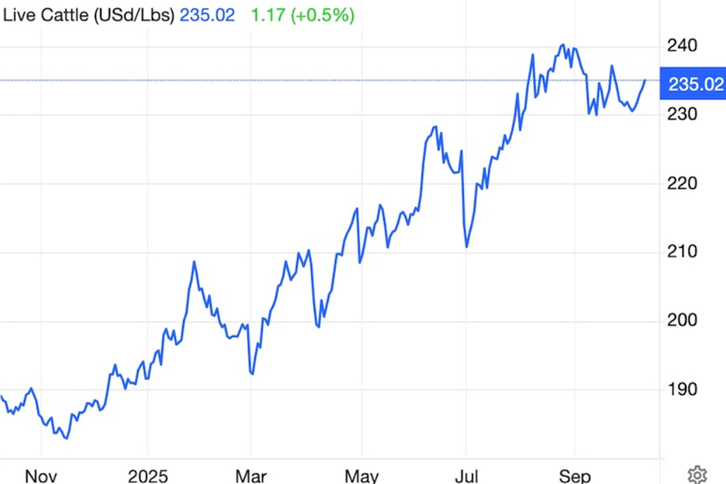
Source: Trading Economics
“The overriding factor in the cattle market seems to be tight supplies,” Progressive Farmer wrote on Oct. 7.
An AI Overview says lower supply is a result of thinner herds, as ranchers send their cattle to slaughter due to consecutive years of droughts, and more expensive input costs, include feed, fuel and labor.
The United States currently has the smallest cattle inventory since 1951. In Canada, inventory is at a 37-year low.
Tariffs on certain imports (such as 50% on Brazilian beef) and a halt on cattle imports from Mexico due to a screwworm outbreak have further tightened supply and increased costs.
The view from The Economist
Commodities tend to be “boom and bust”, also known as super-cycles.
A “commodity super-cycle” is a period of consistent price increases lasting more than five years, and in some cases, decades. The Bank of Canada defines it as an “extended period during which commodity prices are well above or below their long-run trend.”
Super-cycles occur because of the long lag between commodity price signals and changes in supply. While each commodity is different, the following is a rundown of a typical boom-bust cycle:
As economies grow, so does the demand for commodities, and eventually the demand outstrips supply. That leads to rising commodity prices, but the commodity producers don’t initially respond to the higher prices because they’re unsure whether they will last. As a result, the gap between demand and supply continues to widen, keeping upward pressure on prices.
Eventually, prices get so attractive that producers respond by making additional investments to boost supply, narrowing the supply and demand gap. High prices continue to encourage investment until finally, supply overtakes demand, pushing prices down. But even as prices fall, supply continues to rise as investments made during the boom years bear fruit. Shortages turn to gluts and commodities enter the bearish part of the cycle.
The Economist has noticed that today’s boom and bust cycles are shorter and more extreme:
Booms now last an average of 24 months and slumps just 23 months. The peak-to-peak cycle has halved from 90 months to 45 months.
What accounts for this change? The Economist says the drivers of today’s super-cycles are now more on the demand side than the supply side, as was previously the case. For example, from 1970 to 1985 cycles were mostly driven by supply shocks, especially in energy.
As such, the World Bank identifies a new commodity regime.
Some of this shift has been driven by events, namely a combination of the covid-19 pandemic, the shock of Russia’s invasion of Ukraine and large swings in monetary policy over the past five years. But longer-term structural changes also appear to be playing a role. The global energy transition, as governments across the rich world pour billions into green energy sources, is leading to much higher demand for critical minerals such as nickel and lithium. At the same time, more frequent extreme weather has raised supply risks, especially in agriculture. The increasingly fragmented nature of the global economy, with rising trade barriers, has also disrupted the commodities trade.
Commodities and inflation
Investopedia says commodity prices are believed to be a leading indicator of inflation through two channels: First, commodity prices respond quickly to general economic shocks such as increases in demand. Second, changes in prices reflect systemic shocks such as hurricanes, which can decrease the supply of agricultural products and subsequently increase supply costs. Growers pass these higher costs onto consumers, who pay more for agricultural products.
Oil is another good example. When the price of oil increases, the
the cost of manufacturing plastics, synthetic materials or chemical products will also rise and be passed onto consumers.
According to Morgan Stanley, when inflation is higher than expected, history shows that commodities often outperform both equity and fixed income investments.
Studying a diversified basket of commodities from 2000 to 2024, the researchers found that the basket had an average quarterly return of 3.93%, more than double the next closest asset class, real estate investment trusts (REITS).
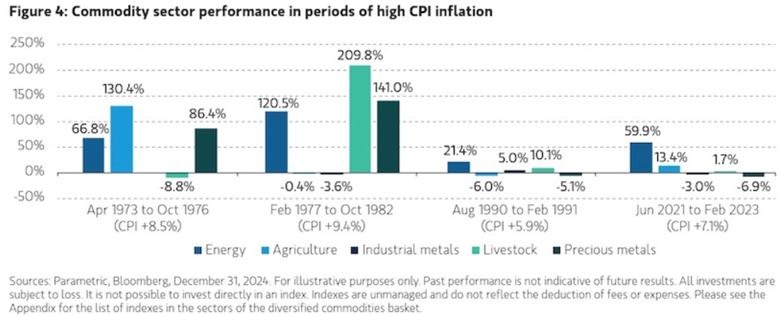
Also, when accounting for volatility, commodities again were a top performer. Per unit of risk, they delivered a return of 0.37% above cash. Why did commodities do so well?
We believe the reason for the leadership of commodities in this environment is twofold: First, higher-than-expected inflation is often associated with strong underlying growth in the economy, which drives demand for raw materials and puts upward pressure on commodity prices. Second, food and energy consumption are large components of the Consumer Price Index (CPI), so it follows that rising prices in those categories would be reflected in corresponding futures contracts.
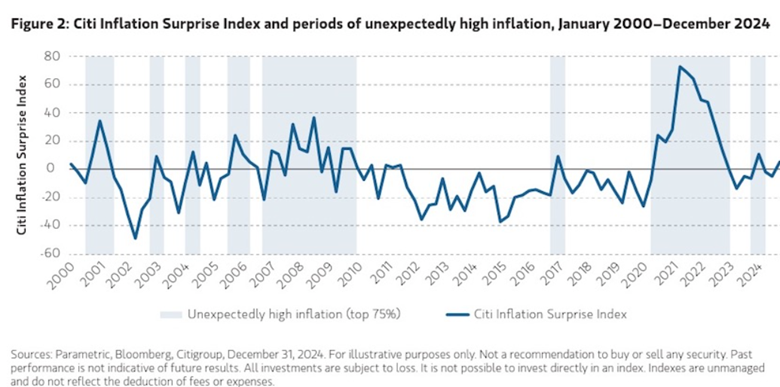
Commodity prices have also played a critical role in the surge and decline of inflation since 2020. According to the Centre for Economic Policy Research, the impact of supply bottlenecks on commodity prices in the post-covid period, and of the Russian invasion of Ukraine on energy prices has boosted interest in the relationship between consumer prices and commodity prices.
Studying 15 economies in the years prior to World War I, 1815-1913, the researchers found a strong positive relationship between the two variables.
Importantly, we demonstrate that global business cycle swings led to fluctuations in commodity demand and had particularly strong effects on consumer price inflation in this period.
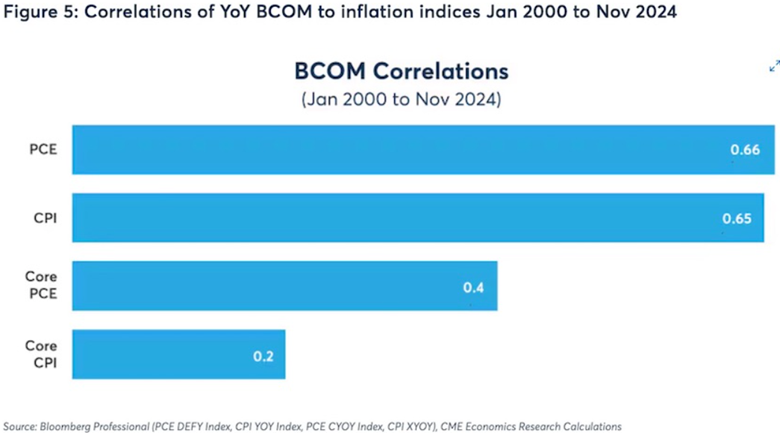
A third source, CME Group, says The data suggests commodity prices (BCOM) have a relatively high positive correlation to the PCE index, and to the PCE’s nondurable goods subsector. The results also show that by lagging the data for three to five months may result in a higher correlation as it takes time for the commodity price changes to find their way through the supply chain.
The correlation was slightly lower for the CPI, and even lower for core CPI and core PCE, as shown in the graph below.
Conclusion
Now that we know what factors have been driving commodities higher, it’s time to look at competing safe havens that haven’t been doing as well lately: the US dollar and US Treasuries.
Dollar weakness
When the US dollar depreciates against the world’s major currencies such as the euro and the yen, gold prices usually rise. Because the price of gold is traded in dollars, when the dollar weakens, gold is cheaper compared to other currencies, boosting its appeal to investors.
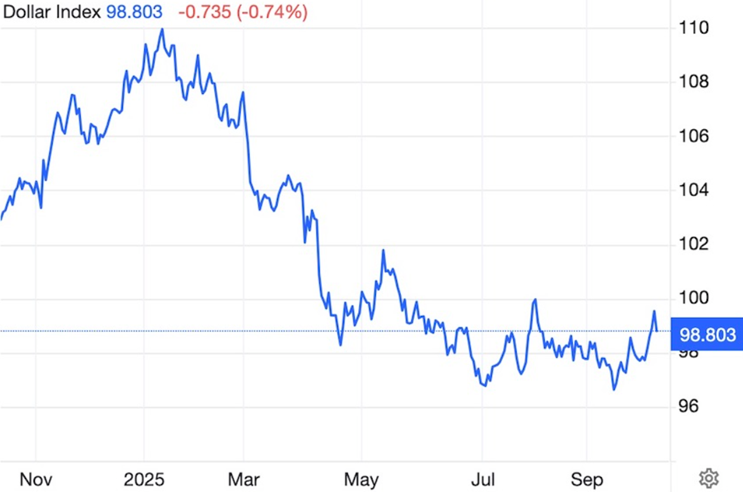
The second Trump administration has been characterized by a low dollar, which is just the way Trump likes it, since a weak dollar is good for exports, and backs Trump’s mantra of repatriating American manufacturing jobs lost to overseas competition.
This is the only time in 10 years that we see a positive correlation between a falling dollar and rising gold prices. From Trump’s inauguration in January 2025, DXY has fallen from 109 to the current 98, a loss of 12%. Gold meanwhile has rocketed from about $2,600 in early January to its current $3,978, a gain of about 50%.
In the first half of 2025, the US dollar saw its steepest decline in over five decades.
Source: Trading Economics
Gold, of course, isn’t the only commodity to benefit from a weak US dollar. A weaker dollar lowers the price of commodities relative to foreign currencies. The lower price of commodities in foreign currency will work to raise demand and dollar-priced commodities. (Investopedia)
Three factors why the dollar has been in decline, by Visual Capitalist:
There’s also de-dollarization. August’s global fund manager survey from the Bank of America found investors were 16% underweight the dollar, the lowest level since 2006.
Reuters columnist Mike Dolan says the 20-year high in dollar underweighting by asset managers indicates both wariness of US assets at large — due to concerns about the current US administration’s approach to global trade, geopolitics and institutional integrity — and a more structural dollar retreat.
He quotes Vincent Mortier, chief investment officer at Amundi, saying, “The name of the game will be diversifying away from the U.S. and into European and emerging market bonds.”
Over at U.S. Global Investors, Frank Holmes notes that UBS says the dollar is now “unattractive”.
The de-dollarization trend continues, with foreign vendors from Latin America to Asia asking US importers to settle invoices in euros, pesos and yuan to avoid USD currency swings.
Holmes confirms what was said above about more emerging-economy central banks buying gold than developed-economy CBs, and he notes that many of these nations are exploring alternatives to the dollar-based financial system which they increasingly see as a source of vulnerability rather than stability.
After the 2022 invasion of Ukraine, the US and its allies froze $335 billion of Russia’s foreign exchange reserves, which alarmed other nations. They bought and are still buying gold to prevent the same thing from happening to them.
JP Morgan notes that de-dollarization is unfolding in central bank foreign exchange reserves, where the share of USD has fallen to a two-decade low; and in fixed income, where the share of foreign ownership in the US Treasury market has declined over the last 15 years, pointing to reduced reliance on the dollar.
The bank also says de-dollarization is most visible in commodity markets, where a large and growing proportion of energy is being priced in non-dollar-denominated contracts.
Treasury demand crumbling
The US Treasury market is the largest and most liquid government securities market globally, with over $29 trillion in outstanding securities as of September 2025.
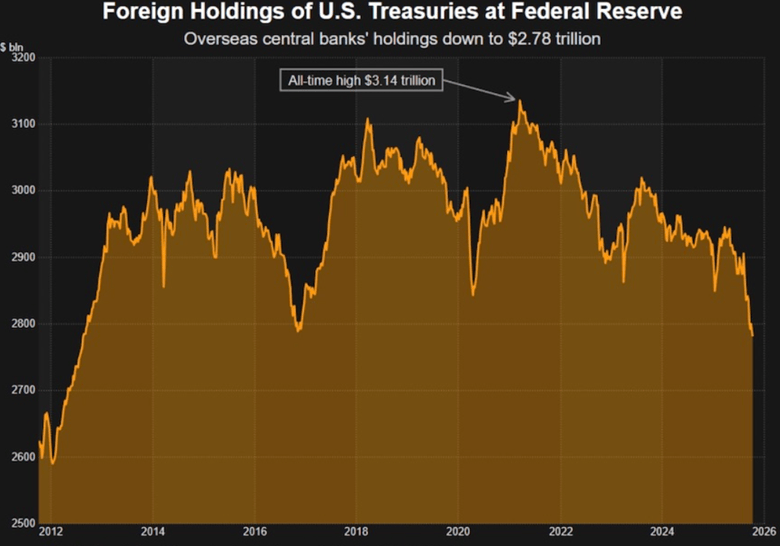
However, Reuters reported this week that The amount of U.S. Treasuries held at the New York Fed on behalf of global central banks has slumped to its lowest in over a decade, casting renewed doubt on foreign appetite for U.S. sovereign debt and other dollar-denominated assets…
The latest figures show that the value of U.S. Treasuries held at the New York Fed on behalf of foreign central banks is $2.78 trillion. That’s the lowest since August 2012, and down $130 billion in just two months.
Indeed, it’s notable that peak holdings over the last year and a half, of $2.95 trillion, were in March-April this year, coinciding with peak market volatility around U.S. President Donald Trump’s ‘Liberation Day’ tariff chaos. According to this temperature check, foreign central banks seem to have cooled on Treasuries since then.
Source: LSEG Datastream
In fact, central banks now hold more gold than US Treasuries, which hasn’t happened since 1996. Visual Capitalist notes that persistent gold buying by CBs and rising US debt risks are reshaping reserve composition towards hard assets like precious metals.
The trend is even more striking considering that nearly one-fifth of all the gold ever mined is now held by central banks.
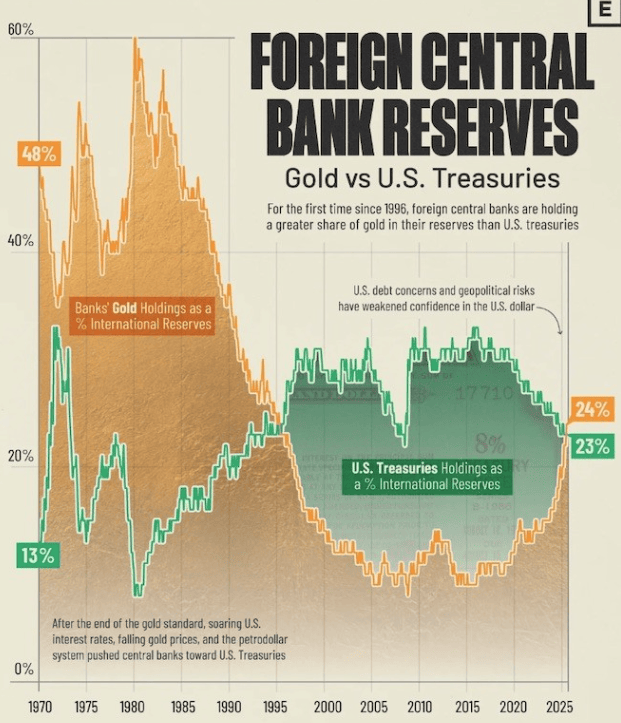
Source: Visual Capitalist
When Britain’s neophyte Prime Minister Liz Truss published a mini budget that made unfunded tax cuts and raised the amount borrowed, the bond vigilantes sold UK gilts en masse, sunk the pound and forced Truss to resign.
Could the same thing happen in the US? Well, Trump would never resign, but quite possibly, if the United States continues to rack up debt and reduce revenues through tax cuts it could.
Indeed, a US bond market crash seems inevitable. If it does, the last safe haven standing will be commodities, especially precious metals.
The bond vigilantes are holding their fire — for now — Richard Mills
Subscribe to AOTH’s free newsletter
Legal Notice / Disclaimer
Ahead of the Herd newsletter, aheadoftheherd.com, hereafter known as AOTH.
Please read the entire Disclaimer carefully before you use this website or read the newsletter. If you do not agree to all the AOTH/Richard Mills Disclaimer, do not access/read this website/newsletter/article, or any of its pages. By reading/using this AOTH/Richard Mills website/newsletter/article, and whether you actually read this Disclaimer, you are deemed to have accepted it.
Hudbay Minerals Inc. (TSX:HBM) (NYSE: HBM) today released its ann... READ MORE
Strategic acquisition of an established operating gold mine, loca... READ MORE
Cerro de Pasco Resources Inc. (TSX-V: CDPR) (OTCQB: GPPRF) (FRA: ... READ MORE
The Garneau Titanium Project Features Ilmenite-Rich Boulder with ... READ MORE
ValOre Metals Corp. (TSX‐V: VO) (OTCQB: KVLQF) (Frankfurt: KEQ0... READ MORE


