


McEwen Inc. (NYSE:MUX) (TSX: MUX) announced its fourth quarter (Q4) and full year results for the period ended December 31, 2025, along with an update on its development projects as the Company looks to increase production to 250,000 – 300,000 GEOs by 2030, while lowering costs and extending mine life across operations.
“With gold and silver trading near record highs, we reported significant Net Income and Adjusted EBITDA for Q4 and the full year 2025.
Our Q4 operating and financial performance positions us to potentially generate $80 million in free cash flow from our 100%-owned operations, and more than $50 million in dividends from our 49% ownership in the San José Mine during 2026. This strong cash flow will enable us to accelerate our plans to doub le production.
At the same time, we are advancing Los Azules, one of the world’s largest undeveloped copper deposits. We received approval to enter RIGI – Argentina’s Large Infrastructure Investment Incentive Regime, which grants us 30 years of regulatory stability, access to international arbitration in the event of disputes, a significantly lower tax rate, along with removed exchange controls. RIGI is a game changer for Argentina’s mining sector and for projects that qualify under the program.
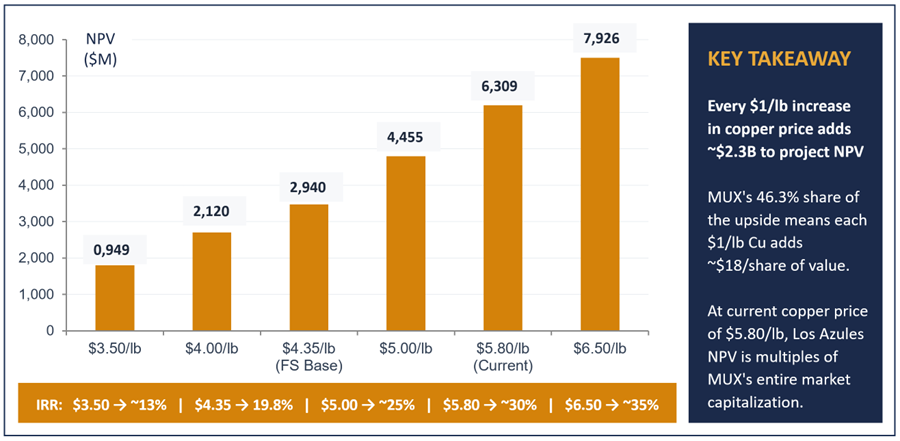
We also released a strong feasibility study at the end of last quarter that outlines a base case scenario with a 22-year project life, average copper production of 205 ktpa in the first five years, and 148 ktpa of copper cathodes over the life of the asset. Our study also highlights the potential for an additional 33 years of mine life at 141 ktpa copper production. At a copper price of $4.35 per pound (base case), Los Azules has an after-tax NPV (8%) of $2.9 billion, or approximately $23 per attributable MUX share. At $5.80 per pound, the after-tax NPV (8%) increases to $6.3 billion, or approximately $49 per share.
These results demonstrate the potential for Los Azules to become a generational copper asset. As global demand for copper accelerates with electrification and infrastructure investment, Los Azules stands out as a transformational opportunity for our shareholders and reflects our vision to build a new model for the mine of the future.
The project has been designed as a low-cost, environmentally responsible operation, with one-quarter the water consumption of a comparable conventional mine, one-tenth the carbon emissions, and the potential to operate using 100% renewable power, while eliminating the need for conventional tailings storage,” < /strong>stated Rob McEwen, CEO and Chief Owner.
McEwen is advancing the following projects:
Canada
In Canada, McEwen is forecasting that production will grow from 16,000-19,000 GEOs in 2026 to 105,000-120,000 GEOs by 2030, coming from the Fox Complex and the recently acquired Tartan Mine Project.
USA
In the USA (Nevada), McEwen is forecasting that production will grow from 39,000 – 43,000 GEOs in 2026 to 90,000 – 110,000 GEOs by 2030, coming from L ookout Mountain, Windfall and Trinity Ridge. All three deposits are located within the Gold Bar Mine Complex.
Trinity Ridge is the deposit formerly known as Unity Ridge and lies within the current Plan of Operations at Gold Bar. Mineral Resource Estimates fo r Trinity Ridge and the Windfall deposit, located to the south, are scheduled for later this year and are expected to meaningfully grow total resources.
The Company is advancing these deposits towards production to incorporate them into the Gold Bar Mine Complex mine plan, targeting a combined annual production of 90,000 to 110,000 GEOs from the three areas.
Mexico
In Mexico, McEwe n is forecasting 20,000 GEOs per year starting mid-2027.
Argentina
We released a strong feasibility study in October 2025 with headline production of 205 ktpa copper cathodes that can be directly delivered to industry, at $1.71/lb C1 cash cost and $2.11/lb AISC, and average production of 148 ktpa copper over 22 years. The study also highlights upside potential to add another 33 years of mine life with 141 ktpa of copper production, using Rio Tinto’s Nuton technology or a conventional concentrator.
Our team is continuing detailed engineering, with the aim of delivering a Final Investment Decision (FID) by end of this year, with construction targeted to begin in early 2027, subject to project financing.
Highlights of Q4 and Full Year 2025
Abbreviations used are defined in the Glossary at the end of this press release.
| Revenue | Q4 2025 revenue increased by 28% to $64.6M from the sale of 15,196 GEOs, vs revenue of $50.5M from the sale of 14,968 GEOs in Q3 2025. The average realized gold sale price per GEO was $4,436 in Q4, 28% higher than $3,477 in Q3 2025.
Full year 2025 revenues increased to $197.6M from the sale of 58,552 GEOs, compared with $174.5M from the sale of 74,911 GEOs in 2024. Our 49% ownership in the San José mine is excluded from our revenue numbers due to accounting policies under U.S. GAAP. |
|
| Profitability | Q4 2025 gross profit was $17.4M, compared with $7.8M in Q3 2025. Gross margins were positively impacted by increased production and higher gold prices. Full year 2025 gross profit was $47.6M, compared to $30.9M in 2024.
Q4 2025 net income was $38.1M or $0.70 per share, compared with a net loss of $8.2M or $0.16 per share in Q4 2024. Full year 2025 net income was $34.4M, or $0.64 per share, compared with a net loss of $43.7M, or $0.86 per share in 2024. In addition to improved gross margins, we recognized a deferred tax asset relating to the expected use of tax losses in the U.S., increasing deferred tax recoveries to $27.5M during 2025. |
|
| A djusted EBITDA | Q4 2025 adjusted EBITDA increased to $28.1M or $0.51 per share, compared with $11.8M or $0.22 per share in Q3 2025.
Full year 2025 adjusted EBITDA increased to $66.2M or $1.22 per share compared with $29.2M or $0.57 per share in 2024. Adjusted EBITDA is calculated by adding back our portion of McEwen Copper’s results to our consolidated income or loss before financing costs, depreciation, and income and mining taxes. We use adjusted EBITDA to evaluate our operating performance and ability to generate cash flow from our gold operations in production, including the San José Mine. |
|
| Liquidity & Capital Resources at December 31, 2025 | Cash and equivalents increased to $51.0M, compared with $13.7M at December 31, 2024.
The value of marketable securities increased to $21.1M, compared with $1.6M at December 31, 2024, driven by net additions of $6.6M together with $12.8M of realized and unrealized gains during 2025. Included in this total was $6.7M in Canadian Gold shares held prior to the closing of our acquisition on January 5, 2026. On December 9, 2025, the Company acquired a 27.3% interest in Paragon at a cost basis of $13.7M. As of December 31, 2025, the fair value of the investment was $17.9M. The most recent financing of McEwen Copper at $30 per share on October 24, 2024, implies a market val ue of $987.5M. Based on this valuation, McEwen’s 46.3% ownership of McEwen Copper has an implied market value of $457M or $7.69 per MUX share (based on McEwen’s shares outstanding as of the date of this press release). Since that financing, the project has seen significant development and derisking with the RIGI approval, the completion of the feasibility study, and is now preparing for a FID. Working capital increased to $44.1M, compared with negative $6.5M at December 31, 2024. Debt principal outstanding increased to $130.0M ($110.0M in convertible notes due 2030 and $20.0M under our term loan facility), compared with $40.0M debt at December 31, 2024. The reported total debt of $126.2M reflects the debt principal of $130.0M, less debt issuance costs of $3.8M, which are amortized over the life of the debt, in accordance with U.S. GAAP. McEwen had 55,517,318 shares outstandin g on December 31, 2025, compared with 53,053,654 shares on December 31, 2024. |
|
| San José Mine Performance | 18,492 GEOs were produced in Q4 and 58,120 GEOs for the full year. Strong production was the result of increased plant capacity and mining rates. Production for the full year was at the high end of the original production range.
Given the strong production in Q4, production costs per GEO sold lowered to $1,940 for cash costs and $2,201 for AISC, a decrease of 12% and 21%, respectively, compared with Q3 2025. For the full year 2025, costs per GEOs sold were $2,206 for cash costs and $2,636 for AISC, which were above guidance due to cost inflation within Argentina. |
|
| Gold Bar Performance | 8,943 GEOs were produced in Q4 and 33,227 GEOs for the full year from the Gold Bar Complex. The recently completed drilling, along with the reinterpretation of the historic holes has resulted in an improved geological model for the actual production compared with Q3 2025. Production for the quarter and the year was within the revised production guidance range.
Costs per GEO sold were $2,415 for cash costs and $2,460 for AISC in Q4. For the full year, costs were $2,014 for cash costs and $2,401 for AISC, both within the revised 2025 guidance. |
|
| Fox Complex Performance | 5,853 GEOs were produced in Q4. For the full year, production was 23,187 GEOs, below the revised guidance range of 25,000 to 28,000 GEOs. Inclement weather resulted in shutdowns on the highway to the mine and mill, as well as interruptions at the mill, which reduced production during the quarter.
Costs per GEO sold in Q4 were $2,278 for cash costs and $2,361 for AISC. For the full year, costs per GEO sold were $2,238 for cash costs and $2,506 for AISC. The annual costs were higher than our revised guidance of $2,000 to $2,100 for cash costs and $2,300 to $2,400 for AISC due to the lower production and sales profile noted above. Production and costs at the Fox Complex in Q1 2026 are currently tracking in line with guidance. |
|
| Exploration & Development | $6.3M was invested during Q4 in exploration, compared with $6.8M in Q3 2025. For the full year, we invested $22.2M in exploration across all our properties, compared with $16.5M in 2024.
$5.7M was invested by McEwen Copper in the Los Azules copper project in Q4, representing our 46.3% share of costs to complete the Feasibility Study, compared with $4.3M in Q3 2025. As a Mineral Reserve statement with an effective date of September 3, 2025 was published, eligible development costs are now capitalized and will no longer be included in McEwen’s income statement under U.S. GAAP. |
|
| Safety | Zero lost-time incidents across our 100%-owned operations. In February 2026 McEwen reached 6 years without a lost-time incident at its Gold Bar Mine Complex, marking a milestone for the team and their strong commitment to health and safety. At the Fox Complex we have reached 4 years without a lost-time incident and at El Gallo we have reached 2 years w ithout a lost-time incident. | |
| 2026 Production & Unit Costs Outlook | Full-year 2026 production guidance is 114,000 – 126,000 GEOs, including our attributable production from our 49%-owned San José mine and assuming a 77:1 silver-to-gold ratio.
Cost per ounce guidance ranges from $2,100 to $2,300 for cash costs, and from $2,400 to $2,600 for AISC. Our production profile for Gold Bar and San José remains similar to the prior year. At Fox, production guidance includes only the Froome mine and does not include early pre‑commercial production from the Stock mine, which is exp ected in mid-2026. |
|
Individual Asset Performance – Production & Costs
(See Table 3 for Q4 and full year 2025 production and costs, 2024 comparatives and 2026 guidance)
San José Mine, Argentina (49% owned)
The San José Mine had an excellent Q4 with attributable production of 18,492 GEOs, 23% up from Q3 2025. This is the highest quarterly production of 2025 and is a result of increased plant capacity and mining rates. Production costs per GEO sold were also down in Q4 with $1,940 cash costs and $2,201 AISC, which is a decrease of 12% and 21%, respectively, compared with Q3 2025. For the full year, GEO productio n was at the high end of the initial production range at 58,120 GEOs with cash costs and AISC per GEO sold being above guidance at $2,206 and $2,636, respectively.
In February 2026, McEwen received an $8.8 million dividend payment from the San José Mine for Q4. The average realized price for gold and silver by the mine during the quarter was $4,815 and $63.05 per ounce, respectively. Starting in 2026, San José’s intention is to pay out 90% of the mine’s free cash flow to the partners. With current silver and gold prices, McEwen expects this to have a meaningful impact towards funding its internal growth opportunities. At year-end, the San José Mine held a cash balance of $151.8 million on a 100% basis.
Gold Bar Mine Complex, Nevada (100% owned)
Exploration at Gold Bar
The Company is advancing three key areas at its Gold Bar Mine Complex to increase resources, extend mine life and boost annual production: 1) Lookout Mountain, 2) Windfall, and 3) Trinity Ridge, which envisions merging and enlarging several of the current open pits to access gold mineralization outside the current resource estimate areas. McEwen believes that integrating these areas into the mine plan has the potential to transform the Gold Bar Mine Complex into a long-life asset. The Company plans to release Mineral Resource Estimates for each area, with the updated estimate for Lookout Mountain shown below:
Table 1. Mineral Resource Estimate for Lookout Mountain – Open Pit Au Cut-off Grade: 0.005 oz/ton oxide and 0.050 oz/ton unoxidized
| Classification | Quantity (‘000 t) |
Gold Grade (gpt) |
Contained Gold (oz) |
| Indicated | 19,570 | 0.64 | 402,300 |
| Inferred | 7,292 | 0.57 | 134,200 |
Notes to Table 1:
Approximately 90% of the Mineral Resource Estimate at Lookout Mountain is oxide gold mineralization, that could potentially be processed using the same heap leaching methods as the Gold Bar Mine. In 2026, Lookout Mountain, Windfall and Trinity Ridge will undergo ongoing development work, including metallurgical studies and mining designs, with the objective of advancing the depos its towards a production decision. Mineral Resource Estimates for Windfall and Trinity Ridge will be completed separately and released later this year. Notably, Trinity Ridge lies within the current Plan of Operations for mining activities at the Gold Bar Mine Complex and Windfall is located on private land, which should allow for an accelerated permitting process for both areas. The combined targeted production from the three areas is of 90,000 – 110,000 GEOs per year. The Company is planning to invest approximately $10 million in exploration across the Gold Bar Mine Complex in 2026.
On January 28, 2026, McEwen announced that it had entered into a Definitive Agreement with Golden Lake Exploration Inc. whereby McEwen would acquire all issued and outstanding shares of Golden Lake by way of a plan of arrangement. If the proposed transaction is completed, Golden Lake would become a wholly owned subsidiary of McEwen. Golden Lake’ s principal assets are the 100%-owned Jewel Ridge and Jewel Ridge West projects located adjacent to McEwen’s Windfall and Lookout Mountain deposits at the Gold Bar Mine Complex.
The Company is also preparing plans to explore the northern section of the Gold Bar Mine Complex known as North Tonkin, which is located approximately four miles south of Barrick’s large, high-grade Fourmile discovery. Fourmile has an Indicated resource estimate of 2.6 million gold ounces at 17.59 gpt Au and Inferred resources of 13 million gold ounces at 16.9 gpt Au (Barrick press release dated February 5, 2026). North Tonkin lies on the intersection of the Battle Mountain Trend and the Northern Nevada Rift, with the potential for the Cortez structural corridor to extend through the property. The area has seen limited exploration, particularly at dep th. The Company’s exploration team is currently developing a plan to evaluate this portion of the property.
Fox Complex Mine, Ontario (100% owned)
Exploration at Fox
Exploration drilling at Froome West, the source of all current Fox Complex production, is ongoing. Recent drilling extended the higher-grade gold mineralization by 100 meters vertically, representing a 45% increase. These results provide confidence that additional resources exist below the currently planned mine limit, indicating the potential to extend Froome West’s mine life. This would allow the Company to feed the mill from multiple sources from H2 2026, in addition to the Stock Mine, which is currently under development.
Highlights from recently released drilling at Froome include (TW = true widths, press release dated December 4, 2025):
On January 20, 2026, the Company released the results from its updated Grey Fox Mineral Resource Estimate that now totals 1,892,000 Indicated gold ounces (19,474,000 tonnes @ 3.02 gpt Au) and 436,000 Inferred gold ounces (5,101,000 tonnes @ 2.66 gpt Au), calculated using a gold price of US$3,000 per ounce. This updated resource model will form the basis of the Grey Fox pre-feasibility study (“PFS”) that will be published in Q2 2026.
The team at McEwen has identified two areas at Grey Fox where underground mining could be accelerated: 1) Gibson Zone, located near existing underground infrastructure, and 2) Whiskey Jack, which contains higher-grade gold areas.
The Gibson Zone is near existing underground infrastructure, including a portal and ramp from surface, and contains Indicated Resources of 393,000 gold ounces (4.5 million tonnes @ 2. 72 gpt Au) and Inferred Resources of 297,000 gold ounces (3.6 million tonnes @ 2.59 gpt Au).
Highlights from the 2025 drilling campaign at Gibson include (TW = true widths, press releases dated May 7, 2025, and September 2, 2025):
Whiskey Jack, while smaller, is the highest-grade zone at Grey Fox and contains Indicated Resources of 122,000 gold ounces (735,000 tonnes @ 5.16 gpt Au) and Inferred Resources of 5,000 gold ounces (27,000 tonnes @ 5.84 gpt Au).
Both zones present oppo rtunities for accelerated mining and high returns on capital. The Company will be detailing these opportunities in its upcoming PFS.
Development at Fox – Stock Mine
Development work at Stock continues on schedule and within budget, with $29.5 million invested during 2025. The new ramp will connect the West and the East zones to the existing historical underground mine. Stock is expected to begin initial production by mid-2026, with commercial production starting in 2027. The advantages of mining at Stock compared to Froome include 1) reduced royalty burden, 2) softer material, leading to higher mill throughput, and 3) lower hauling cost due to its proximity to the mill. Additional upside is being evaluated in the historically mined Stock Main zone as development progresses through this area.
The Company is targeting annual production from Grey Fox and Stock of approximately 75,000 – 90,000 GEOs per year once in full production.
Individual Asset Performance – Project Updates
El Gallo, Mexico (100% owned)
At El Gallo, we anticipate beginning construction mid-2026 with production commencing mid-2027. Final engineering for the mill, which has been purchased and is onsite, is well advanced.
Phase 1 is expected to operate for 10 years, producing approximately 20,000 GEOs annually once commercial production is achieved. Production will come from the reprocessing of the material currently on the leach pad, through a ball mill and recovery circuit. Remaining capital costs to complete construction are estimated at $25 million. Since the material to be processed has been previously mined, no significant development or exploration costs are anticipated during Phase 1.
The Company has also started work o n Phase 2, which will involve production from El Gallo’s silver deposits. This would extend the life well beyond the 10 years contemplated under Phase 1 and increase production to 40,000 – 50,000 GEOs (based on a 77:1 silver-to-gold ratio) due to higher grades.
For the El Gallo and district satellite deposits, historical silver resources total 53.1 million silver ounces in the Measured and Indicated categories and 31 million silver ounces in the Inferred category for areas that have not currently been mined (El Gallo Complex Phase II Project, NI 43-101 Technical Report Feasibility Study, September 10, 2012). Resources were calculated using a silver price of $28.50 per ounce and a gold price between $950 and $1,500 per ounce. This estimate is historical in nature; a qualified person has not done sufficient work to classify the historical estimate as curre nt mineral resources and should therefore not be relied on or considered as current. The Company will be updating the resource estimates for El Gallo in 2026, based on the currently known resource areas.
Tartan Mine Project, Manitoba (100% Owned)
A Mineral Resource Estimate for the Tartan Mine Project that is nearing completion is expected to be released by the end of March and will serve as the first key milestone towards restarting the mine. The Company is reviewing how it can best utilize the existing licenses and infrastructure at Tartan to shorten the time to production and incorporate future expansion possibilities. The initial production target of 30,000 GEOs per year has the potential to increase through further permit modifications and expanding the proposed mill and process plant.
Since the Mineral Resource Estimate cut-off date (December 31, 2025) one drill has been working con tinuously at the project. A second drill planned to arrive in Q2 will initially focus on collecting mineralized samples for metallurgical test work, before transitioning to exploration drilling. The Company anticipates operating two drills for the remainder of 2026 and increasing the exploration budget to $6 million from the initial $3 million.
Highlights from recently released drilling include (CW = core width, press release dated January 13, 2026):
Regional exploration is scheduled to begin in Q2, along the prominent Tartan shear zone that is host to the majority of gold mineralization in the area, in order to refine potential drill targets. The focus will be to follow-up on encouraging grab and channel samples taken in 2025 with the objective of identifying additional resources that can leverage the current and proposed Tartan infrastructure.
McEwen Copper – Los Azules Copper Project, Argentina (46.3% Ownership and 1.25% NSR by McEwen)
The approval of the RIGI application marks a major milestone for Los Azules, granting significant tax, legal, and regulatory benefits in Argentina.
Under RIGI, Los Azules benefits from 30 years of legal, fiscal, and customs stability, providing a predictable framework and strong protection against future regulatory changes. Key incentives include a reduced corporate income tax rate of 25% (down from 35%), a 50% reduction in dividend withholding tax, accelerated depreciation for new investments, release of VAT payments during construction, and exemption from export duties at the start of exports. The regime also allows the project to retain export proceeds offshore, providing effective foreign exchange stability.
Table 2. Los Azules After-Tax Economics – Base Case vs. Current Copper Prices
| Feasibility Study Base Case $4.35/lb Copper |
Current Scenario (March 2026) $5.80/lb Copper |
|
| NPV (8%) | $2.940 Billion | $6.309 Billion |
| IRR | 19.8% | 30% |
| Payback | 3.9 Years | 2.7 Years |
| NPV/CAPEX | 0.93x | 2.0x |
Fig. 1 Los Azules Project Financial Sensitivity – NPV and IRR
International Finance Corporation, a member of the World Bank Group, and McEwen Copper signed a collaboration agreement to align the Los Azules project with IFC’s environmental, social and governance standards for future potential debt and equity financing. The agreement also provides IFC with customary rights for IFC to act, at its sole discretion, as lender and/or arranger for prospective project debt financing. These rights are non-exclusive and do not constitute a commitment to provide financing; any IFC financing would remai n subject to satisfactory due diligence, internal approvals and execution of definitive documentation.
This affiliation marks a significant milestone in the project’s responsible development strategy, as it strengthens the integration of environmental, social, and governance principles, aligning the company’s actions with the United Nations’ 2030 Agenda and its Sustainable Development Goals.
*Launched by the United Nations in 2000, it is a voluntary framework that encourages businesses and organizations worldwide to align their strategies and operations with ten universally accepted principles in the areas of human rig hts, labor, environment, and anti-corruption. (See: https://unglobalcompact.org/)
Table 3. Q4 & 12M 2025 Production and Costs1, Comparatives from Q4 & 12M 2024 and 2026 Annual Guidance
| Q4 | 12M | Full Year 2026 Guidance |
|||
| 2025 | 2024 | 2025 | 2024 | ||
| Consolidated Production | |||||
| GEOs(2) (3) | 34,341 | 32,403 | 115,687 | 135,884 | 114,000 – 126,000 |
| Gold Bar Mine Complex, Nevada | &nb sp; | ||||
| GEOs | 8,943 | 6,927 | 33,227 | 44,581 | 39,000 – 43,000 |
| Cash Costs/GEO | $2,415 | $2,136 | $2,014 | $1,425 | $2,250 – $2,450 |
| AISC/GEO | $2,460 | $2 ,773 | $2,401 | $1,677 | $2,350 – $2,550 |
| Fox Complex, Canada | |||||
| GEOs | 5,853 | 6,514 | 23,187 | 30,151 | 16,000 – 19,000 |
| Cash Costs/GEO | $2,278 | $1,874 | $2,238 | $1,642 | $2,200 – $2,400 |
| AISC/GEO | $2,361 | $2,240 | $2,506 | $1,980 | $2,650 –$2,850 |
| San José Mine, Argentina (49%)(4) | |||||
| GEOs | 18,492< /td> | 18,810 | 58,120 | 60,100 | 59,000 – 64,000 |
| Cash Costs/GEO | $1,940 | $1,635 | $2,206 | $1,742 | $2,000 – $2,200 |
| AISC/GEO | $2,201 | $2,038 | $2,636 | $2,139 | $2,300 – $2,500 |
Notes to Table 3:
Glossary of Terms and Abbreviations
| Au AISC B CW ft FS GEO gpt H1 H2 m |
– gold – all-in sustaining costs – billion – core width – foot – feasibility study – gold equivalent ounce – grams per tonne – first half of the year (January 1 – June 30) – second half of the year (July 1 – December 31) – meter |
M oz PFS Q1 Q2 Q3 Q4 t tpd tpa TW |
– million – troy ounce – pre-feasibility study – first quarter (January 1 – March 31) – second quarter (April 1 – June 30) – third quarter (July 1 – September 30) – fourth quarter (October 1 – December 31) – tonne – tonnes per day – tonnes per annum – true width |
| McEWEN INC. CONSOLIDATED STATEMENTS OF OPERATIONS AND COMPREHENSIVE INCOME (LOSS) FOR THE YEARS ENDED DECEMBER 31, 2023, 2024 and 202 (unaudited, in thousands of U.S. dollars, except per share amounts) |
||||||||||||
| December 31, 2025 |
December 31, 2024 |
December 31, 2023 | ||||||||||
| Revenue from gold and silver sales | $ | 197,553 | $ | 174,477 | $ | 166,231 | ||||||
| Production costs applicable to sales | (122,760 | ) | (113,313 | ) | (119,230 | ) | ||||||
| Depreciation and depletion | (27,229 | ) | (30,229 | ) | (29,221 | ) | ||||||
| Gross profit | 47,564 | 30,935 | 17,780 | |||||||||
| OTHER OPERATING INCOME (EXPENSES): | ||||||||||||
| Advanced projects | (7,961 | ) | (7,152 | ) | (82,637 | ) | ||||||
| Exploration | (22,196 | ) | (16,546 | ) | (20,167 | ) | ||||||
| General and administrative | (26,695 | ) | (17, 165 | ) | (15,449 | ) | ||||||
| Loss from investment in McEwen Copper Inc. | (25,547 | ) | (46,977 | ) | (57,821 | ) | ||||||
| Income from investment in Minera Santa Cruz S.A. | 41,125 | 9,021 | < td style=”text-align: left ; vertical-align: middle; vertical-align: bottom ; “>
62 |
|||||||||
| Depreciation | (620 | ) | (634 | ) | (1,138 | ) | ||||||
| Reclamation and remediation | (3,017 | ) | (2,054 | ) | (2,693 | ) | ||||||
| (44,911 | ) | (81,507 | ) | (179,843 | )< /td> | |||||||
| Operating income (loss) | 2,653 | (50,572 | ) | (162,063 | ) | |||||||
| OTHER INCOME (EXPENSES): | ||||||||||||
| Interest and other finance (expenses) income, net | (7,217 | ) | (4,595 | ) | 36,918 | |||||||
| Other income (expenses) | 10,724 | 2,651 | & nbsp; | (29,976 | ) | |||||||
| Dilution gain from investments in McEwen Copper Inc. | 789 | 5,777 | — | |||||||||
| Gain on deconsolidation of McEwen Copper Inc. | — | — | 222,157 | |||||||||
| Total other income | 4 ,296 | 3,833 | 229,099 | |||||||||
| Income (loss) before income and mining taxes | 6,949 | (46,739 | ) | 67,036 | ||||||||
| Income and mining tax recovery (expense) | 27,485 | 3,048 | (33,859 | ) | ||||||||
| Net income (loss) after income and mining taxes | 34,434 | (43,691 | ) | 33,177 | ||||||||
| Net loss attributable to non-controlling interests | &n bsp; | — | — | 22,122 | ||||||||
| Net income (loss) and comprehensive income (loss) attributable to McEwen shareholders | $ | 34,434 | $ | (43,691 | ) | $ | 55,299 | |||||
| Net income (loss) per share: | ||||||||||||
| Basic | $ | 0.64 | $ | (0.86 | ) | $ | 1.16 | |||||
| Diluted | $ | 0.59 | $ | (0.86 | ) | $ | 1.16 | |||||
| Weighted average common shares outstanding (thousands): | ||||||||||||
| Basic | 54,046 | 51,021 | 47,544 | |||||||||
| Diluted | 65,498 | 51,021 | 47,544 | |||||||||
| McEWEN INC. CONSOLIDATED BALANCE SHEETS AS AT DECEMBER 31, 2024 and 2025 (unaudited, in thousands of U.S. dollars) |
||||||||
| December 31, | December 31, | |||||||
| 2025 | 2024 | |||||||
| ASSETS | ||||||||
| Current assets: | ||||||||
| Cash and cash equivalents | $ | 51,015 | $ | 13,692 | ||||
| Marketable securities | 21,114 | 1,617 | ||||||
| Receivables, prepaids and other current assets | 5,752 | 7,486 | ||||||
| Due from McEwen Copper Inc. | 3,169 | 286 | ||||||
| Inventories | 26,836 | 18,111 | ||||||
| Total current assets | 107,886 | 41,192 | ||||||
| Mineral property interests and plant and equipment, net | 227,208 | 210,922 | ||||||
| Equity method investments | 428,641 | 400,801 | ||||||
| Due from McEwen Copper Inc. | 6,052 | — | ||||||
| Deferred tax assets | 25,591 | — | ||||||
| Inventories | 20,560 | 7,834 | ||||||
| Restricted cash | 4,246 | 3,772 | ||||||
| Other assets | 34 | 102 | ||||||
| TOTAL ASSETS | $ | 820,218 | $ | 664,623 | ||||
| LIABILITIES & SHAREHOLDERS’ EQUITY | ||||||||
| Current liabilities: | ||||||||
| Accounts payable and accrued liabilities | $ | 44,911 | $ | 28,448 | ||||
| Reclamation and remediation liabilities | 6,473 | 4,988 | ||||||
| Contract liability | 7,549 | 3,544 | ||||||
| Flow-through share premium | 974 | 5,447 | ||||||
| Tax liabilities | 2,976 | 4,478 | ||||||
| Lease liabilities | 926 | 788 | ||||||
| Total current liabilities | 63,809 | 47,693 | ||||||
| Long-term debt, net of issuance costs | 126,168 | 40,000 | ||||||
| Reclamation and remediation liabilities | 39,384 | 41,075 | ||||||
| Deferred tax liabilities | 40,328 | 36,630 | ||||||
| Lease liabilities | 1,088 | 1,323 | ||||||
| Other liabilities | 3,204 | 2,927 | ||||||
| Total liabilities | $ | 273,981 | $ | 169,648 | ||||
| Shareholders’ equity: | ||||||||
| Common shares: 55,517 as at December 31, 2025, and 53,054 as at December 31, 2024 issued and outstanding (in thousands) | $ | 1,821,530 | $ | 1,804,702 | ||||
| Accumulated deficit | (1,275,293 | ) | (1,309,727 | ) | ||||
| Total shareholders’ equity | 546,237 | 494,975 | ||||||
| TOTAL LIABILITIES & SHAREHOLDERS’ EQUITY | $ | 820,218 | $ | 664,623 | ||||
| McEWEN INC. CONSOLIDATED STATEMENTS OF CHANGES IN SHAREHOLDERS’ EQUITY FOR THE YEARS ENDED DECEMBER 31, 2022 to 2025 (unaudited, in thousands of U.S. dollars and shares) |
||||||||||||||||||
| Common Shares | ||||||||||||||||||
| and Additional | ||||||||||||||||||
| Paid-in Capital | Accumulated | Non-controlling | ||||||||||||||||
| Shares | Amount | Deficit | Interests | Total | ||||||||||||||
| Balance, December 31, 2022 | 47,428 | $ | 1,644,144 | $ | (1,321,335 | ) | $ | 33,465 | $ | 356,274 | ||||||||
| Stock-based compensation | 66 | 605 | — | — | 605 | |||||||||||||
| Restricted shares issued | 43 | 366 | — | — | 366 | |||||||||||||
| Proceeds from McEwen Copper Inc. financing | — | 109,913 | — | 75,477 | 185,390 | |||||||||||||
| Sale of flow-through shares | 1,903 | 13,428 | — | — | 13,428 | |||||||||||||
| Net loss and comprehensive loss | — | — | 55,299 | (22,122 | ) | 33,177 | ||||||||||||
| McEwen Copper Inc. deconsolidation | — | — | — |
(86,820 |
) | (86,820 | ) | |||||||||||
| Balance, December 31, 2023 | 49,440 | $ | 1,768,456 | $ | (1,266,036 | ) | $ | — | $ | 502,420 | ||||||||
| Stock-based compensation | 241 | 3,244 | — | — | 3,244 | |||||||||||||
| Exercise of warrants | 1 | 9 | — | — | 9 | |||||||||||||
| Sale of flow-through shares | 1,533 | 14,374 | — | — | 14,374 | |||||||||||||
| Shares issued to acquire Timberline Resources Corporation | 1,839 | 17,706 | — | — | 17,706 | < td style=”padding-left: 0 ; text-align: left ; vertical-align: middle; vertical-align: bottom ; “> | ||||||||||||
| Warrants assumed in acquisition of Timberline Resources Corporation | — | 913 | — | — | 913 | |||||||||||||
| Net loss and comprehensive loss | — | — | (43,691 | ) | — | (43,691 | ) | |||||||||||
| Balance, December 31, 2024 | 53,054 | $ | 1,804,702 | $ | (1,309,727 | ) | $ | — | $ | 494,975 | ||||||||
| Stock-based compensation | 533 | 7,251 | — | — | 7,251 | |||||||||||||
| Exercise of warrants | 85 | 610 | — | — | 610 | |||||||||||||
| Investment in Goliath Resources Limited | 868 | 6,068 | —< /td> | — | 6,068 | |||||||||||||
| Investment in Paragon Advanced Labs Inc. | 709 | 13,719 | — | — | 13,719 | |||||||||||||
| Purchase of capped call options | — | (15,114 | ) | — | — | (15,114 | ) | |||||||||||
| Shares issued for debt refinancing | 53 | 400 | — | — | 400 | |||||||||||||
| Sale of flow-through shares | 215 | 3,894 | — | — | 3,894 | |||||||||||||
| Net income and comprehensive income | — | — | 34,434 | — | 34,434 | |||||||||||||
| Balance, December 31, 2025 | 55,517 | $ | 1,821,530 | $ | (1,275,293 | ) | $ | — | $ | 546,237 | ||||||||
| McEWEN INC. CONSOLIDATED STATEMENTS OF CASH FLOWS FOR THE YEARS ENDED DECEMBER 31, 2023, 2024, and 2025 (unaudited, in thousands of U.S. dollars) |
||||||||||||
| Year ended December 31, | ||||||||||||
| 2025 | 2024 | 2023 | ||||||||||
| Cash flows from operating activities: | ||||||||||||
| Net income (loss) | $ | 34,434 | $ | (43,69 1 | ) | $ | 33,177 | |||||
| Adjustments to reconcile net loss from operating activities: | ||||||||||||
| Loss from investment in McEwen Copper Inc. | 25,547 | 46,977 | 57,821 | |||||||||
| Income from investment in Minera Santa Cruz S.A. | (41,125 | ) | (9,021 | ) | (62 | ) | ||||||
| Depreciation, amortization and depletion | 27,849 | 30,863 | 30,359 | |||||||||
| Gain on marketable securities | (12,849 | ) | (286 | ) | (10,684 | ) | ||||||
| Foreign exchange (gain) loss | (235 | ) | 656 | 48,977 | ||||||||
| Reclamation accretion and adjustments to estimate | 3,861 | 864 | 2,693 | |||||||||
| Income and mining tax (recovery) expense | (22,291 | ) | &nbs p; | (6,976 | ) | 37,018 | ||||||
| Flow through premium amortization | (5,649 | ) | (2,304 | ) | (4,045 | ) | ||||||
| Stock-based compensation | 3,713 | 3,244 | 971 | |||||||||
| Dilution gain from investments in McEwen Copper Inc. | (789 | ) | (5,777 | ) | — | |||||||
| Gain on deconsolidation o f McEwen Copper Inc. | — | — | (222,157 | ) | ||||||||
| Amortization of debt issuance costs | 697 | — | — | |||||||||
| Other | 437 | 349 | — | |||||||||
| Changes in non-cash working capital items: | ||||||||||||
| Change in inventories | (18,901 | ) | (711 | ) | 4,554 | |||||||
| Change in other assets related to operations | (2,077 | ) | 3,067 | (81 | ) | |||||||
| Change in accounts payable and accrued liabilities | 13,726 | 5,792 | (19,865 | ) | ||||||||
| Change in contract liability | 4,005 | 3,543 | (6,151 | ) | ||||||||
| Change in other liabilities related to operations | (2,778 | ) | 2,865 | &nbs p; | 7,838 | |||||||
| Cash provided by (used in) operating activities | $ | 7,575 | $ | 29,454 | $ | (39,637 | ) | |||||
| Cash flows from investing activities: | ||||||||||||
| Additions to mineral property interests and plant and equipment | $ | (45,349 | ) | $ | (43,095 | ) | $ | (26,099 | ) | |||
| Advances to related parties – McEwen Copper Inc. | (5,056 | ) | — | — | ||||||||
| Investment in marketable securities | (2,154 | ) | (366 | ) | (34,157 | ) | ||||||
| Dividends received from Minera Santa Cruz S.A. | 2,246 | — | — | |||||||||
| Proceeds from sale of marketable securities | 1,574 | — | — | |||||||||
| Investment in McEwen Copper Inc. | — | (14,000 | ) | — | ||||||||
| Proceeds from sale of investment in McEwen Copper Inc. | — | — | 6,032 | |||||||||
| Cash outflow on McEwen Copper Inc. deconsolidation | — | — | (45,708 | ) | ||||||||
| Notes receivable from Timberline | — | (1,880 | ) | — | ||||||||
| Cash and restricted cash received from acquisition of Timberline | — | 1,131 | — | |||||||||
| Other | — | 164 | 295 | |||||||||
| Cash used in investing activities | $ | (48,739 | ) | $ | (58,046 | ) | $ | (99,637 | ) | |||
| Cash flows from financing activities: | &nb sp; | |||||||||||
| Proceeds from senior convertible notes | 110,000 | — | — | |||||||||
| Purchase of capped call options | (15,114 | ) | — | — | ||||||||
| Convertible notes financing costs | (4,123 | ) | — | — | ||||||||
| Principal repayment on long-term debt | (20,000 | ) | — | (25,000 | ) | |||||||
| Issuance of flow-through common shares, net of issuance costs | 4,868 | 20,424 | 13,428 | |||||||||
| Proceeds from McEwen Copper Inc. financing | — | — | 185,390 | |||||||||
| Proceeds from exercise of stock options | 3,538 | — | — | |||||||||
| Proceeds from exercise of warrants | 610 | 9 | — | |||||||||
| Payment of finance lease obligations | (1,053 | ) | (1,231 | ) | (1,636 | ) | ||||||
| Cash provided by financing activities | $ | 78,726 | $ | 19,202 | $ | 172,182 | ||||||
| Effect of exchange rate change on cash and cash equivalents | 235 | (656 | ) | (48,977 | ) | |||||||
| Increase in cash, cash equivalents and restricted cash | 37,797 | (10,046 | ) | (16,069 | ) | |||||||
| Cash, cash equivalents and restricted cash, beginning of period | 17, 464 | 27,510 | 43,579 | |||||||||
| Cash, cash equivalents and restricted cash, end of period | $ | 55,261 | $ | 17,464 | $ | 27,510 | ||||||
| Supplemental disclosure of cash flow information: | ||||||||||||
| Cash received (paid) during the period: | ||||||||||||
| Interest paid | $ | (5,067 | ) | $ | (3,911 | ) | $ | (4,728 | ) | |||
| Interest received | 1,126 | 636 | 34,680 | |||||||||
| Taxes paid | (1,977 | ) | (712 | ) | (1,410 | ) | ||||||
| Non-cash investing activities: | ||||||||||||
| Mineral property additions in accounts payable and accrued liabilities | (2,738 | ) | — | — | ||||||||
ABOUT MCEWEN
McEwen shares trade on both the NYSE and TSX under the ticker MUX.
McEwen provides its shareholders with exposure to a growing base of gold and silver production in addition to a very large copper development project, all in the Americas. The gold and s ilver mines are in prolific mineral-rich regions of the world, the Cortez Trend in Nevada, USA, the Timmins district of Ontario and Flin Flon in Manitoba, Canada, and the Deseado Massif in Santa Cruz province, Argentina. McEwen is also reactivating its gold and silver El Gallo Mine in Mexico.
The Company has a 46.3% interest in McEwen Copper, which owns the large, long-life, advanced-stage Los Azules copper development project in San Juan province, Argentina – a region that hosts some of the country’s largest copper deposits. According to the last financing for McEwen Copper, the implied value of McEwen’s ownership interest is US$456 million.
The Los Azules copper project is designed to be one of the world’s first regenerative copper mines and carbon neutral by 2038. Its Feasibility Study results were announced in the press release dated October 7, 2025.
McEwen also recently purchased 27.3% of Paragon Advanced Labs Inc., a newly listed public company that is deploying PhotonAssay™ units around the world, a technology that the Company believes is poised to become the new industry standard for assaying precious and base metals, with Paragon aiming to be one of the leading service providers.
Chairman and Chief Owner Rob McEwen has invested over US$200 million personally and takes a salary of $1 per year, aligning his interests with shareholders. He is a recipient of the Order of Canada, a member of the Canadian Mining Hall of Fame and a winner of the EY Entrepreneur of the Year (Energy) award. His objective is to build MUX’s profitability, share value, and ultimately implement a dividend policy, as he did while building Goldcorp Inc.
SLAM Exploration Ltd. (TSX-V: SXL) is pleased to report that it h... READ MORE
First Quantum Minerals Ltd. (TSX: FM) announces that it has enter... READ MORE
Summit Royalties Ltd. (TSX-V: SUM) (OTCQB: SUMMF) is pleased to a... READ MORE
Proven and Probable Mineral Reserves total 6.52 Moz of gold at an... READ MORE


