


Pelangio Exploration Inc. (TSX-V: PX) (OTC PINK: PGXPF) is pleased to announce the results of an updated, independent, Mineral Resource Estimate for the Company’s 100% owned Manfo Gold Project in Ghana. The Resource was completed by SEMS Technical Services Ltd. of Ghana.
The Resource, with an effective date of July 31, 2025, is reported for four gold deposits using constraining optimized pits at a gold price of US$2,600 per ounce, and:
The August 2025 Resource (refer to Table 1) uses the 2013 deposit models for the Manfo gold project generated by SRK Consulting (Canada) Inc., updated to include drilling conducted by Pelangio since 2013. A new model was created for the Nkansu deposit, which was largely drilled after the 2013 Maiden Resource, adding a fourth deposit to the Manfo total Resource. The updated Resource reflects the significantly increased gold price since 2013 using US$2,600 per ounce gold for the economic pit optimizations as compared to US$1,450 used in 2013 and utilizes lower gold grade cut-off values justified by the current gold price. In addition to the gold price, the other parameters for the economic pit optimization, including costs, pit slopes and recoveries were reviewed and updated as appropriate to reflect current economic conditions. The 2025 updated Resource has returned substantially more pit-constrained gold mineralization than the 2013 resource estimate defined, although at lower average gold grades. Refer to the detailed discussion below.
The Company intends to file a technical report in respect of the Resource within 45 days and will issue an additional news release at that time.
“The updated Manfo resource estimate demonstrates a substantial increase in both tonnage and contained gold, with a notable improvement in the confidence of the Indicated category. The integration of new drilling data and the addition of the Nkosuo mining lease have materially enhanced the project’s scale and potential. Our focus now shifts to targeted infill drilling, step-out drilling and exploration on both Manfo and Nkosuo to further define and expand the resource base, while advancing technical studies to support future development decisions,” remarked Ingrid Hibbard, President and CEO.
Table 1. Mineral Resource Statement for the Manfo Gold Project (July 31, 2025)
| Classification | Indicated | Inferred | |||||
| Category | Cut-off Grade (g/t Au) |
Quantity (000′ tonnes) |
Grade (g/t Au) |
Cont. Gold (000′ oz) |
Quantity (000′ tonnes) |
Grade (g/t Au) |
Cont. Gold (000′ oz) |
| Oxide | 0.25 | 55 | 1.30 | 2 | 1,024 | 0.69 | 23 |
| Transition | 0.35 | 458 | 1.70 | 25 | 2,017 | 0.79 | 51 |
| Fresh | 0.35 | 11,274 | 1.14 | 414 | 13,007 | 0.77 | 322 |
| Totals | 11,787 | 1.16 | 441 | 16,048 | 0.77 | 396 | |
Notes:
Table 2. Assumptions for Conceptual Open Pit Optimization for the Manfo Gold Project
| Parameter | Unit | Optimization Assumptions |
| Gold price | $/oz | $2600 |
| G&A cost | $/t ore | $6 |
| Treatment cost: oxide / transition + fresh | $/t ore | $11 / $17 |
| Metallurgical recovery: oxide / transition + fresh | % | 94 / 90 |
| Average mining cost: oxide / transition + fresh | $/t mined | $2.20 / $3.10 |
| Slope angles: oxide + transition / fresh | degrees | 40 / 54 |
| Mining dilution / recovery | % | 0 / 100 |
2025 Mineral Resource Estimation Details:
An updated Mineral Resource Estimate was completed for the Manfo gold project in August of 2025. Gold mineralization at Manfo occurs in 8 prospects along a 9-kilometer-long structural corridor in a granodiorite intrusive, three of which were drilled to a resource status and were included within the Maiden Resource estimate for Manfo released in 2013. The gold mineralization is hosted in brittle-ductile shears and brecciation cutting through the granodiorite with progressive chlorite-hematite-carbonate-sericite-silica alteration with quartz veining and pyrite. The chlorite-hematite altered zones are generally low in gold grade (<0.5 g/t Au) while the sericite-silica altered zones with more abundant quartz veining and pyrite can be high in gold grade (>5 g/t Au).
The August 2025 Resource updates the 2013 maiden resource estimate to reflect the increase in gold price since 2013 and incorporates drilling conducted by Pelangio after 2013. A fourth deposit, Nkansu, largely drilled post-2013, has been added to the total resource. Figure 1 shows the relative locations of the four deposits. The drilling used to estimate the Resource for the four deposits totals 38,070 meters in 202 holes including 35,930 meters of diamond drilling in 175 holes plus 2,140 meters of reverse circulation drilling in 27 holes. SEMS Technical Services updated the original grade block models created in 2013 by SRK Consulting (Canada) Inc. for the Pokukrom East and West deposits to account for post-2013 drilling, a new model was created for the Nkansu deposit, and the Nfante West model remains unchanged since 2013. SEMS used Datamine™ software to review and update the mineral resource estimation domains, prepare assay data for geostatistical analysis, construct the block models, estimate metal grades, and tabulate mineral resources. Mineral resource estimation consisted of standard geostatistical techniques of variography and ordinary kriging applied to wireframe models of mineralization and lithological alteration zones as defined by the interpreted resource domains. To demonstrate “reasonable prospects for eventual economic extraction” based upon open pit mining methods and conventional treatment processes, pit optimization techniques were used to generate conceptual pit shells ensuring that appropriate assumptions for the relevant technical and economic factors were considered in the determination of the stated Resource. The assumptions used for the 2025 updated resource estimation, which include gold price, operating costs, metallurgical recovery and pit slopes, are listed in Table 2. The cut-off grades were derived from these assumptions. The gold cut-off grades were decreased from 2013 with 0.25 g/t Au for the oxides and 0.35 g/t Au for the transitional and fresh resource material (the majority of the resource) used in the 2025 Resource estimation versus 0.40 g/t Au for oxides and 0.50 g/t Au for transitional and fresh used in 2013.
The total Resource for the Manfo project is listed in Table 1 and the resource estimation for the four individual deposits is listed in Table 3. The Pokukrom East deposit is the largest by far of the four deposits and accounts for 91% of the total Indicated resource with 402,000 ounces of gold based on 11,313,000 tonnes averaging 1.11 g/t Au plus 65% of the total Inferred resource with 258,000 ounces of gold based on 10,878,000 tonnes averaging 0.74 g/t Au. The Pokukrom West deposit, while relatively small with 39,000 ounces of Indicated gold plus 23,000 ounces of Inferred gold is the highest grade of the four deposits averaging 2.54 g/t Au for the Indicated category. The Nfante West and Nkansu deposit resources are entirely Inferred currently due to their wider spaced drilling and lower demonstrated grade continuity between drillholes. Most of the resource is in fresh rock comprising 94% of the total Indicated resource plus 81% of the total Inferred resource. Refer to Table 3.
SEMS also determined the sensitivity of a range of gold cut-off grades on the block model gold content constrained by the optimized pit shells as listed in Table 4. At a very low cut-off grade of 0.10 g/t Au the total (oxide+ transitional + fresh) Indicated gold content is estimated to be 12,142,000 tonnes averaging 1.14 g/t Au for 444,000 ounces gold plus 39,071,000 tonnes averaging 0.43 g/t Au for 535,000 ounces gold in the Inferred category for the four deposits combined. At a higher cut-off grade of 0.50 g/t Au, as was used in 2013 for the transitional and fresh resource material, the total Indicated gold content is 9,834,000 tonnes averaging 1.31 g/t Au for 413,000 ounces of gold plus 10,214,000 tonnes averaging 0.97 g/t Au for 320,000 ounces gold in the Inferred category.
Table 3. Mineral Resource by Zone for the Manfo Gold Project
| Classification | Indicated | Inferred | ||||||
| Deposit | Category | Cut-off Grade (g/t Au) |
Quantity (000′ tonnes) |
Grade (g/t Au) |
Contained Gold (000′ oz) |
Quantity (000′ tonnes) |
Grade (g/t Au) |
Contained Gold (000′ oz) |
| Pokukrom East |
Oxide | 0.25 | 41 | 0.69 | 1 | 474 | 0.65 | 10 |
| Transition | 0.35 | 302 | 1.06 | 10 | 922 | 0.79 | 23 | |
| Fresh | 0.35 | 10,970 | 1.11 | 391 | 9,482 | 0.74 | 225 | |
| Sub-total | 11,313 | 1.11 | 402 | 10,878 | 0.74 | 258 | ||
| Pokukrom West |
Oxide | 0.25 | 14 | 3.06 | 1 | 43 | 2.05 | 3 |
| Transition | 0.35 | 156 | 2.95 | 15 | 136 | 1.27 | 6 | |
| Fresh | 0.35 | 304 | 2.31 | 23 | 237 | 1.96 | 15 | |
| Sub-total | 474 | 2.54 | 39 | 417 | 1.75 | 23 | ||
| Nfante West |
Oxide | 0.25 | 355 | 0.67 | 8 | |||
| Transition | 0.35 | 675 | 0.77 | 17 | ||||
| Fresh | 0.35 | 1,612 | 0.75 | 39 | ||||
| Sub-total | 2,642 | 0.74 | 63 | |||||
| Nkansu | Oxide | 0.25 | 152 | 0.49 | 2 | |||
| Transition | 0.35 | 284 | 0.60 | 5 | ||||
| Fresh | 0.35 | 1,676 | 0.81 | 43 | ||||
| Sub-total | 2,111 | 0.76 | 51 | |||||
| Totals | Oxide | 0.25 | 55 | 1.30 | 2 | 1,024 | 0.69 | 23 |
| Transition | 0.35 | 458 | 1.70 | 25 | 2,017 | 0.79 | 51 | |
| Fresh | 0.35 | 11,274 | 1.14 | 414 | 13,007 | 0.77 | 322 | |
| Grand Total | 11,787 | 1.16 | 441 | 16,048 | 0.77 | 396 | ||
Table 4. Block Model Gold Estimates at Different cut-off grades* (combined oxide, transitional and fresh material)
| Classification | Indicated | Inferred | |||||
| Category | Cut-off Grade (g/t Au) |
Quantity (000′ tonnes) |
Grade (g/t Au) |
Cont. Gold (000′ oz) |
Quantity (000′ tonnes) |
Grade (g/t Au) |
Cont. Gold (000′ oz) |
| Total all Material Types and Deposits |
0.10 | 12,142 | 1.14 | 444 | 39,071 | 0.43 | 535 |
| 0.15 | 12,130 | 1.14 | 444 | 29,616 | 0.52 | 498 | |
| 0.20 | 12,108 | 1.14 | 444 | 24,611 | 0.59 | 471 | |
| 0.25 | 12,037 | 1.15 | 443 | 21,217 | 0.65 | 446 | |
| 0.30 | 11,916 | 1.15 | 442 | 18,583 | 0.71 | 423 | |
| 0.35 | 11,786 | 1.16 | 441 | 15,755 | 0.78 | 393 | |
| 0.40 | 11,641 | 1.17 | 439 | 13,165 | 0.86 | 362 | |
| 0.45 | 10,707 | 1.24 | 427 | 11,601 | 0.91 | 341 | |
| 0.50 | 9,834 | 1.31 | 413 | 10,214 | 0.97 | 320 | |
| 0.55 | 9,046 | 1.38 | 400 | 9,040 | 1.03 | 300 | |
| 0.60 | 8,306 | 1.45 | 386 | 8,031 | 1.09 | 281 | |
* The figures presented above are only intended to show cut-off grade sensitivity on the estimated gold content of the block models but do not represent a Mineral Resource Statement.
In comparison to SRK’s 2013 maiden mineral resource estimation for the Manfo project, the higher gold price and lower cut-off grades used in the 2025 estimation returned a pit-constrained resource significantly larger with respect to tonnage and gold content, and lower in average gold grade than for 2013. It should be noted that the 2013 resource estimation was prepared in accordance with the CIM definitions in place at the time. As a result, the 2013 Resource (refer to Table 5) included material which was above the gold cut-off grades but located outside of the $1,450 Au conceptual pit shells (“Outside Pit”) but SRK justified its inclusion as Inferred resource material if it was adjacent to and at a shallower elevation than the conceptual pit bottoms on the assumption that under higher gold prices the material “may be economically amenable to open pit extraction”. Little did SRK know that twelve years later gold prices would be more than double and most of this material is now captured by economically optimized pits.
Comparing apples with apples, that is, the total project economically pit-constrained resource estimated in 2025 versus that from 2013, the Indicated resource gold content has increased by 126% going from 3,973,000 tonnes averaging 1.52 g/t Au containing 195,000 ounces of gold in 2013 to 11,787,000 tonnes averaging 1.16 g/t Au for 441,000 ounces of gold. The average gold grade however decreased by 24% reflecting the lower gold cut-off grades used in 2025. For the Inferred pit-constrained resource the total gold content increased by 395% going from 2,253,000 tonnes averaging 1.10 g/t Au containing 80,000 ounces gold in 2013 to 16,048,000 tonnes averaging 0.77 g/t Au containing 396,000 ounces gold with an average gold grade decrease of 30%. Refer to Table 6.
Table 5. Maiden Resource Estimate* for the Manfo Project by SRK Consulting, Canada, (May 17, 2013)
| Category | Indicated | Inferred | |||||
| Cut-off Grade (g/t Au) |
Quantity (000′ tonnes) |
Grade (g/t Au) |
Cont. Gold (000′ oz) |
Quantity (000′ tonnes) |
Grade (g/t Au) |
Cont. Gold (000′ oz) |
|
| Inside Pit | |||||||
| Oxide | 0.4 | 49 | 0.96 | 2 | 458 | 1.07 | 16 |
| Transitional | 0.5 | 382 | 1.96 | 24 | 876 | 1.13 | 32 |
| Fresh | 0.5 | 3,543 | 1.49 | 169 | 918 | 1.09 | 32 |
| Total | 3,973 | 1.52 | 195 | 2,253 | 1.1 | 80 | |
| Outside Pit | |||||||
| Oxide | 0.4 | 50 | 0.68 | 1 | |||
| Transitional | 0.5 | 217 | 0.72 | 5 | |||
| Fresh | 0.5 | 7,146 | 0.93 | 213 | |||
| Total | 7,413 | 0.92 | 218 | ||||
| Combined Inside + Outside Pit | |||||||
| Oxide | 0.4 | 49 | 0.96 | 2 | 508 | 1.05 | 17 |
| Transitional | 0.5 | 382 | 1.96 | 24 | 1,093 | 1.05 | 37 |
| Fresh | 0.5 | 3,543 | 1.49 | 169 | 8,064 | 0.94 | 245 |
| Grand Total | 3,973 | 1.52 | 195 | 9,666 | 0.96 | 298 | |
* The 2013 Mineral Resource Estimate is not disclosed in a manner compliant with today’s CIM standards.
1. The 2013 MRE was conducted at a gold price of US$1,450/oz. Only 56% of the total resource was pit constrained.
2. Refer to the June 21, 2013, Technical Report by SRK Consulting (Canada) for the details.
Table 6. Comparison of the Pit-Constrained Mineral Resource Estimations for 2013 and 2025
| Resource Parameters | Indicated | Inferred | ||||||
| Year | Cut-off Grades (g/t Au) |
Gold Price USD |
Quantity (000′ tonnes) |
Grade (g/t Au) |
Cont. Gold (000′ oz) | Quantity (000′ tonnes) |
Grade (g/t Au) |
Cont. Gold (000′ oz) |
| 2013 | 0.40/0.50 | 1,450 | 3,973 | 1.52 | 195 | 2,253 | 1.10 | 80 |
| 2025 | 0.25/0.35 | 2,600 | 11,787 | 1.16 | 441 | 16,048 | 0.77 | 396 |
| % Increase / Decrease | 197 | -24 | 126 | 612 | -30 | 395 | ||
Resource Growth and Exploration Potential
With 396,000 gold ounces (16,048,000 tonnes at an average grade of 0.77 g/t Au) of the Resource in the 2025 update being in the Inferred category, SEMS Technical Services has recommended infill drilling programs to convert more of the Inferred to Indicated resources. Additionally, much of the mineralization remains open-ended on the Manfo project and there is scope to expand the gold resource through successful resource extensional drilling and infill drilling follow up. Figure 2, which is a vertical long-section of the gold grade block model for the Pokukrom East deposit, shows the deposit remains open down-plunge and the northern end of the conceptual $2,600 Au optimized pit is undrilled and not reflected in the current Resource. Additionally, the shallower southern end of the deposit is still open down-dip. Further drilling at Pokukrom East as well as at the other three deposits could potentially add to the total Resource. Exploration drilling programs have also been proposed for the greater Manfo property, and there is potential to add one or more satellite deposits to the project with numerous compelling untested exploration targets remaining, such as the large Bomfaa gold in soil anomaly two to three kilometres northwest of the Pokukrom deposits (refer to Figure 1).
The greatest exploration potential lies in the recent addition of the Nkosuo Mining Permit immediately south of the Manfo property. Hosting interpreted extensions of two of the known Manfo mineralized structures plus possibly additional structures as demonstrated by historical exploration work by Ashanti Goldfields (now AngloGold Ashanti) plus considerable workings by artisanal miners, it is believed that the Nkosuo Lease holds potential for significant new discovery. Exploration work by Pelangio has commenced on the Nkosuo Lease with a UAV (drone) high resolution magnetics survey nearing completion, to be followed by a UAV orthophotography survey, soil geochemical sampling and drill testing of the ranked targets.
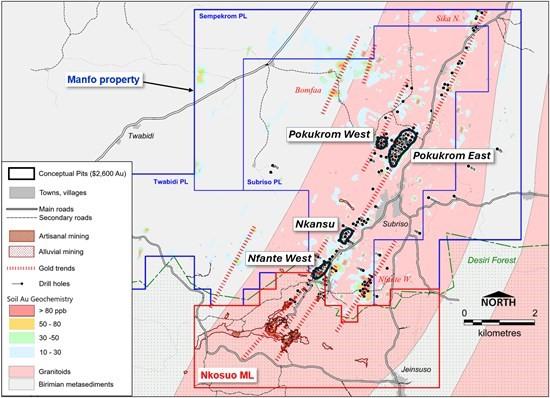
Figure 1. Map of the Manfo – Nkosuo Project and 2025 MRE Deposit Locations
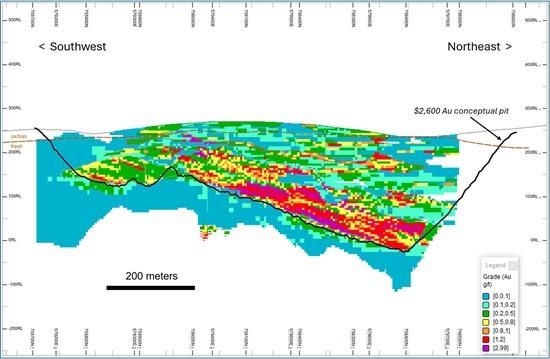
Figure 2. Vertical Long-section of the Pokukrom East Block Model
Qualified Person
Mr. Kevin Thomson, P.Geo. (Ontario, #0191), Senior Vice-President, Exploration and Director, is a qualified person within the meaning of National Instrument 43-101 Standards of Disclosure for Mineral Projects. Mr. Thomson approved the scientific and technical disclosure in this release.
Hudbay Minerals Inc. (TSX:HBM) (NYSE: HBM) today released its ann... READ MORE
Strategic acquisition of an established operating gold mine, loca... READ MORE
Cerro de Pasco Resources Inc. (TSX-V: CDPR) (OTCQB: GPPRF) (FRA: ... READ MORE
The Garneau Titanium Project Features Ilmenite-Rich Boulder with ... READ MORE
ValOre Metals Corp. (TSX‐V: VO) (OTCQB: KVLQF) (Frankfurt: KEQ0... READ MORE


