


Nevada King Gold Corp. (TSX-V: NKG) (OTCQB: NKGFF) is pleased to provide an update on its Phase III regional drill program including results from 25 reverse-circulation drill holes from its Silver Park target, at its 12,000 hectare (120km2), 100% owned Atlanta Gold Mine Project, located in the prolific Battle Mountain Trend 264km northeast of Las Vegas, Nevada. Silver Park is a large target area (3km E-W x 1km N-S), located ~2km from the Atlanta Resource Zone, that is centred on the historical Silver Park Mine, which was operational at a small scale through the turn of the 20th century (Figure 2).
Silver Park Highlights:
| Hole No. | From (m) | To (m) | Interval (m) | Au (g/t) | Ag (g/t) | AuEq* (g/t) | As (ppm) |
| AT25SP-021 | 18.3 | 48.8 | 30.5 | 0.20 | <0.50 | 0.20 | 660 |
| And | 97.5 | 121.9 | 24.4 | 0.164 | 94.8 | 1.11 | 183 |
| And | 146.3 | 182.9 | 36.6 | 0.071 | 20.3 | 0.27 | 169 |
| Table 1. Highlight hole released today from Silver Park East in both g/t Au and AuEq. Arsenic (As) is strongly associated with mineralization in the Atlanta District; understanding the spatial distribution of these elements can assist in vectoring towards areas with higher probability of mineralization. AuEq based on spot prices of US$3,310/oz Au and US$33.20/oz Ag |
Cal Herron, Exploration Manager of Nevada King, stated, “Silver Park has always been of interest historically, but very shallow mineralization and a very high silver-to-gold ratio led many to believe the mineralization was purely supergene and of little significance. Our new Phase III drilling has changed that view entirely.
“We’ve now confirmed strong gold and silver mineralization across a large area at Silver Park, including the 92m intercept grading 0.47 g/t AuEq in hole SP-21 — the first potentially economic discovery outside the Atlanta resource zone. This mineralization occurs along the same Tertiary-Paleozoic unconformity that hosts gold at Atlanta, and is associated with identical volcanic intrusives, but at a shallower depth.
“This drilling has also established direct geological and geochemical links between Silver Park and Atlanta tying mineralization in both areas to the same hydrothermal event. With this genetic tie now demonstrated, we have a powerful exploration model based on stratigraphy and lithochemistry that allows us to rapidly vector toward new targets across the caldera.
“After several years of work, we are seeing our understanding of the district come into clear focus, significantly increasing the odds of making new discoveries outside the current Atlanta resource.”
Additional Details
Silver Park West Highlights:
Silver Park East Highlights:
Silver Park Lineament
The Silver Park Lineament is a major structural corridor identified by geophysical interpretation of gravity, drone magnetics, and CSAMT, as well as intrusive-related mineralization at surface. It is within this northwesterly-trending corridor that the majority of Tertiary intrusive rocks observed at Atlanta cut upward through basement rocks at fault intersections (Figures 7 and 8). The corridor extends approximately 7km from the historic Bradshaw mine at the south end of Atlanta South to the west-northwest, approximately 3km past SPW, and is rooted in Paleozoic basement rock (Figure 9). CSAMT data indicate multiple NS structures cutting through the target areas as well as oblique crossing structures, and it is at the intersection of these structures where numerous rock chip samples running over 2+ g/t Au and up to 4.58 g/t Au have been found, some of the highest Au grade samples on the property outside of the resource area. In conjunction with rock samples and field observations, soil sampling from early Nevada King work shows strong correlation of Au, Ag, As, weak Mo, and Sb signatures along the lineament (Figure 7).
| Hole No. | From (m) | To (m) | Interval (m) | Au (g/t) | Ag (g/t) | As ppm |
| AT24SP-001* | 12.2 | 128.0 | 115.8 | 0.093 | <0.10 | 141 |
| Includes | 103.6 | 128.0 | 24.4 | 0.23 | 0.73 | 178 |
| AT24SP-002 | 250 | 277.3 | 27.3 | 0.004 | <0.10 | 60 |
| AT24SP-003* | NSI | NSI | NSI | NSI | NSI | NSI |
| AT24SP-004 | NSI | NSI | NSI | NSI | NSI | NSI |
| AT24SP-005 | 67.0 | 146.3 | 79.3 | 0.056 | 1.3 | 136 |
| AT25SP-006 | 164.6 | 195.1 | 30.5 | 0.119 | 4.0 | 340 |
| AT25SP-007 | 42.7 | 79.2 | 36.5 | 0.028 | <0.10 | 128 |
| AT25SP-009* | 0 | 140.2 | 140.2 | 0.044 | <0.10 | 86 |
| And | 213.3 | 274.3 | 61.0 | 0.088 | 0.60 | 140 |
| AT25SP-010* | 0.0 | 129.2 | 129.0 | 0.054 | <0.10 | 119.7 |
| Includes | 48.8 | 61.0 | 12.2 | 0.254 | <0.10 | 333 |
| AT25SP-011 | 24.4 | 128.0 | 103.6 | 0.032 | 3.1 | 41 |
| AT25SP-012 | NSI | NSI | NSI | NSI | NSI | NSI |
| AT25SP-013* | 0 | 109.7 | 109.7 | 0.059 | 1.6 | 231 |
| AT25SP-016 | 6.1 | 73.1 | 67.0 | 0.061 | 1.2 | 267 |
| AT25SP-017 | 42.7 | 91.4 | 48.7 | 0.040 | 1.2 | 72 |
| AT25SP-018 | 134.1 | 146.3 | 12.2 | 0.613 | 0.7 | 151 |
| Includes | 134.1 | 140.2 | 6.1 | 1.08 | 0.5 | 180 |
| And | 249.9 | 262.1 | 12.2 | 0.066 | 1.0 | 411 |
| AT25SP-019 | NSI | NSI | NSI | NSI | NSI | NSI |
| AT25SP-020 | 54.9 | 67.1 | 12.2 | 0.184 | <0.10 | 383 |
| And | 262.1 | 268.2 | 6.1 | 0.50 | 5.3 | 202 |
| AT25SP-021 | 18.3 | 48.8 | 30.5 | 0.20 | <0.10 | 660 |
| And | 97.5 | 121.9 | 24.4 | 0.164 | 94.8 | 183 |
| And | 146.3 | 182.9 | 36.6 | 0.071 | 20.3 | 169 |
| AT25SP-022 | NSI | NSI | NSI | NSI | NSI | NSI |
| AT25SP-023 | 54.8 | 60.9 | 6.1 | 0.223 | 6.5 | 823 |
| And | 109.7 | 134.1 | 24.4 | 0.125 | 3.4 | 35 |
| AT25SP-024 | 128.0 | 134.1 | 6.1 | 0.347 | <0.10 | 104 |
| AT23WT-001 | 199.7 | 300.3 | 100.6 | 0.046 | 3.4 | 24 |
| AT23WT-002 | 187.5 | 237.8 | 50.3 | 0.047 | <0.10 | 59 |
| Includes | 189.0 | 195.1 | 6.1 | 0.187 | 4.3 | 238.3 |
| AT23WT-003+ | 182.9 | 259.1 | 76.2 | 0.067 | 10.4 | 34 |
| Includes | 186.0 | 214.9 | 29.0 | 0.124 | 24.7 | 52 |
| AT23WT-004 | 141.8 | 161.6 | 19.8 | 0.012 | 0.3 | 12 |
| AT24WT-005 | 239.3 | 266.7 | 27.4 | 0.056 | 6.5 | 53.2 |
| Includes | 239.3 | 242.3 | 3.0 | 0.260 | 14.0 | 207 |
| Table 2: All drill results in today’s release. * Denotes angled holes. + Denotes holes that bottomed in mineralization. Multielement geochemistry is used to understand trace elements most associated with different styles of mineralization. Arsenic (As) is strongly associated with mineralization in the Atlanta District. Understanding of the spatial distribution of these elements can assist in vectoring towards areas with higher probability of mineralization.
|
| Hole No. | From (m) | To (m) | Interval (m) | Au (g/t) | Ag (g/t) |
| AR-46 | 0 | 7.62 | 7.62 | 0.26 | 13.30 |
| AR-47* | 0 | 21.3 | 21.3 | 0.04 | 43.28 |
| AR-70+ | 22.7 | 27.4 | 4.7 | 0.22 | <0.50 |
| And | 29.0 | 91.4 | 62.4 | <0.10 | 13.61 |
| SP05-RC2*+ | 44.2 | 51.8 | 7.6 | 0.13 | 5.0 |
| And | 150.9 | 152.4 | 1.5 | 0.13 | 1.8 |
| SP05-RC3* | 36.6 | 45.7 | 9.1 | 0.39 | 1.7 |
| SP05-RC4* | 18.3 | 19.8 | 1.5 | 0.15 | 91.0 |
| SP05-RC7* | 30.5 | 35.1 | 4.6 | 0.30 | 76.0 |
| SP05-RC8*+ | 10.7 | 47.2 | 36.5 | 0.32 | 2.6 |
| AT24WS-86 | 323.2 | 353.7 | 30.5 | 1.35 | 4.0 |
| AT23ET-8 | 0 | 77.7 | 77.7 | <0.04 | <0.5 |
| AT21-71 | 0 | 42.7 | 42.7 | <0.30 | <0.5 |
| Table 3: Historic drill holes and previously released Nevada King holes used in today’s release. AR series holes were drilled by Goldfields in 1990. SP05 series holes were drilled by Northern Abitibi Gold Corp. in 2005. *Denotes angled holes. +Denotes hole that bottomed in mineralization. |
QA/QC Protocols
All RC samples from the Atlanta Project are split at the drill site and placed in cloth and plastic bags utilizing a nominal 2kg sample weight. CRF standards, blanks, and duplicates are inserted into the sample stream on-site on a one-in-twenty sample basis, meaning all three inserts are included in each 20-sample group. Samples are shipped by a local contractor in large sample shipping crates directly to American Assay Lab in Reno, Nevada, with full custody being maintained at all times. At American Assay Lab, samples were weighted then crushed to 75% passing 2mm and pulverized to 85% passing 75 microns to produce a 300g pulverized split. Prepared samples are initially run using a four acid + boric acid digestion process and conventional multi-element ICP-OES analysis. Gold assays are initially run using 30-gram samples by lead fire assay with an OES finish to a 0.003 ppm detection limit, with samples greater than 10 ppm finished gravimetrically. Every sample is also run through a cyanide leach for gold with an ICP-OES finish. The QA/QC procedure involves regular submission of Certified Analytical Standards and property-specific duplicates.
Qualified Person
The scientific and technical information in this news release has been reviewed and approved by Calvin R. Herron, P.Geo., who is a Qualified Person as defined by National Instrument 43-101.
About Nevada King Gold Corp.
Nevada King is focused on advancing and growing its 100% owned, past producing, 120km2 Atlanta Gold Mine project located along the Battle Mountain trend in southeast Nevada. The project hosts an NI 43-101 compliant pit-constrained oxide resource of 460,000 oz Au in the measured and indicated category (11.0M tonnes at 1.3 g/t) plus an inferred resource of 142,000 oz Au (5.3M tonnes at 0.83 g/t) based on historical drilling, and does not include any of the 100,000m+ of drilling completed by Nevada King. See the NI 43-101 Technical Report on Resources titled “Atlanta Property, Lincoln County, NV” with an effective date of October 6, 2020, and a report date of December 22, 2020, as prepared by Gustavson Associates and filed under the Company’s profile on SEDAR+ (www.sedarplus.ca).
NI 43-101 Mineral Resources at the Atlanta Mine
| Resource
Category |
Tonnes
(000’s) |
Au Grade
(ppm) |
Contained Au
(Oz) |
Ag Grade
(ppm) |
Contained Ag
(Oz) |
| Measured | 4,130 | 1.51 | 200,000 | 14.0 | 1,860,000 |
| Indicated | 6,910 | 1.17 | 260,000 | 10.6 | 2,360,000 |
| Measured + Indicated | 11,000 | 1.30 | 460,000 | 11.9 | 4,220,000 |
| Inferred | 5,310 | 0.83 | 142,000 | 7.3 | 1,240,000 |
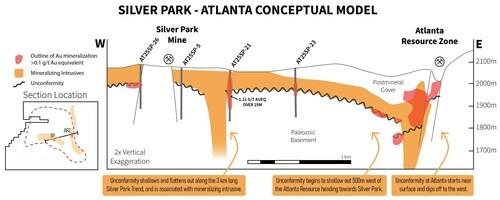
Figure 1. Simplified schematic of section R26, viewed from the north-northwest perspective, spanning 3km and connecting the Silver Park West and Silver Park East target areas with the Atlanta resource zone. The diagram illustrates the continuity along the basement unconformity from Silver Park (left) to the Atlanta Resource Zone (right), as well as the similar intrusions and their relationship with the unconformity that is responsible for mineralization at the ARZ. (CNW Group/Nevada King Gold Corp.)
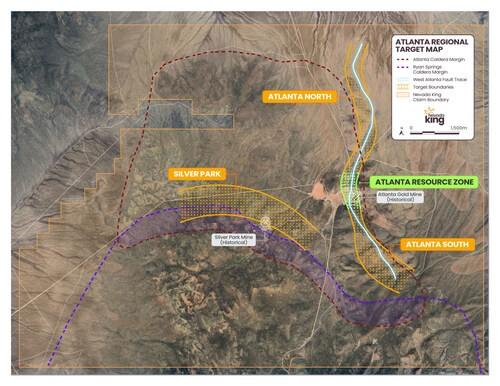
Figure 2. Plan view of Atlanta Gold Mine Project area with locations of the Silver Park, Atlanta South, and Atlanta North exploration targets in relation to the property boundary. Gold mineralization found to date is confined to the Atlanta Caldera, while the Ryan Springs Caldera is younger and obscures the southern portion of the Atlanta Caldera. (CNW Group/Nevada King Gold Corp.)
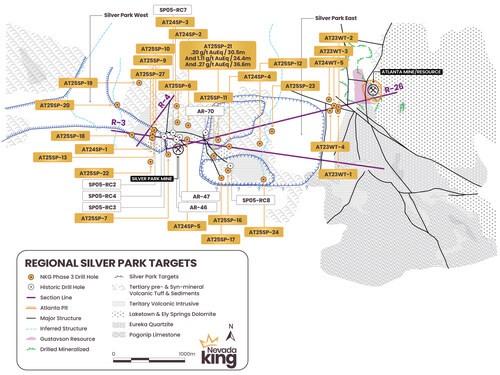
Figure 3. Simplified geologic map of the Silver Park West and Silver Park East regional targets in relation to the Atlanta pit and resource zone. Drill holes cited in the text and tables are shown together with cross section locations. Much of the district is covered by post-mineral volcanic sediments and ignimbrite flows derived from the Ryan Springs Caldera to the south. (CNW Group/Nevada King Gold Corp.)
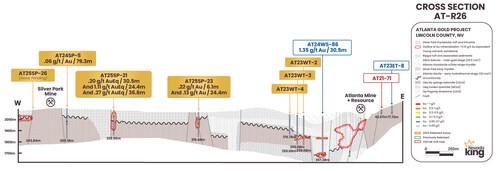
Figure 4. Section R-26 looking north-northwest at 3km span connecting the Silver Park West and Silver Park East target areas with the Atlanta Resource Zone. The historical Atlanta pit is at the far right. Gold mineralization at Atlanta is largely hosted within the Atlanta Rhyodacite intrusive dome, while mineralization at Silver Park West and East is hosted in the Silver Park Rhyodacite. Both units are chemically similar. (CNW Group/Nevada King Gold Corp.)
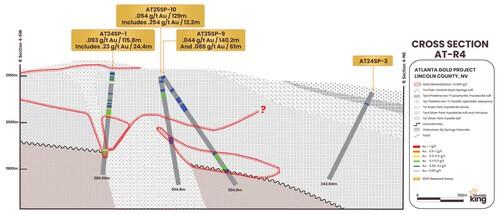
Figure 5. Cross section R4 looking obliquely to the northwest across the Silver Park West Target. Gold mineralization is hosted within the Silver Park Rhyodacite unit near a rhyodacite dome. Anomalous gold in rock and soil samples occurs northwest of this section in an area where CSAMT and gravity data indicate the presence of additional intrusive domes obscured by post-mineral volcanics and alluvium. Drilling is planned for this summer. (CNW Group/Nevada King Gold Corp.)
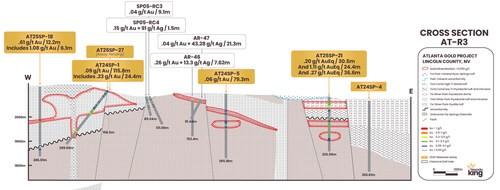
Figure 6: Cross section R3 looking north at the Silver Park West and Silver Park East Targets. Gold mineralization at Silver Park West occurs within weakly altered Silver Park Rhyodacite around the margin of a rhyodacite dome. Au-Ag mineralization at Silver Park East occurs above the Tertiary-Paleozoic unconformity in Silver Park Rhyodacite, it occurs at the unconformity, and also below the unconformity in dolomite. (CNW Group/Nevada King Gold Corp.)
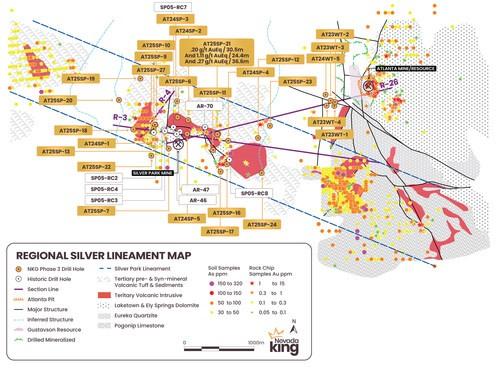
Figure 7. Plan view of the Silver Park Lineament (“SPL”) in relation to geology and anomalous geochemistry from rock and soil samples. The SPL was defined through geophysical interpretation of gravity, magnetic, and CSAMT data sets, although a strong NW trend can be seen in the alignment of outcropping basement rocks and rhyodacite domes/dikes. Post mineral volcanic cover obscures much of the prospective ground along the SPL. (CNW Group/Nevada King Gold Corp.)
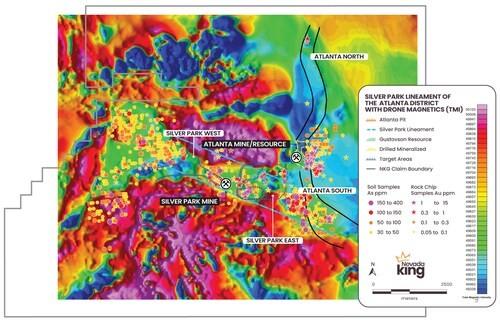
Figure 8. Plan view of the Atlanta district showing plot of total magnetic intensity in relation to Phase III targets, soil sample values, and location of the Silver Park Lineament. Hot colors indicate magnetic highs that generally correspond to volcanic and intrusive lithotypes, while cool colors denote magnetic lows that often coincide with Paleozoic basement rocks. (CNW Group/Nevada King Gold Corp.)
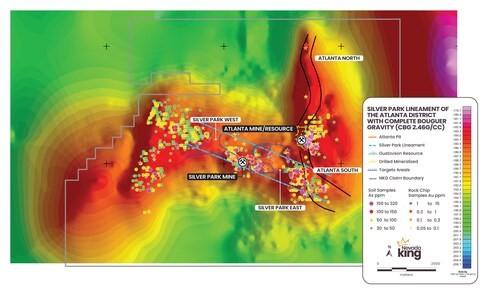
Figure 9. Plan view: Atlanta district – Bouguer gravity plot in relation to Phase III targets, soil sample values & location of SPL. Warm colors=high-gravity signatures from lithologies (eg Paleozoic basement rocks). Cooler colors=low-gravity lithologies (eg Tertiary volcanics & alluvium-filled valleys). SPL sits atop major high gravity corridor comprised of Paleozoic carbonates rocks & is bracketed to the north & south by volcanic moat sequences associated with Atlanta & Ryan Springs Calderas. (CNW Group/Nevada King Gold Corp.)
Hudbay Minerals Inc. (TSX:HBM) (NYSE: HBM) today released its ann... READ MORE
Strategic acquisition of an established operating gold mine, loca... READ MORE
Cerro de Pasco Resources Inc. (TSX-V: CDPR) (OTCQB: GPPRF) (FRA: ... READ MORE
The Garneau Titanium Project Features Ilmenite-Rich Boulder with ... READ MORE
ValOre Metals Corp. (TSX‐V: VO) (OTCQB: KVLQF) (Frankfurt: KEQ0... READ MORE


