


Nevada King Gold Corp. (TSX-V: NKG) (OTC: NKGFF) is pleased to announce results from 20 vertical, reverse circulation holes and one diamond core drill hole completed in the North Extension Target (Tables 1 and 2) together with 14 RC holes drilled in the East Ridge Target (Table 5) at its 12,000 hectare (120km2), 100% owned Atlanta Gold Mine Project, located in the prolific Battle Mountain Trend 264km northeast of Las Vegas, Nevada. These holes were completed as part of the Company’s Phase II drill program.
Highlights:
| Hole No. | From
(m) |
To
(m) |
Interval (m) |
Au
(g/t) |
Ag
(g/t) |
| AT23NS-173 | 149.4 | 178.4 | 29.0 | 1.34 | 2.7 |
| AT23NS-179* | 118.9 | 154.0 | 35.1 | 1.45 | 2.6 |
| AT23NS-177 | 227.1 | 256.1 | 29.0 | 1.95 | 0.9 |
| Includes | 228.6 | 234.7 | 6.1 | 6.60 | 5.43 |
| AT23NS-183A | 201.2 | 263.7 | 62.5 | 1.05 | 6.1 |
| AT24NS-189 | 112.8 | 164.6 | 51.8 | 1.21 | 4.8 |
| Table 1. Highlight holes released today. Mineralization occurs along near-horizontal horizons with true mineralized thickness in vertical holes estimated to be 85% to 95% of reported drill intercept length. *Denotes holes bottoming in mineralization. |
Cal Herron, Exploration Manager of Nevada King, stated, “Gold mineralization is remarkably uniform in grade and thickness all across the NET, with higher grades occurring along and adjacent to high angle feeder structures. Based on gold, silver, and tracer element distributions, the NET is clearly a northward extension of the Atlanta resource zone; however, unlike the resource zone where mineralization and associated intrusive activity were concentrated in down-dropped grabens, the NET mineralization spread along a relatively intact unconformity surface. The thicker, higher-grade mineralization within the main deposit at Atlanta is hosted within deep low resistivity zones, while the shallow low resistivity zone within the NET represents leakage from the main deposit. Given these relationships between CSAMT responses and the observed gold distribution, we are now able to target similar, shallow NET-type environments elsewhere within the Atlanta caldera that can potentially lead into higher-grade gold concentrations.”
| Hole No. | From
(m) |
To
(m) |
Interval
(m) |
Au
(g/t) |
Ag
(g/t) |
Section Line |
| AT23NS-173 | 149.4 | 178.4 | 29.0 | 1.34 | 2.7 | 30N(3) |
| AT23NS-175 | 118.9 | 149.4 | 30.5 | 0.22 | <0.5 | 31N(3) |
| AT23NS-176 | 158.5 | 181.4 | 22.9 | 0.75 | 0.8 | 30N(3) |
| AT23NS-177 | 227.1 | 256.1 | 29.0 | 1.95 | 0.9 | 31N(3) |
| Includes | 228.6 | 234.7 | 6.1 | 6.60 | 5.43 | 31N(3) |
| AT23NS-178 | 97.6 | 137.2 | 39.6 | 0.33 | <0.5 | 31N(3) |
| AT23NS-179* | 118.9 | 154.0 | 35.1 | 1.45 | 2.6 | 30N(3) |
| AT23NS-180 | 227.1 | 245.4 | 18.3 | 1.35 | 1.3 | 30N(3) |
| AT23NS-181 | 237.8 | 248.5 | 10.7 | 1.23 | 1.2 | 28N(3) |
| AT23NS-182A* | 231.7 | 266.8 | 35.1 | 0.94 | 14.0 | 26N(2) |
| AT23NS-183A | 201.2 | 263.7 | 62.5 | 1.05 | 6.1 | 26N(2) |
| AT24NS-155C+ | 158.4 | 170.6 | 12.2 | 1.95 | 11.9 | 28N(3) |
| AT24NS-184 | 85.4 | 118.9 | 33.5 | 0.66 | 0.5 | 30N(3) |
| AT24NS-185 | 225.6 | 248.5 | 22.9 | 1.31 | 6.7 | 27N(3) |
| AT24NS-186 | 201.2 | 225.6 | 24.4 | 1.34 | 2.6 | 25N(3) |
| AT24NS-187 | 189.0 | 219.5 | 30.5 | 0.91 | 10.1 | 27N(3 |
| AT24NS-188 | 108.2 | 146.3 | 38.1 | 0.72 | 1.4 | 29N(3) |
| AT24NS-189 | 112.8 | 164.6 | 51.8 | 1.21 | 4.8 | 28N(3) |
| AT24NS-190 | 233.2 | 253.0 | 19.8 | 1.89 | 9.2 | 23N |
| AT24NS-191 | 216.5 | 231.7 | 15.2 | 0.17 | 4.0 | 22N |
| AT24NS-192 | 211.9 | 231.7 | 19.8 | 0.66 | 6.9 | 24N(3) |
| AT24NS-195 | 216.5 | 251.5 | 35.1 | 0.30 | 9.4 | 22N |
| Table 2: All holes released in today’s sections. Mineralization occurs along near-horizontal horizons with true mineralized thickness in vertical holes estimated to be 85% to 95% of reported drill intercept length. *Denotes hole that bottomed in mineralization.
|
| Hole No. | From
(m) |
To
(m) |
Interval (m) |
Au
(g/t) |
Ag
(g/t) |
Section Line |
| AT21-001* | 94.5 | 131.1 | 25.9 | 1.00 | <0.5 | 30N(3) |
| AT21-002 | 82.3 | 105.2 | 22.9 | 0.71 | <0.5 | 30N(3) |
| AT21-003 | 155.5 | 173.8 | 18.3 | 4.64 | 11.2 | 28N(3) |
| AT21-004 | 85.4 | 118.9 | 33.5 | 0.74 | 1.4 | 28N(3) |
| AT21-005 | 99.1 | 103.7 | 4.6 | 0.42 | 3.4 | 28N(3) |
| AT21-006 | 163.1 | 175.3 | 12.2 | 0.96 | 9.8 | 26N(2) |
| AT21-007 | 91.5 | 111.3 | 19.8 | 1.01 | 2.2 | 26N(2) |
| AT21-002C+ | 86.3 | 104.6 | 18.3 | 0.56 | 2.1 | 30N(3) |
| AT22NS-9 | 86.9 | 128.0 | 41.2 | 0.65 | <0.5 | 30N(3) |
| AT22NS-11* | 102.1 | 125.0 | 22.9 | 1.36 | 0.5 | 29N(3) |
| AT22NS-13 | 135.7 | 160.1 | 24.4 | 1.67 | <0.5 | 28N(3) |
| AT22NS-12 | 175.3 | 195.1 | 19.8 | 1.77 | <0.5 | 28N(3) |
| AT22NS-14 | 99.1 | 143.3 | 44.2 | 0.71 | <0.5 | 27N(3) |
| AT23NS-10A | 105.2 | 144.8 | 39.6 | 0.68 | 2.0 | 29N(3) |
| AT22NS-15* | 155.5 | 176.8 | 21.3 | 1.83 | 5.5 | 26N(2) |
| AT23NS-15A | 160.1 | 179.9 | 19.8 | 1.31 | 12.1 | 26N(2) |
| AT22NS-16 | 91.5 | 106.7 | 15.2 | 0.54 | <0.5 | 27N(3) |
| AT22NS-18 | 178.4 | 193.6 | 15.2 | 0.69 | 4.5 | 24N(3) |
| AT22NS-19A | 170.7 | 176.8 | 6.1 | 0.28 | 7.1 | 24N(3) |
| AT23NS-108 | 182.9 | 210.4 | 27.4 | 0.31 | 4.0 | 27N(3) |
| AT23NS-109 | 225.6 | 239.3 | 13.8 | 3.69 | 1.3 | 30N(3) |
| AT23NS-110* | 175.3 | 201.2 | 25.9 | 1.21 | 3.5 | 29N(3) |
| AT23NS-111 | 175.3 | 190.5 | 15.2 | 0.49 | 1.2 | 30N(3) |
| AT23NS-112 | 155.5 | 176.8 | 21.3 | 4.03 | 6.7 | 29N(3) |
| AT23NS-113 | 256.1 | 297.3 | 41.2 | 0.40 | 5.4 | 24N(3) |
| AT23NS-114 | 190.5 | 227.1 | 36.6 | 0.77 | 5.8 | 28N(3) |
| AT23NS-115 | 218.0 | 231.7 | 13.7 | 0.82 | 7.1 | 29N(3) |
| AT23NS-127 | 117.4 | 146.3 | 28.9 | 0.96 | 1.5 | 29N(3) |
| AT23NS-134* | 94.5 | 128.0 | 33.5 | 0.190 | <0.5 | 31N(3) |
| AT23NS-135 | 99.1 | 125.0 | 25.9 | 0.200 | <0.5 | 30N(3) |
| AT23NS-136 | 79.3 | 99.1 | 19.8 | 0.461 | 0.5 | 31N(3) |
| AT23NS-137 | 44.2 | 53.4 | 9.1 | 0.206 | 4.0 | 30N(3) |
| And | 82.3 | 89.9 | 7.6 | 0.240 | <0.5 | 30N(3) |
| AT23NS-138 | 96.0 | 106.7 | 13.7 | 0.363 | 1.8 | 24N(3) |
| AT23NS-139 | 27.4 | 33.5 | 6.1 | 0.224 | 3.7 | 27N(3) |
| AT23NS-140 | 79.3 | 105.2 | 25.9 | 0.350 | 1.8 | 27N(3) |
| AT23NS-141 | 73.2 | 74.7 | 1.5 | 0.309 | 3.4 | 29N(3) |
| AT23NS-142 | 122.0 | 155.5 | 33.5 | 0.40 | 0.7 | 30N(3) |
| AT23NS-143 | 97.6 | 146.3 | 48.8 | 0.73 | <0.5 | 30N(3) |
| AT23NS-144 | 100.6 | 125.0 | 24.4 | 1.98 | <0.5 | 29N(3) |
| AT23NS-145* | 109.8 | 131.1 | 21.3 | 0.42 | 1.9 | 28N(3) |
| AT23NS-147 | 144.8 | 161.6 | 16.8 | 0.74 | 3.5 | 27N(3) |
| AT23NS-148 | 93.0 | 147.9 | 54.9 | 0.65 | <0.5 | 30N(3) |
| AT23NS-153 | 195.1 | 227.1 | 32.0 | 0.73 | 5.3 | 27N(3) |
| AT23NS-155 | 146.3 | 193.2 | 47.3 | 2.57 | 4.4 | 28N(3) |
| Includes | 160.1 | 169.2 | 9.1 | 9.72 | 15.5 | 28N(3) |
| AT23NS-156 | 103.7 | 135.7 | 32.0 | 0.48 | 1.0 | 30N(3) |
| AT23NS-157 | 251.5 | 283.5 | 32.0 | 0.77 | 16.4 | 24N(3) |
| AT23NS-158* | 216.5 | 245.4 | 29.0 | 0.91 | 1.9 | 24N(3) |
| AT23NS-159 | 166.2 | 186.0 | 19.8 | 1.15 | 14.0 | 27N(3) |
| AT23NS-160* | 91.5 | 129.6 | 38.1 | 0.40 | 2.7 | 28N(3) |
| Table 3. Previously released drill holes used in today’s cross sections. AT series holes were drilled by Nevada King in 2021 to 2024. Mineralization occurs along near-horizontal horizons with true mineralized thickness in vertical holes estimated to be 85% to 95% of reported drill intercept length. *Denotes holes bottoming in mineralization. +Denotes core hole.
|
| Hole No. | From (m) | To (m) | Interval (m) | Au (g/t) | Ag (g/t) |
| DHRI-11-03RC | 68.6 | 77.7 | 9.1 | <0.10 | 5.76 |
| DHRI-11-05RC | 61.0 | 82.3 | 21.3 | 0.24 | 3.0 |
| DHRI-11-06RC | 76.2 | 77.7 | 1.5 | 0.10 | 7 |
| DHRI-11-07RC* | 74.7 | 108.2 | 33.5 | 0.18 | 0.7 |
| DHRI-11-09RC | 175.2 | 179.8 | 4.6 | 0.11 | <0.5 |
| DHRI-11-08C+ | 175.3 | 182.9 | 7.6 | 0.09 | <0.5 |
| DHRI-11-12C+ | 297.3 | 304.9 | 7.6 | 0.27 | 11.4 |
| DHRI-11-13C+ | 169.2 | 213.4 | 44.2 | 0.27 | 1.7 |
| KN98-10^ | 198.2 | 211.9 | 13.7 | 1.19 | 1.0 |
| KN98-11^ | 230.2 | 253.0 | 22.9 | 2.07 | 0.7 |
| KN98-12 | 196.6 | 224.1 | 27.5 | 0.77 | 1.9 |
| KN98-13^ | 231.7 | 274.4 | 42.7 | 0.67 | <0.5 |
| KN98-14^ | 237.8 | 265.2 | 27.4 | 0.48 | 3.0 |
| AR-06^ | 146.3 | 157.0 | 10.7 | 0.14 | 29.8 |
| AR-07^ | 112.8 | 137.2 | 24.4 | 0.73 | 0.6 |
| Table 4. All historic holes used in today’s cross sections. AR series holes drilled by Goldfields in 1991. KN series holes drilled by Kinross in 1998. DHRI series holes drilled by Meadow Bay in 2011. *Denotes holes that bottomed in mineralization. +Denotes core hole. ^Denotes angled hole.
|
| Hole No. | From (m) | To (m) | Interval (m) | Au (g/t) | Ag (g/t) |
| AT24ET-16 | NSM | NSM | NSM | NSM | NSM |
| AT24ET-17 | 0 | 7.6 | 7.6 | 0.22 | 1.26 |
| AT24ET-18 | NSM | NSM | NSM | NSM | NSM |
| AT24ET-19 | 27.4 | 35.1 | 7.6 | 0.103 | <0.5 |
| AT24ET-20 | NSM | NSM | NSM | NSM | NSM |
| AT24ET-21 | NSM | NSM | NSM | NSM | NSM |
| AT24ET-22 | 30.5 | 38.1 | 7.6 | <0.1 | 1.28 |
| AT24ET-23 | 0 | 15.2 | 15.2 | 0.46 | 1.08 |
| AT24ET-24 | 4.6 | 12.2 | 7.6 | 0.10 | 1.02 |
| AT24ET-25 | 7.6 | 18.3 | 10.7 | 1.1 | 1.59 |
| AT24ET-26 | 1.5 | 7.6 | 6.1 | 0.20 | <0.5 |
| AT24ET-27 | 15.2 | 24.4 | 9.1 | 0.435 | 1.65 |
| AT24ET-28 | 50.3 | 71.6 | 21.3 | 0.431 | <0.5 |
| AT24ET-29 | 12.2 | 13.7 | 1.5 | 0.141 | 4.8 |
| Table 5. All remaining East Ridge Target holes reported in today’s release. |
QA/QC Protocols
All RC samples from the Atlanta Project are split at the drill site and placed in cloth and plastic bags utilizing a nominal 2kg sample weight. CRF standards, blanks, and duplicates are inserted into the sample stream on-site on a one-in-twenty sample basis, meaning all three inserts are included in each 20-sample group. Samples are shipped by a local contractor in large sample shipping crates directly to American Assay Lab in Reno, Nevada, with full custody being maintained at all times. At American Assay Lab, samples were weighted then crushed to 75% passing 2mm and pulverized to 85% passing 75 microns in order to produce a 300g pulverized split. Prepared samples are initially run using a four acid + boric acid digestion process and conventional multi-element ICP-OES analysis. Gold assays are initially run using 30-gram samples by lead fire assay with an OES finish to a 0.003 ppm detection limit, with samples greater than 10 ppm finished gravimetrically. Every sample is also run through a cyanide leach for gold with an ICP-OES finish.
The QA/QC procedure involves regular submission of Certified Analytical Standards and property-specific duplicates.
Qualified Person
The scientific and technical information in this news release has been reviewed and approved by Calvin R. Herron, P.Geo., who is a Qualified Person as defined by National Instrument 43-101.
About Nevada King Gold Corp.
The Atlanta Mine is a historical gold-silver producer with a NI 43-101 compliant pit-constrained resource of 460,000 oz Au in the measured and indicated category (11.0M tonnes at 1.3 g/t) plus an inferred resource of 142,000 oz Au (5.3M tonnes at 0.83 g/t). See the NI 43-101 Technical Report on Resources titled “Atlanta Property, Lincoln County, NV” with an effective date of October 6, 2020, and a report date of December 22, 2020, as prepared by Gustavson Associates and filed under the Company’s profile on SEDAR+ (www.sedarplus.ca).
| Resource Category | Tonnes (000s) |
Au Grade
(ppm) |
Contained Au
Oz |
Ag Grade
(ppm) |
Contained Ag
Oz |
| Measured | 4,130 | 1.51 | 200,000 | 14.0 | 1,860,000 |
| Indicated | 6,910 | 1.17 | 260,000 | 10.6 | 2,360,000 |
| Measured + Indicated | 11,000 | 1.30 | 460,000 | 11.9 | 4,220,000 |
| Inferred | 5,310 | 0.83 | 142,000 | 7.3 | 1,240,000 |
| Table 6. NI 43-101 Mineral Resources at the Atlanta Mine |
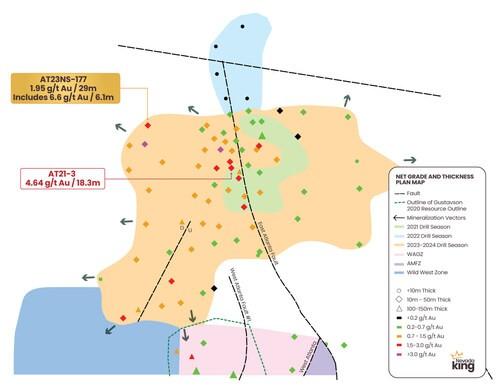
Table 1. Highlight holes released today. Mineralization occurs along near-horizontal horizons with true mineralized thickness in vertical holes estimated to be 85% to 95% of reported drill intercept length. *Denotes holes bottoming in mineralization. (CNW Group/Nevada King Gold Corp.)
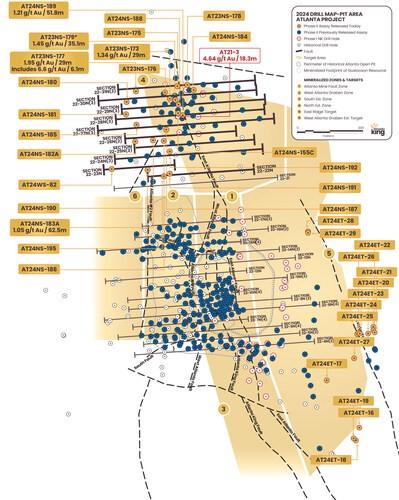
Figure 2. Location map for holes reported in today’s news release along 10 sections shown below in figures 3-11. In addition to the holes released along the NET sections, the remaining holes of the East Ridge Target CSAMT test holes are also reported in today’s release. (CNW Group/Nevada King Gold Corp.)
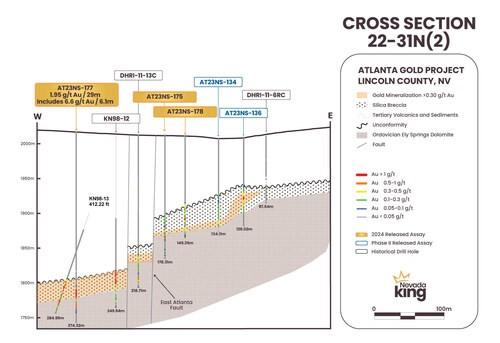
Figure 3. Section 22-31N(2) looking north across the AMFZ. Mineralization occurs along a gently west-dipping, silicified horizon developed at the unconformable contact between basal Ordovician age dolomite and overlying Tertiary age volcanics. True mineralized thickness estimated to be 85% to 95% of reported drill intercept length in vertical holes. (CNW Group/Nevada King Gold Corp.)
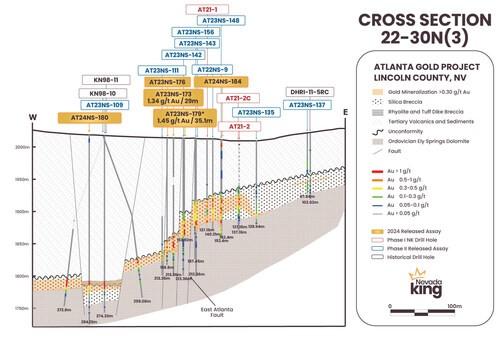
Figure 4. Section 22-30N(3) looking north across the AMFZ. Mineralization occurs along a gently west-dipping, silicified horizon developed at the unconformable contact between basal Ordovician age dolomite and overlying Tertiary age volcanics. True mineralized thickness estimated to be 85% to 95% of reported drill intercept length in vertical holes. (CNW Group/Nevada King Gold Corp.)
Figure 5. Section 22-29N(3) looking north across the AMFZ. Mineralization occurs along a gently west-dipping, silicified horizon developed at the unconformable contact between basal Ordovician age dolomite and overlying Tertiary age volcanics. True mineralized thickness estimated to be 85% to 95% of reported drill intercept length in vertical holes. (CNW Group/Nevada King Gold Corp.)
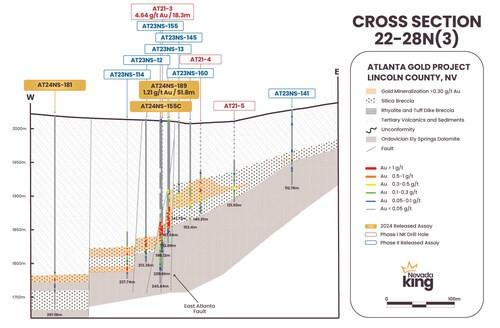
Figure 6. Section 22-28N(3) looking north across the AMFZ. Mineralization occurs along a gently west-dipping, silicified horizon developed at the unconformable contact between basal Ordovician age dolomite and overlying Tertiary age volcanics. True mineralized thickness estimated to be 85% to 95% of reported drill intercept length in vertical holes. (CNW Group/Nevada King Gold Corp.)
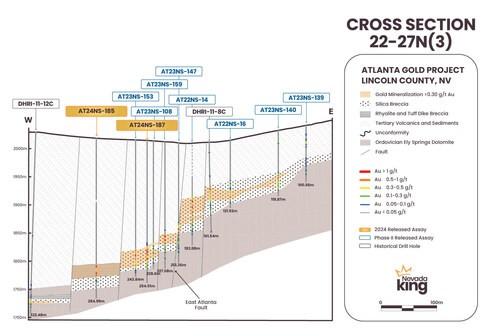
Figure 7. Section 22-27N(3) looking north across the AMFZ. Mineralization occurs along a gently west-dipping, silicified horizon developed at the unconformable contact between basal Ordovician age dolomite and overlying Tertiary age volcanics. True mineralized thickness estimated to be 85% to 95% of reported drill intercept length in vertical holes. (CNW Group/Nevada King Gold Corp.)
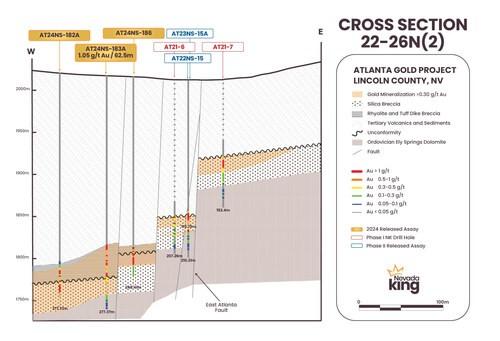
Figure 8. Section 22-26N(2) looking north across the AMFZ. Mineralization occurs along a gently west-dipping, silicified horizon developed at the unconformable contact between basal Ordovician age dolomite and overlying Tertiary age volcanics. True mineralized thickness estimated to be 85% to 95% of reported drill intercept length in vertical holes. (CNW Group/Nevada King Gold Corp.)
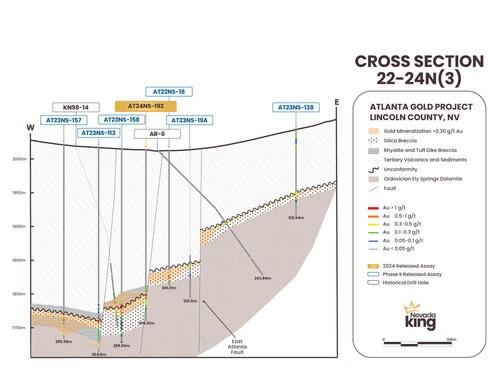
Figure 9. Section 22-24N(3) looking north across the AMFZ. Mineralization occurs along a gently west-dipping, silicified horizon developed at the unconformable contact between basal Ordovician age dolomite and overlying Tertiary age volcanics. True mineralized thickness estimated to be 85% to 95% of reported drill intercept length in vertical holes. (CNW Group/Nevada King Gold Corp.)
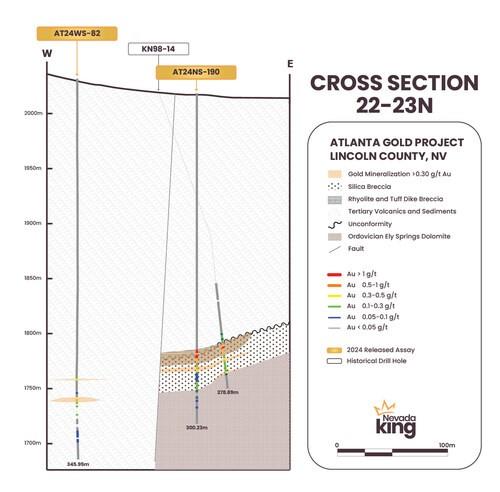
Figure 10. Section 22-23N looking north across the AMFZ. Mineralization occurs along a gently west-dipping, silicified horizon developed at the unconformable contact between basal Ordovician age dolomite and overlying Tertiary age volcanics. True mineralized thickness estimated to be 85% to 95% of reported drill intercept length in vertical holes. (CNW Group/Nevada King Gold Corp.)
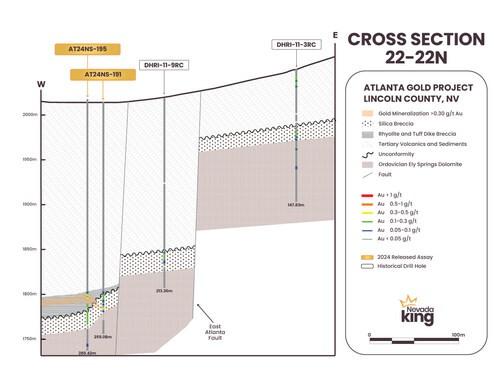
Figure 11. Section 22-22N looking north across the AMFZ. Mineralization occurs along a gently west-dipping, silicified horizon developed at the unconformable contact between basal Ordovician age dolomite and overlying Tertiary age volcanics. True mineralized thickness estimated to be 85% to 95% of reported drill intercept length in vertical holes. (CNW Group/Nevada King Gold Corp.)
CPM Group’s 10-Year Copper Outlook are now available. ... READ MORE
Arizona Gold and Silver Inc. (TSX-V: AZS) (OTCQB: AZASF) is ple... READ MORE
Brixton Metals Corporation (TSX-V: BBB) (OTCQX: BBBXF) is pleased... READ MORE
Valkea Resources Corp. (TSX-V: OZ) is pleased to announce the clo... READ MORE
Tiger Gold Corp. (TSX-V: TIGR) (FSE: D150) (OTCQB: TGRGF) is plea... READ MORE


