








Low-capital restart using the existing PL mill: US$53 million pre-production capital, 0.7-year payback and 622,000 ounces of gold over a 10-year mine life, with first gold in 2028
PEA Highlights (base case US$3,000/oz gold; all figures in US dollars, after tax unless stated)
¹ Non-GAAP measure – see “Non-GAAP Financial Measures” below.
Minnova Corp. (TSX-V: MCI) (OTC Pink: AGRDF) an advanced development-stage gold company focused on the restart and expansion of its 100%-owned PL Gold Mine in central Manitoba, is pleased to announce the results of the Preliminary Economic Assessment for the restart of the PL Gold Mine. The PEA was prepared by A&B Global Mining (Pty) Ltd. under the supervision of Nicholas Ross King, BSc (Hons) Geology, GDE (Mining Engineering), Pr.Sci Nat. in accordance with National Instrument 43-101 – Standards of Disclosure for Mineral Projects and is based on the 2026 Mineral Resource Estimate announced on September 10, 2026. Unless otherwise stated, all currencies in this news release are in United States dollars and all results are after tax at a 5% real discount rate.
The PEA outlines a combined open-pit and underground operation that re-uses the existing processing plant at the past-producing PL mine site. Initial production is sourced from the high-grade open pits, with processing increasing from 492,000 tonnes in 2028 to 720,000 tonnes per year (approximately 2,000 tonnes per day) from 2029, followed by a transition to underground mining. Readers are cautioned that no production decision has been made. Any such decision would depend on further work, including the completion of a feasibility study, and on financing and permitting.
Gord Glenn, President and CEO of Minnova, commented: “This PEA confirms what we have believed about the PL Gold Mine: a high-grade open pit start, an existing mill and infrastructure, and a modest capital requirement combine to deliver a short payback and strong returns at a conservative US$3,000 gold price. With an after-tax NPV of US$181 million at US$3,000/oz, rising to US$439 million at US$4,000/oz, the PEA demonstrates the project’s current value proposition, while drilling continues to grow the resource beneath the pits and at the satellite Nokomis deposit. The restart of the PL Gold Mine aligns with Premiere Wab Kinew’s goals to triple mine production in the province of Manitoba. We believe its planned restart will create significant long-term economic opportunities for local communities and, the Northwest Territories and Canada. With 124.65 million shares outstanding and 163.78 million shares fully diluted, Minnova’s tight capital structure offers substantial leverage to the Project’s after-tax NPV of US$181 million at US$3,000/oz gold and US$439 million at US$4,000/oz gold.”
Project Economics
Table 1 summarises the key results for the base case (US$3,000/oz) and two alternative gold price cases (US$3,500/oz and a long-term US$4,000/oz). Physical quantities, operating costs and capital costs are the same in all three cases.
Table 1 – Key economic results by gold price case
| Parameter | Base Case US$3,000/oz |
Alternative Case US$3,500/oz |
Higher Price Sensitivity Case US$4,000/oz |
| Valuation (after tax unless stated) | |||
| After-tax NPV @ 5% (US$M) | 180.6 | 310.8 | 438.9 |
| After-tax NPV @ 8% (US$M) | 151.4 | 260.1 | 367.2 |
| After-tax IRR | 111.0% | 151.6% | 187.5% |
| After-tax payback from start of production (years) | 0.68 | 0.54 | 0.45 |
| Pre-tax NPV @ 5% (US$M) | 283.4 | 500.2 | 717.0 |
| Pre-tax IRR | 143.1% | 201.8% | 254.6% |
| LOM after-tax free cash flow¹ (US$M) | 247.6 | 427.7 | 604.9 |
| LOM taxes (US$M) | 139.6 | 259.4 | 382.1 |
| Production and cost | |||
| LOM recovered gold (koz) | 621.5 | 621.5 | 621.5 |
| LOM total operating cost (US$M) | 1,280.8 | 1,280.8 | 1,280.8 |
| Total cash cost¹ (US$/oz) | 2,183 | n/r | n/r |
| AISC¹ (US$/oz) | 2,288 | 2,305 | 2,323 |
| Pre-production capital, 2026-2027 (US$M) | 53.4 | 53.4 | 53.4 |
| Total LOM capital incl. sustaining and closure (US$M) | 120.9 | 120.9 | 120.9 |
All values real (unescalated) US$, 100% equity basis, CAD:USD 0.74. NPV discounted to the start of 2026 using end-of-year discounting. Payback measured from the start of production in 2028. AISC rises slightly with gold price because the 3% royalty is revenue-linked. n/r = not reported. ¹ Non-GAAP measure.
Note on IRR: the after-tax IRR exceeds 100% in all three price cases. This reflects the low pre-production capital of US$53.4 million – the Project re-uses and refurbishes the existing PL mill and site infrastructure – relative to the cash flow of the high-grade open-pit years. With a small, short initial investment, IRR is very sensitive to the timing of pre-production spending and should be read together with NPV.
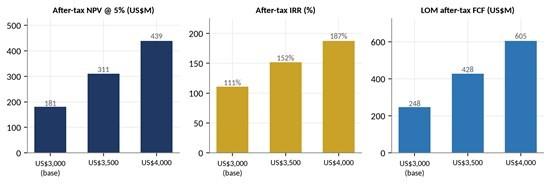
Figure 1: After-tax NPV5%, IRR and LOM free cash flow by gold price case
Production Profile
Table 2 – Production summary
| Parameter | Open pit | Underground | Total LOM |
| Ore mined and processed (Mt) | 1.76 | 4.74 | 6.50 |
| Waste mined (Mt) | 36.9 | 3.42 | 40.3 |
| Strip ratio (waste : ore) | 21:1 | – | – |
| Recovered gold (koz) | 212.0 | 409.4 | 621.5 |
| Mining period | 2028-2030 | 2028-2037 | 2028-2037 |
| Average plant head grade (g/t Au) | 4.68 | 2.80 | 3.30 |
| Metallurgical recovery (design) | 90% | 90% | 90% |
| Average annual gold production, 2028-2037 (koz) | – | – | 62.2 |
Source: PEA financial model (Production Schedule, Economic Summary rows 76-82). Head grade is for combined plant feed.
The Project is planned to commence production in 2028, with initial mill feed sourced from high-grade open-pit mining. Underground mining is expected to commence in mid-2028 and operate concurrently with open-pit mining through 2030. From 2031, underground mining is planned to supply all mill feed through the end of the current LOM production schedule in 2037.
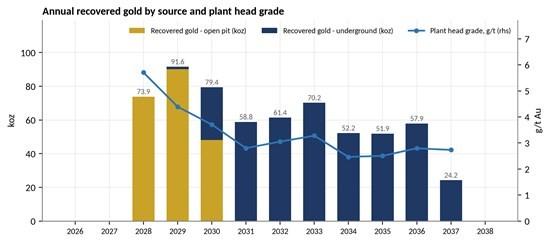
Figure 2: Annual recovered gold by source (koz) and plant head grade (g/t Au)
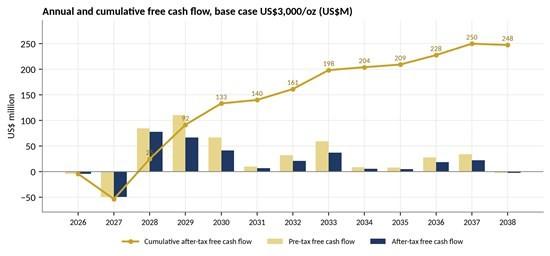
Figure 3: Annual and cumulative free cash flow, base case US$3,000/oz (US$M)
Capital Costs
Pre-production capital is estimated at US$53.4 million over 2026-2027, including a 15% contingency of US$7.0 million. The main items are refurbishment of the mill electrical and mechanical systems (US$20.0 million), open-pit pre-strip (US$9.4 million), camp construction, water handling, tailings construction and the 2 MW genset. Sustaining capital of US$62.9 million includes the 2028 mill upgrade (tertiary crushing, mills and gravity, US$10.0 million), 5 MW and 9 MW gensets for site power before grid connection, the 2030 ventilation shafts and fans (US$15.0 million), and a 3% annual sustaining allowance. Mining is by contractors, so no owner mining fleet capital is required.
Table 3 – Capital cost summary (US$M)
| Category | Pre-production 2026-2027 | 2028 | 2029-2038 | LOM total | ||||||||||||||||||||||||||||||||
| Initial – direct (incl. open-pit pre-strip) | 40.9 | 2.0 | – | 42.9 | ||||||||||||||||||||||||||||||||
| Initial – contingency (15%) | 7.0 | – | – | 7.0 | ||||||||||||||||||||||||||||||||
| Pre-production studies, owner’s costs, approvals | 5.5 | – | – | 5.5 | ||||||||||||||||||||||||||||||||
| Total initial (non-sustaining) capital | 53.4 | 2.0 | – | 55.4 | ||||||||||||||||||||||||||||||||
| Sustaining capital | – | 29.9 | 18.0 | 47.9 | ||||||||||||||||||||||||||||||||
| Sustaining – 3% annual allowance | – | 1.5 | 13. | .0 | ||||||||||||||||||||||||||||||||
| Closure and reclamation | – | – | 2.6 | 2.6 | ||||||||||||||||||||||||||||||||
| Total capital | 53.4 | 33.4 | 34.1 | 120.9 |
Totals may not add due to rounding.
Operating Costs
Open-pit mining costs are based on the pit optimisation (US$5.48/t waste and US$6.70/t ore, including diesel). Underground mining is by contractor at US$82.05/t ore and US$72.44/t development waste, with diesel supplied by the owner. Processing is costed at US$28.13/t milled including power and G&A at US$10.60/t milled. Site power is provided by LNG-fuelled gensets for the first three years and by grid power from 2031.
Table 4 – LOM operating costs
| Area | US$M | US$/t | US$/oz recovered from source |
| Open pit (direct) | 217.1 | 123.58 /t OP ore | 1,024 |
| Underground (direct) | 726.5 | 153.18 /t UG ore | 1,774 |
| Processing (incl. mill power) | 182.8 | 28.13 /t milled | – |
| Shared site, G&A, camp, community and other | 154.4 | 23.76 /t milled | – |
| Total operating cost | 1,280.8 | 197.08 /t milled | 2,061 |
Table 5 – LOM cash costs and AISC, base case (US$/oz sold)
| Component | US$/oz |
| Total operating cost | 2,061 |
| Refining, transport and selling | 32 |
| Royalty (3% of gross revenue) | 90 |
| Total cash cost¹ | 2,183 |
| Sustaining capital and closure | 105 |
| AISC¹ | 2,288 |
| Non-sustaining capital | 89 |
| All-in cost (AIC)¹ | 2,377 |
Per ounce sold, World Gold Council basis. No corporate G&A allocated; no by-product credits. ¹ Non-GAAP measure.
Taxes
The economic analysis includes Manitoba mining tax (graduated rates of 10% to 17% on mining profit, with a new-mine holiday until capital is recovered) and federal (15%) and Manitoba (12%) corporate income tax, using the Company’s existing tax pools (C$16.4 million CEE/CCA pool and C$4.9 million non-capital losses). LOM taxes total US$139.6 million at US$3,000/oz (Manitoba mining tax US$53.0 million; federal and Manitoba income tax US$86.6 million), US$259.4 million at US$3,500/oz and US$382.1 million at US$4,000/oz.
Sensitivity Analysis
The after-tax NPV5% and IRR were tested for changes of ±10% and ±20% in gold price, recovered gold (head grade/recovery), operating costs and capital costs, one variable at a time. The Project is most sensitive to gold price and recovered grade, followed by operating cost, and is relatively insensitive to capital cost.
Table 6 – After-tax sensitivity to key variables (change from base case)
| Variable | -20% | -10% | Base | +10% | +20% |
| After-tax NPV @ 5% (US$M) | |||||
| Gold price | 5.0 | 96.7 | 180.6 | 257.2 | 336.3 |
| Recovered gold (grade / recovery) | 7.3 | 97.6 | 180.6 | 256.3 | 334.8 |
| Operating cost | 288.0 | 234.0 | 180.6 | 122.1 | 60.5 |
| Capital cost | 192.6 | 186.3 | 180.6 | 173.8 | 167.0 |
| After-tax IRR | |||||
| Gold price | 28% | 79% | 111% | 136% | 159% |
| Recovered gold (grade / recovery) | 30% | 80% | 111% | 135% | 159% |
| Operating cost | 136% | 123% | 111% | 95% | 75% |
| Capital cost | 141% | 124% | 111% | 99% | 88% |
For cost variables, “+” is a cost increase. The +10% and +20% recovered-gold cases are a head-grade proxy.
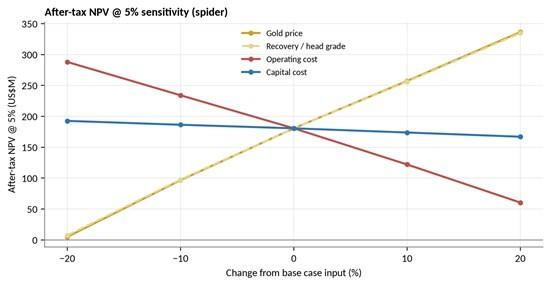
Figure 4: After-tax NPV5% sensitivity (US$M)
Table 7 – After-tax sensitivity to gold price
| Gold price (US$/oz) | 2,500 | 2,750 | 3,000 (base) | 3,250 | 3,500 | 3,750 | 4,000 | 4,250 | 4,500 |
| After-tax NPV @ 5% (US$M) | 39 | 111 | 181 | 244 | 311 | 374 | 439 | 504 | 569 |
| After-tax IRR | 52% | 85% | 111% | 131% | 152% | 169% | 187% | 205% | 222% |
| Payback (years) | 1.09 | 0.81 | 0.68 | 0.61 | 0.54 | 0.49 | 0.45 | 0.41 | 0.38 |
| LOM after-tax FCF (US$M) | 52 | 151 | 248 | 335 | 428 | 515 | 605 | 695 | 784 |
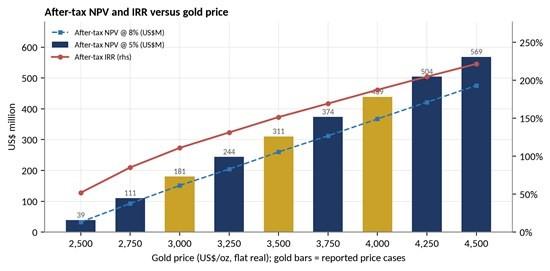
Figure 5: After-tax NPV and IRR versus gold price
Mineral Resource Estimate
The PEA is based on the 2026 MRE for the PL Gold Mine prepared by A&B Global Mining under the supervision of Nicholas Ross King, BSc (Hons) Geology, GDE (Mining Engineering), Pr.Sci.Nat., as announced on September 10, 2026 and summarised in Table 8. The 2026 MRE uses a gold price of US$3,000/oz.
Table 8 – PL Gold Deposit Mineral Resource Estimate (effective date September 10, 2026)
| Category | Tonnes | Au grade (g/t) | Contained Au (oz) |
| PL Deposit – Open Pit: cut-off grade 0.60 g/t Au | |||
| Measured | 1,288,360 | 5.35 | 221,575 |
| Indicated | 289,750 | 4.99 | 46,516 |
| Measured & Indicated | 1,578,110 | 5.28 | 268,091 |
| Inferred | 118,689 | 5.75 | 21,955 |
| PL Deposit – Underground: cut-off grades 1.92 g/t and 1.43 g/t Au | |||
| Measured | 1,343,678 | 5.06 | 218,603 |
| Indicated | 835,239 | 4.26 | 114,464 |
| Measured & Indicated | 2,178,916 | 4.75 | 333,066 |
| Inferred | 1,548,443 | 3.63 | 180,855 |
| PL Deposit – Open Pit and Underground: cut-off grades 0.60 g/t, 1.92 g/t and 1.43 g/t Au | |||
| Measured | 2,632,038 | 5.20 | 440,178 |
| Indicated | 1,124,989 | 4.45 | 160,980 |
| Measured & Indicated | 3,757,026 | 4.98 | 601,158 |
| Inferred | 1,667,132 | 3.78 | 202,810 |
The PEA plant feed and recovered gold are derived from Measured, Indicated and Inferred Mineral Resources in the proportions specified in the PEA, after accounting for the applicable mining dilution and mining recovery assumptions.
PEA Cautionary Statement: The PEA is preliminary in nature. It includes Inferred Mineral Resources that are considered too speculative geologically to have the economic considerations applied to them that would enable them to be categorized as Mineral Reserves, and there is no certainty that the PEA will be realized. Mineral Resources that are not Mineral Reserves do not have demonstrated economic viability. The PEA is not a pre-feasibility or feasibility study, and no Mineral Reserves have been estimated. No production decision has been made, and any such decision would be made only after further studies, including a feasibility study, and financing and permitting.
Key Assumptions and Basis of the PEA
Next Steps
NI 43-101 Technical Report
A technical report prepared in accordance with NI 43-101 supporting the PEA will be filed on SEDAR+ (www.sedarplus.ca) and on the Company’s website within 45 days of the date of this news release.
Qualified Persons
The scientific and technical information in this news release relating to the Preliminary Economic Assessment has been reviewed and approved by the following independent Qualified Persons of A&B Global (Pty) Ltd., South Africa, as defined under National Instrument 43-101 – Standards of Disclosure for Mineral Projects. Each Qualified Person is responsible for the corresponding sections of the PEA:
Non-GAAP Financial Measures
This news release refers to total cash cost, AISC, all-in cost and free cash flow, which are non-GAAP financial measures or ratios. These measures have no standardized meaning under IFRS and may not be comparable to similar measures presented by other issuers. Total cash cost per ounce comprises on-site mining, processing, G&A and community costs, refining, transport and selling costs and royalties, divided by payable ounces. AISC adds sustaining capital and closure costs; AIC adds non-sustaining capital. Free cash flow is net revenue, less operating costs, capital expenditures and taxes. As the Project is not in production, the prospective non-GAAP measures cannot be reconciled to the nearest comparable IFRS measures.
About Minnova Corp.
Minnova Corp. is a near-term gold producer focused on the restart and expansion of its 100%-owned PL Gold Mine in the prolific Flin Flon Greenstone Belt of central Manitoba. The Project is situated on a past-producing mine site and benefits from significant existing infrastructure, including a 1,000 tpd processing plant and a valid underground mining permit (Environment Act Licence 1207E). The 2026 Mineral Resource Estimate defines 601,158 ounces of Measured and Indicated gold resources at 4.98 g/t and 202,810 ounces of Inferred gold resources at 3.78 g/t, including one of Canada’s highest-grade open-pit resources at over 5 g/t. The property is underexplored, with resource expansion potential at depth, along strike and at the Nokomis satellite deposit 7 km northeast of the PL mine site.
Badlands Resources Inc. (TSX-V: BLDS) (FSE: 2KV) is pleased to an... READ MORE
Mayfair Gold Corp. (TSX-V: MFG) (NYSE American: MINE) is pleased... READ MORE
Hosted within 12.16 m (10.67 m estimated true width) intersection... READ MORE
Brutus Mining Inc. (CSE: BRU) (FSE: ZI3) is pleased to announce that it has closed its non-brokered ... READ MORE


