







Mining Americas Inc. (TSX: MAI) (OTCQX: MAIFF) is pleased to announce unaudited financial and operating results for the three and six months ended June 30, 2026. Results are presented in U.S. dollars unless otherwise stated. For details of the consolidated Financial Statements and Management’s Discussion and Analysis, please see the Company’s filings at www.miningamericas.gold or on SEDAR+ at www.sedarplus.ca.
Second Quarter 2026 Highlights
1 Refer to the “Non-IFRS Measures” in this release and associated MD&A for a description of these measures.
2 The average realized gold price in Q2 2026 was impacted by settling 1,500 ounces of the
Company’s outstanding call options with Auramet at an average selling price of $2,096 per ounce.
Mining Americas CEO, Darren Blasutti, commented, “The Pan mine delivered another solid quarter of gold production. At the midpoint of the year, we are comfortably positioned approximately halfway through our annual production guidance of 32,000-38,000 ounces, below our guided cash cost range, and at the midpoint of guided AISC range. Quarterly earnings from mine operations $13.2 million and adjusted net income of $6.5 million ($0.06 per share) were generated despite the lower average realized gold price caused by settling gold call options priced at $2,096 per ounce. The Company’s gold production is now completely exposed to current higher trending gold prices and given the progressive ramp up in mining rates successfully achieved at Pan in Q2 2026, we look forward to higher production rates and correspondingly lower cash costs and AISC later this year. With total available liquidity of $73 million and no debt payments until 2029, Mining Americas is in a strong financial position to advance our pipeline of high-quality, low-capital growth projects.
We would also like to congratulate our Pan mine operating team for winning the Nevada Mining Association’s Operator Safety Award for 2025 – an award the Pan mine has now won seven out of the past ten years.”
Recent Highlights
Copperstone Project Update
Copperstone project engineering work continued in Q2 2026 as restart plans for the underground mine advanced. On May 27, 2026, the Company announced the results of a pre-feasibility study on the underground Copperstone project, with a concurrent positive construction decision by the Company’s board of directors. During Q2 2026 and recently, project activities at Copperstone include:
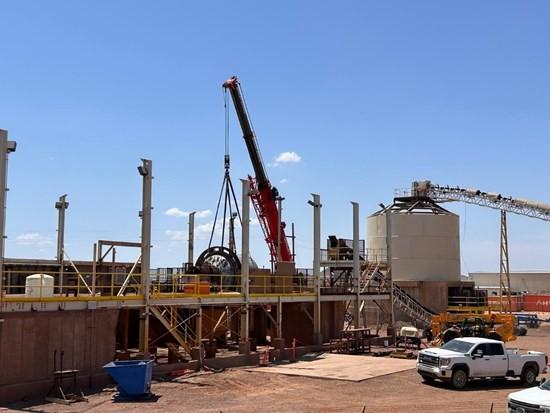
Figure 1. Historic ball mill being removed from the process plant
The Company initiated an exploration drilling program in Q2 2026 and anticipates the completion of the drilling during the second half of 2026. The Company is examining the potential for a near-surface open-pit resource for the Copperstone project. There was a history of open pit gold production when the Copperstone deposit was initially developed in the 1980s.
2026 Outlook
The Company’s strategy is to become a leading, U.S. focused intermediate gold producer by growing production at its Pan Operating Complex and developing its pipeline of high-quality, low-capital projects while expanding gold resources across its portfolio. For 2026, the Company has the following goals pursuant to its strategy:
Q1 2026 Financial Highlights
| Three months ended | Six months ended | |||||||||||
| June 30, | June 30, | June 30, | June 30, | |||||||||
| in $ thousands USD except per share amounts | 2026 | 2025 | 2026 | 2025 | ||||||||
| Revenue | 32,648 | 2,278 | 71,840 | 4,698 | ||||||||
| Cost of Sales | ||||||||||||
| Production costs | 16,675 | 2,510 | 33,319 | 4,307 | ||||||||
| Royalty and production taxes | 1,708 | 0 | 3,554 | 0 | ||||||||
| Depreciation and amortization | 1,072 | 53 | 2,310 | 114 | ||||||||
| Total Cost of Sales | 19,455 | 2,563 | 39,183 | 4,421 | ||||||||
| Earnings from mine operations | 13,193 | (285 | ) | 32,657 | 277 | |||||||
| Expenses, Taxes and Other Items | ||||||||||||
| General and administrative | (1,551 | ) | (899 | ) | (2,744 | ) | (1,956 | ) | ||||
| Exploration | (6,530 | ) | (858 | ) | (8,376 | ) | (22,804 | ) | ||||
| Share-based compensation | (1,569 | ) | (18 | ) | (2,700 | ) | (968 | ) | ||||
| Foreign exchange gain | 286 | 1,360 | 423 | 2,637 | ||||||||
| Other expenses | (28 | ) | (10 | ) | (54 | ) | (534 | ) | ||||
| Finance expense | (17,694 | ) | (875 | ) | (18,979 | ) | (1,231 | ) | ||||
| Change in fair value of investments | (101 | ) | – | 40 | – | |||||||
| Current and deferred income tax expense | (1,729 | ) | – | (5,130 | ) | – | ||||||
| Net loss | (15,723 | ) | (1,585 | ) | (4,863 | ) | (24,579 | ) | ||||
| Loss per share – basic and diluted | (0.14 | ) | (0.02 | ) | (0.04 | ) | (0.44 | ) | ||||
| Adjusting for: | ||||||||||||
| Cerro de Oro royalty buy-back | 4,500 | |||||||||||
| Gold loan loss on repayment | 10,556 | |||||||||||
| Call option settlement in gold ozs | 7,121 | |||||||||||
| Subt non-recurring items | 22,177 | |||||||||||
| Adjusted net income | 6,454 | |||||||||||
| Adjusted net income per share (diluted) | 0.06 | |||||||||||
In Q2 2026, the Company sold 8,329 ounces of gold, at an average realized price of $3,920 per ounce, for revenue of $32.6 million compared to 898 ounces of gold sold at an average realized price of $3,503 per ounce for revenue of $2.3 million in the Q2 2025 period. The increase in revenue is a direct result of gold production and sales from the Pan mine in Q2 2026.
Cost of sales for Q2 2026 was $19.5 million compared to $2.6 million in the prior year comparable period. This increase reflects the inclusion of the Pan production and operating costs during the Q2 2026 period and the reduction in the Santana operation during the year while it awaited the expansion approvals in Mexico. During the second quarter, Pan produced 8,137 ounces and produced 80 ounces from carbon re-stripping, with 1,540 ounces remaining in inventory on June 30, 2026. These ounces were recognized in revenue in July 2026.
Total cash costs and AISC for Q2 2026 are $1,831 and $2,054 per ounce sold, respectively.
General and administrative expenses in Q2 2026 were $1.6 million compared to $0.9 million in the comparable prior-year period. The increase partly reflects professional fees incurred to complete the new revolving credit facility, which closed on May 26, 2026. In addition, general and administrative fees were higher than in the second quarter of 2025 driven by the addition of the Pan operation, and additions to the Company’s senior and executive management teams.
Exploration expenses in Q2 2026 were $6.5 million which includes the $4.5 million non-cash impact of a royalty repurchase at the Cerro de Oro project, paid for in shares, but also reflecting ongoing costs at the Copperstone project and holding and operating costs at the Company’s non-operating subsidiaries. The comparative exploration expense in Q2 2025 was $0.9 million, reflecting holding costs at the Company’s non-operating subsidiaries.
The Company recorded share-based compensation expense of $1.6 million in Q2 2026, compared to share-based compensation expense of $0.2 million reported in the comparable prior-year period. This expense is modestly higher in the current period mainly reflecting the timing of vesting between grants of stock options and restricted share units in the prior period.
The finance expense of $17.7 million in Q2 2026 includes the $9.6 million loss on settlement of a gold loan at higher spot prices and the $7.1 million cost of buying gold ounces to settle a call option, combined with interest expense incurred on the new revolving credit facility in June. Prior-year comparable Q2 finance expense was $0.9 million.
The current tax expense of $3.6 million and deferred tax recovery of $1.7 million reflect the Q2 2026 provision for taxable income at the Pan operation.
As a result of the above, the Company’s operations during Q2 2026 resulted in net loss of $15.7 million compared to a net loss of $1.6 million in the comparable prior-year period. Adjusting for non-recurring expense items, adjusted net income was $6.5 million or $0.06 per share in Q2 2026.
Consolidated Highlights
| Three months ended | Six months ended | ||||||||||||
| Restated | Restated | ||||||||||||
| June 30, | June 30, | June 30, | June 30, | ||||||||||
| in $ thousands USD except per share amounts | 2026 | 2025 | 2026 | 2025 | |||||||||
| Financial Results | |||||||||||||
| Revenue2 | 32,648 | 2,278 | 71,840 | 4,698 | |||||||||
| Cost of sales, incl. royalties and depreciation and amortization | 19,455 | 2,563 | 39,183 | 4,421 | |||||||||
| Earnings from mine operations | 13,193 | (285 | ) | 32,657 | 277 | ||||||||
| (Loss) income before income taxes | (13,994 | ) | (1,585 | ) | 267 | 24,579 | |||||||
| Net (loss) income | (15,723 | ) | (1,585 | ) | (4,863 | ) | (24,579 | ) | |||||
| Basic (loss) per share | (0.144 | ) | (0.020 | ) | (0.044 | ) | (0.440 | ) | |||||
| Cash flow from (used in) operating activities: | |||||||||||||
| Capital expenditures (sustaining) | 2,616 | 5 | 3,351 | 116 | |||||||||
| Capital expenditures (growth) | 2,615 | – | 6,695 | – | |||||||||
| Operating Results | |||||||||||||
| Gold produced (oz) | 8,217 | 898 | 16,951 | 1,912 | |||||||||
| Gold sold (oz) | 8,329 | 898 | 17,463 | 1,912 | |||||||||
| Per Ounce Results | |||||||||||||
| Average realized price ($/oz sold) | $ | 3,920 | $ | 3,503 | $ | 4,114 | $ | 3,462 | |||||
| Operating cash costs per ounce sold1($/oz sold): | |||||||||||||
| Cash cost per ounce sold1 ($/oz sold) | $ | 1,831 | – | $ | 1,740 | – | |||||||
| AISC per ounce sold1 ($/oz sold) | $ | 2,054 | – | $ | 1,930 | – | |||||||
| 1 Non-IFRS measure, for further information refer to the Non-IFRS Measures section in this release. 2 Gold ounces sold include 80 ozs produced from restripped carbon from Santana, with associated revenues of $297 for the sales. |
|||||||||||||
Cash Flow
| Six months ended | Year ended | ||||||
| in $ thousands USD | June 30, 2026 | December 31, 2025 | |||||
| Net Cash Provided Operating Activities | 5,847 | 22,634 | |||||
| Net Cash Used in Investing Activities | – 12,658 | – 101,912 | |||||
| Net Cash Provided by Financing Activities | 6,242 | 114,470 | |||||
| Effect of Exchange Rate Changes on Cash | 58 | 185 | |||||
| Change in Cash and Cash Equivalents | – 511 | 35,377 | |||||
| Cash and Cash Equivalents, Beginning of Period | 43,962 | 8,585 | |||||
| Cash and Cash Equivalents, End of Period | 43,451 | 43,962 |
June 30, 2026, cash and cash equivalents balance of $43.5 million is used for ongoing operations at the Pan mine, the ongoing work towards the project development/construction plan for the Copperstone project, and for ongoing corporate costs.
During the second quarter of 2026, the Company realized operating cash flow of $3.3 million, had investing outflows of $7.4 million and realized financing cash inflows of $2.0 million, resulting in a use of $2.1 million of cash during Q2 2026. In late May, the Company drew $45 million against the new revolving credit facility, which enabled the reduction of long-term debt and the settlement of various other obligations as summarized in the reconciliation below.
| Cash and equivalents at April 1, 2026 | $ | 45,587 | |||
| Operating Cashflow Pan mine | 11,690 | ||||
| Working capital net outflow | (8,474 | ) | |||
| Investing outflows | (7,370 | ) | |||
| Draw on Revolving Credit Facility | 45,000 | ||||
| Settlement of gold call options | (7,121 | ) | |||
| Repayment of gold loan | (35,861 | ) | |||
| Cash and equivalents at June 30, 2026 | $ | 43,451 |
Pan Mine Operating Summary
| Three months ended | Six months ended | ||||||
| June 30, | June 30, | ||||||
| Mining | 2026 | 2026 | |||||
| Ore Mined (t) | 1,492,346 | 2,678,595 | |||||
| Waste Mined (t) | 3,920,590 | 6,691,369 | |||||
| Total Mined (t) | 5,412,936 | 9,369,964 | |||||
| Grade (g/t Au) | 0.257 | 0.264 | |||||
| Gold Mined (oz) | 12,315 | 22,747 |
Mining operations at the Pan mine during Q2 2026 averaged over 58,800 tonnes per day, with total material moved of 5.4 million tonnes. Material moved included 1.5 million ore tonnes at a grade of 0.257 g/t, with 1.5 million tonnes placed on the heap leach pad, containing 12,438 ounces of gold. Operations during the first six months of 2026 averaged over 51,700 tonnes per day, with total material moved of 9.4 million tonnes. Material moved included 2.7 million tonnes placed on the heap leach pad, containing 23,126 ounces of gold. Over the first half of 2026, the mining rates at Pan have steadily increased, reflecting the productivity and efficiency of the mining contractor that was appointed in January of 2026.
| Three months ended | Six months ended | ||||||
| June 30, | June 30, | ||||||
| Processing | 2026 | 2026 | |||||
| Ore Placed on Leach Pad (t) | 1,509,508 | 2,691,087 | |||||
| Grade (g/t Au) | 0.256 | 0.267 | |||||
| Contained Gold (oz) | 12,438 | 23,126 | |||||
| Gold produced (oz) | 8,137 | 16,871 | |||||
| Gold sold (oz) | 8,249 | 17,383 |
During Q2 2026, 8,137 ounces of gold were produced by the Pan mine at total cash costs and AISC of $1,831 per ounce sold and $2,054 per ounce sold, respectively, with 8,249 ounces sold, and 1,540 ounces of gold in finished goods inventory. During the first six months of 2026, the Pan mine produced 16,871 ounces of gold at total cash costs and AISC of $1,740 per ounce sold and $1,930 per ounce sold, respectively, with 17,383 ounces sold in the period.
The Pan mine recently achieved exemplary safety milestones. The operation won the 2025 Nevada Mining Association’s Operator Safety Award for small mines, having also previously won the award in 2016-2020 and in 2024. The Pan mine has not had a medical treatment injury since 2023 and recently surpassed 5 years with no lost time injuries.
Qualified Person
The scientific and technical information contained in this news release has been reviewed and approved by Mr. Darren Koningen, P.Eng., the Company’s President & COO, who is the Qualified Person under National Instrument 43-101.
About Mining Americas
Mining Americas Inc. (formerly Minera Alamos Inc.) is a growing North American gold production and development company with projects in Nevada, Arizona, and Mexico. The Company owns the Pan Operating Complex in White Pine County, Nevada, comprised of the producing Pan mine and the adjacent permitted Gold Rock project.
The Company also owns the Copperstone project in La Paz County, Arizona, a permitted, advanced underground gold project. The Company maintains a portfolio of high-quality Mexican assets, including the Cerro de Oro project, an open pit heap leach gold development project in northern Zacatecas.
The Company’s strategy is to become a leading, U.S.-focused intermediate gold producer by growing production at its Pan Operating Complex and developing its pipeline of high-quality, low-capital projects while expanding gold resources across its portfolio.
Brutus Mining Inc. (CSE: BRU) (FSE: ZI3) is pleased to announce that it has closed its non-brokered ... READ MORE
Jaguar Uranium Corp. (NYSE American: JAGU) is pleased to announce an independent Mineral Resource E... READ MORE
Auro Metals Inc. (TSX-V: AURO) (OTCQB: AURFF), is pleased to announce the assay results of the fina... READ MORE
Endeavour Silver Corp. (NYSE: EXK) (TSX: EDR) is pleased to announce that repairs to the primary bal... READ MORE
Scorpio Gold Corp. (NASDAQ: SGLD) (TSX-V: SGLD) (OTCQB: SRCRF) (FSE: RY9) is pleased to announce re... READ MORE


