


![]()
Kinross Gold Corporation (TSX: K) (NYSE: KGC) today announced its results for the first quarter ended March 31, 2026.
This news release contains forward-looking information about expected future events and financial and operating performance of the Company. We refer to the risks and assumptions set out in our Cautionary Statement on Forward-Looking Information located on pages 24 and 25 of this release. All dollar amounts are expressed in U.S. dollars, unless otherwise noted.
2026 first-quarter highlights:
Return of capital to shareholders:
Operations:
Development projects:
Sustainability:
CEO commentary:
J. Paul Rollinson, CEO, made the following comments in relation to 2026 first-quarter results:
“Kinross delivered another excellent quarter. We generated record free cash flow of approximately $840 million, representing our fourth consecutive quarterly record. Strong operational performance and disciplined cost management drove record margins that continue to outpace the rise in the gold price, which highlights our ability to continue to hold the line on costs.
“We have returned approximately $350 million to shareholders to date in 2026 through dividends and share repurchases, reinforcing our commitment to disciplined capital allocation and delivering meaningful returns. Over the past 12 months, we have returned over $1 billion to shareholders, and through our share buyback program, have reduced our outstanding float by over 3%.
“In the current situation of global uncertainty, we continue to benefit from an attractive relative cost position, supported by our longstanding approach to mitigate cost pressures. This includes the hedging of fuel and currency exposures as well as the continued execution of our grade enhancement strategy. Both are proving effective in the current environment of elevated oil prices and differentiate Kinross.
“In Q1, our pipeline of high-quality development projects advanced on plan. At Great Bear, we continued to make strong progress across both Advanced Exploration and the Main Project. Engineering and procurement are advancing as planned, and new exploration results further reinforce the scale and long-term potential of the deposit.
“At Lobo-Marte, the submission of the Environmental Impact Assessment in April marked an important milestone, formally initiating the permitting process for this long-life, large-scale growth project. Our new U.S. projects – Round Mountain Phase X, Curlew and Redbird – made steady progress and remain firmly on track. Also, we are continuing our studies on our significant resource inventory as we target additional potential mine life extensions across our portfolio.”
Summary of financial and operating results
| Three months ended |
||||||
| March 31, |
||||||
| (in millions of U.S. dollars, except ounces, per share amounts, and per ounce amounts) | 2026 | 2025 | ||||
| Operating Highlights(a) | ||||||
| Total gold equivalent ounces(b) | ||||||
| Produced | 500,941 | 529,861 | ||||
| Sold | 494,128 | 524,089 | ||||
| Attributable gold equivalent ounces(b) | ||||||
| Produced | 492,563 | 512,088 | ||||
| Sold | 485,855 | 506,564 | ||||
| Gold ounces – sold | 482,472 | 516,268 | ||||
| Silver ounces – sold (000’s) | 674 | 701 | ||||
| Earnings(a) | ||||||
| Metal sales | $ | 2,407.7 | $ | 1,497.5 | ||
| Production cost of sales | $ | 690.5 | $ | 546.7 | ||
| Depreciation, depletion and amortization | $ | 275.7 | $ | 288.4 | ||
| Operating earnings | $ | 1,338.1 | $ | 570.4 | ||
| Net earnings attributable to common shareholders | $ | 843.0 | $ | 368.0 | ||
| Net earnings per share attributable to common shareholders (basic and diluted) | $ | 0.70 | $ | 0.30 | ||
| Adjusted net earnings(c) | $ | 854.1 | $ | 364.0 | ||
| Adjusted net earnings per share(c) | $ | 0.71 | $ | 0.30 | ||
| Cash Flow(a) | ||||||
| Net cash flow provided from operating activities | $ | 1,139.5 | $ | 607.1 | ||
| Attributable adjusted operating cash flow(c) | $ | 1,129.3 | $ | 620.3 | ||
| Capital expenditures(d) | $ | 283.2 | $ | 207.7 | ||
| Attributable capital expenditures(c) | $ | 278.9 | $ | 204.1 | ||
| Attributable free cash flow(c) | $ | 837.5 | $ | 380.8 | ||
| Per Ounce Metrics(a) | ||||||
| Average realized gold price per ounce(e) | $ | 4,873 | $ | 2,857 | ||
| Attributable average realized gold price per ounce(c) | $ | 4,873 | $ | 2,856 | ||
| Production cost of sales per equivalent ounce sold(b)(f) | $ | 1,397 | $ | 1,043 | ||
| Attributable production cost of sales per equivalent ounce sold(b)(c) | $ | 1,380 | $ | 1,038 | ||
| Attributable production cost of sales per ounce sold on a by-product basis(c) | $ | 1,296 | $ | 1,010 | ||
| Attributable all-in sustaining cost per equivalent ounce sold(b)(c) | $ | 1,732 | $ | 1,355 | ||
| Attributable all-in sustaining cost per ounce sold on a by-product basis(c) | $ | 1,657 | $ | 1,331 | ||
| Attributable all-in cost per equivalent ounce sold(b)(c) | $ | 2,199 | $ | 1,678 | ||
| Attributable all-in cost per ounce sold on a by-product basis(c) | $ | 2,135 | $ | 1,660 | ||
| (a) | All measures and ratios include 100% of the results from Manh Choh, except measures and ratios denoted as “attributable.” “Attributable” measures and ratios include Kinross’ 70% share of Manh Choh production, sales, cash flow, capital expenditures and costs, as applicable. |
| (b) | “Gold equivalent ounces” include silver ounces produced and sold converted to a gold equivalent based on a ratio of the average spot market prices for the commodities for each period. The ratio for the first quarter of 2026 was 57.79:1 (first quarter of 2025 – 89.69:1). |
| (c) | The definition and reconciliation of these non-GAAP financial measures and ratios is included on pages 17 to 23 of this news release. Non-GAAP financial measures and ratios have no standardized meaning under IFRS and therefore, may not be comparable to similar measures presented by other issuers. |
| (d) | “Capital expenditures” is “Additions to property, plant and equipment” on the interim condensed consolidated statements of cash flows. |
| (e) | “Average realized gold price per ounce” is defined as gold revenue divided by total gold ounces sold. |
| (f) | “Production cost of sales per equivalent ounce sold” is defined as production cost of sales divided by total gold equivalent ounces sold. |
The following operating and financial results are based on first-quarter gold equivalent production:
Production: Kinross produced 492,563 Au eq. oz. in Q1 2026, compared with 512,088 Au eq. oz. in Q1 2025, a decrease of 4%, as planned. Higher production from Paracatu was offset by lower production from Bald Mountain, Fort Knox, Round Mountain, and Tasiast.
Average realized gold price8: During the quarter, the average realized gold price was $4,873 per ounce, compared with $2,857 per ounce in Q1 2025.
Revenue: Revenue increased to $2,407.7 million in Q1 2026, compared with $1,497.5 million during Q1 2025. The 61% year-over-year increase was due to the increase in the average realized gold price.
Production cost of sales: Production cost of sales per Au eq. oz. sold2 increased to $1,397 for the quarter, compared with $1,043 in Q1 2025. Attributable production cost of sales per Au eq. oz. sold1 increased to $1,380 for the quarter, compared with $1,038 in Q1 2025. The increase is primarily due to higher royalty costs as a result of the higher average realized gold price, and timing of inventory movements.
Attributable production cost of sales per Au oz. sold on a by-product basis1 was $1,296 in Q1 2026, compared with $1,010 in Q1 2025, based on attributable gold sales of 474,459 ounces and silver sales of 658,544 ounces.
Margins4: Kinross’ margin per Au eq. oz. sold increased by 92% to a record $3,476 for the first quarter, compared with the Q1 2025 margin of $1,814, outpacing the rise in average realized gold price by over 20% year-over-year.
Attributable all-in sustaining cost1: Attributable all-in sustaining cost per Au eq. oz. sold was $1,732 in Q1 2026, compared with $1,355 in Q1 2025.
In the first quarter, attributable all-in sustaining cost per Au oz. sold on a by-product basis was $1,657, compared with $1,331 in Q1 2025.
Operating cash flow3: Operating cash flow was $1,139.5 million for Q1 2026, compared with $607.1 million for Q1 2025.
Attributable adjusted operating cash flow1 for Q1 2026 was $1,129.3 million, compared with $620.3 million for Q1 2025.
Attributable free cash flow1: Attributable free cash flow more than doubled to $837.5 million in the quarter, compared with $380.8 million in Q1 2025.
Reported net earnings5: Reported net earnings more than doubled to $843.0 million for Q1 2026, or $0.70 per share, compared with reported net earnings of $368.0 million, or $0.30 per share, for Q1 2025.
Adjusted net earnings6 more than doubled to $854.1 million, or $0.71 per share, for Q1 2026, compared with $364.0 million, or $0.30 per share, for Q1 2025.
Reported net earnings and adjusted net earnings in Q1 2026 included $91 million of withholding tax expense, of which $65 million relates to taxes payable in future quarters as a result of the repatriation of strong cash flow generation largely in Mauritania.
Capital expenditures9: Capital expenditures increased to $283.2 million for Q1 2026, compared with $207.7 in Q1 2025, driven by the ramp-up of development activities at Great Bear, Curlew, Round Mountain Phase X, and Bald Mountain Redbird Phases 1 and 2. These increases were partially offset by lower spending on capital development due to planned mine sequencing at Tasiast.
Attributable capital expenditures1 were $278.9 million for Q1 2026, compared with $204.1 million for Q1 2025.
Balance sheet
Kinross added approximately $440 million in cash to the balance sheet after returning capital to shareholders and funding its capital expenditures. As of March 31, 2026, Kinross had cash and cash equivalents of $2.2 billion, compared with $1.7 billion at December 31, 2025.
The Company had additional available credit10 of $1.7 billion and total liquidity7 of approximately $3.9 billion as of March 31, 2026.
Return of capital to shareholders
Kinross’ 2026 buyback strategy is on track. The Company plans to allocate 40% of free cash flow to shareholders through both share buybacks and dividends, assuming no significant changes to gold prices or Kinross’ operations.
Kinross repurchased approximately $250 million in shares during the quarter, and approximately $300 million year-to-date (representing 9.2 million shares). Including its quarterly dividend, Kinross has returned approximately $350 million in capital to shareholders to date in 2026. Since April 2025, Kinross has repurchased approximately $900 million in shares, reducing our share count by more than 3%, and returned approximately $1 billion in capital to shareholders.
As part of its quarterly dividend program, the Company also declared a dividend of $0.04 per common share payable on June 4, 2026, to shareholders of record as of May 21, 2026.
Outlook
The following section of the news release represents forward-looking information and users are cautioned that actual results may vary. We refer to the risks and assumptions contained in the Cautionary Statement on Forward-Looking Information on pages 24 and 25 of this news release.
Kinross remains on track to deliver its 2026 annual guidance for production, cost of sales per ounce, all-in sustaining cost and capital expenditures. Kinross also remains on track to achieve its Effective Tax Rate (ETR) guidance with a lower expected ETR from Q2 2026 to Q4 2026, and on track to meet its full-year taxes paid guidance. Due in part to Kinross’ ongoing hedging programs, cost impacts of rising crude oil prices beginning in March 2026 have been minimal and are not expected to affect the Company’s ability to achieve its full-year cost guidance.
To better reflect global market conditions and the potential impacts of elevated oil prices, Kinross is providing more detail on its oil price sensitivity11 for its full-year guidance in the table below.
| Impact on cost of sales per ounce per $10 per barrel change in oil price | Summary | Impact on full-year guidance of a $100 per barrel oil price from April 1 forward | |
| 2026 oil sensitivity12 | $3/oz. | Direct impacts of crude oil on refined fuel products | |
| 2026 sensitivity related to refining, distribution and taxes | $7/oz. | Includes refining, distribution and taxes | |
| Total fuel cost sensitivity | $10/oz. | $20/oz. (~1% of AISC13) |
|
| Potential additional secondary cost sensitivity | + ~$4/oz. | Considers potential secondary impacts related to freight and other consumables | + ~$10/oz. (~0.5% of AISC13) |
Operating results
Mine-by-mine summaries for 2026 first-quarter operating results may be found on pages 11 and 15 of this news release. Highlights include the following:
At Tasiast, quarter-over-quarter production increased, driven by strong grades, and cost of sales per ounce sold decreased. Year-over-year, production was lower primarily due to the timing of ounces processed through the mill, partially offset by higher grades due to planned mine sequencing. Compared with Q1 2025, cost of sales per ounce sold increased primarily due to higher royalties as a result of higher gold prices.
At Paracatu, production increased quarter-over-quarter with record recoveries as a result of a multi-front optimization program across the processing plant, and increased year-over-year due to the improved recoveries as well as the timing of ounces processed through the mill. Cost of sales per ounce sold increased slightly quarter-over-quarter due to higher royalty costs, and increased year-over-year as a result of higher royalty and drilling contractor costs, and strengthening of the Brazilian real.
At La Coipa, production decreased quarter-over-quarter mainly due to lower tonnes processed as a result of a planned mill maintenance shutdown in March and lower grades due to planned mine sequencing. Year-over-year, production increased primarily due to the timing of ounces processed through the mill, partially offset by the decrease in grades, and cost of sales per ounce sold was higher due to increased labour and reagent costs, strengthening of the Chilean peso, and higher royalties.
At Fort Knox, production was higher quarter-over-quarter, with increased cost of sales per ounce sold due to the timing of ounces processed through the mill and heap leach pads. Year-over-year, production decreased primarily due to lower mill grades and recoveries, partially offset by the timing of ounces processed through the mill. Compared with Q1 2025, cost of sales per ounce sold increased primarily due to processing more tonnes at lower grade through the mill as well as timing of ounces recovered.
At Round Mountain, production decreased quarter-over-quarter and year-over-year primarily due to lower-grade, lower-recovery stockpile feed as mining transitions from Phase W to Phase S. Higher-grade, higher-recovery ore from Phase S is expected in the second half of the year. Cost of sales per ounce sold increased in both comparable periods due to the lower production.
At Bald Mountain, production decreased quarter-over-quarter due to the timing of ounces recovered from heap leach pads, and decreased year-over-year due to fewer tonnes placed on the heap leach pads and lower grades. Cost of sales per ounce sold increased quarter-over-quarter due to fewer ounces produced, and increased year-over-year as a result of the lower production and higher royalties.
Development projects
Great Bear
At Great Bear, Kinross continues to progress its AEX program alongside permitting, detailed engineering and procurement of major equipment for the Main Project.
For AEX, construction of the water treatment plant, including mechanical, piping, and electrical work, was substantially complete, with surface construction approximately 90% complete. In April 2026, the Company received its remaining AEX permits from the Ontario Ministry of Environment, Conservation and Parks. Remaining surface work includes ponds and pads construction, which must be completed before first blast of the underground decline. Underground development at AEX is expected to provide access for infill drilling of the resource and exploration drilling to further delineate extensions of mineralization.
Regarding the Main Project, detailed engineering is advanced and is approximately 45% complete. Procurement of major equipment continues. Open pit and underground mobile equipment Request for Proposal evaluations are ongoing. RFPs for paste plant equipment, building, and tank packages have been issued.
Main Project permitting continues to advance. Federally, Great Bear submitted the third and final phase of its Impact Statement to the Impact Assessment Agency of Canada in March 2026 as planned. Relevant submissions have also been submitted to Fisheries and Oceans Canada.
Provincially, Great Bear continues to work with the Ontario authorities to advance provincial permitting under the One Project, One Process (“1P1P”) permitting process. The next 1P1P steps are approval of the Project Definition and issuance of an Integrated Authorization and Permitting Plan.
In relation to Lac Seul and Wabauskang First Nations, on whose traditional territory the Great Bear Project resides, we are pleased to report that negotiations on the Impact and Benefits Agreement continue to advance based on a recently signed and confidential Memorandum of Understanding that captures the key economic compensatory and procurement elements.
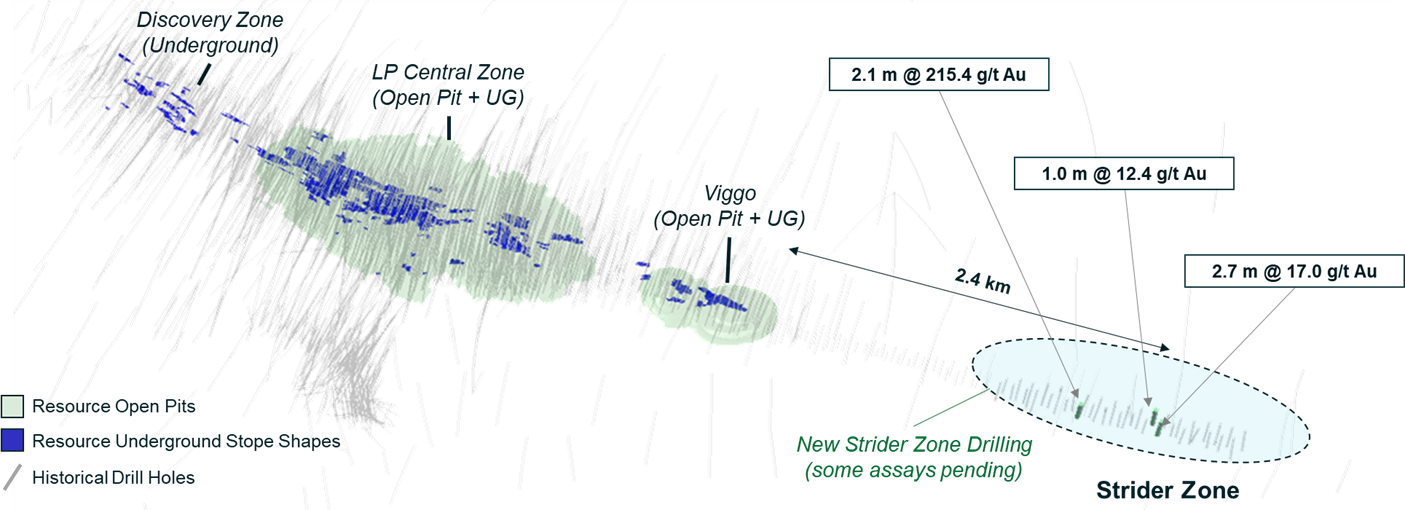
Recent drilling in the new Strider zone has returned mineralized intercepts on trend with the main LP zone, over 2.4 kilometres away from the existing resource. Drilling is ongoing to further test and delineate the structure along strike and at depth.
Highlights include:
Great Bear Plan View:
A photo accompanying this announcement is available at https://www.globenewswire.com/NewsRoom/AttachmentNg/dd58fa8b-ba33-4c3c-82d7-c5786facd287
Lobo-Marte
Lobo-Marte’s Environmental Impact Assessment was submitted in April 2026 and is under review by the regulators, formally initiating the permitting process and marking a milestone for this growth project.
Lobo-Marte is expected to support long-life, large-scale production with the potential to produce approximately 4.7 million gold equivalent ounces over a 16-year mine life14. The project is designed to leverage Kinross’ existing operating experience and infrastructure in Chile.
The Company looks forward to providing a project update in the second half of the year.
Round Mountain Phase X
Underground development at Round Mountain Phase X is progressing well and is slightly ahead of schedule, with over 7,200 metres developed to date. Engineering work is progressing well, site planning for surface and underground infrastructure are well advanced. During the quarter, Kinross marked the completion of all major operational permitting for the Phase X project. Procurement of long lead items including mining equipment is progressing as planned.
Curlew
At Curlew, Kinross progressed key site infrastructure as well as detailed engineering and procurement for the mill refurbishment. The Company has selected a contractor for the mill refurbishment, with mobilization activities beginning. Underground mine development also advanced in Q1 2026 ahead of schedule to de-risk the path to first production in 2028.
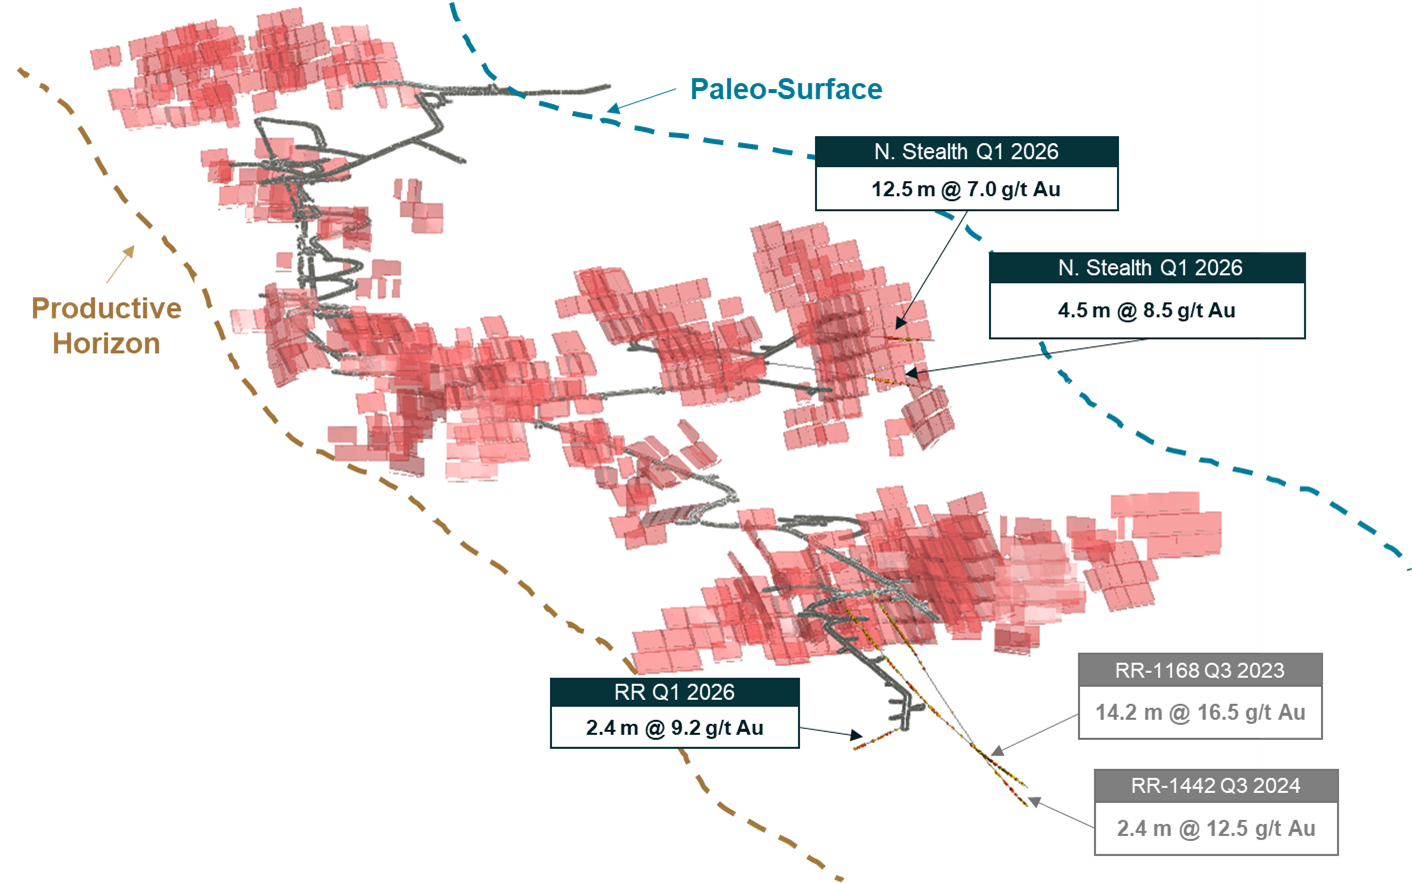
Exploration continued to demonstrate the potential for additional high-grade mineralization with successful drilling at North Stealth and Roadrunner. At North Stealth, recent drilling intersected strong grades and widths, confirming continuity and supporting the extension of mineralization to the east and west. At Roadrunner, drilling continues to return high-grade intercepts, reinforcing the prospectivity of the target area.
Highlights include:
Curlew Cross Section:
A photo accompanying this announcement is available at https://www.globenewswire.com/NewsRoom/AttachmentNg/a407cab2-ac71-4075-a17c-68c6984a7785
Bald Mountain Redbird
At Redbird, Kinross continued to advance project execution across several key areas. Mining is ongoing, the construction of processing infrastructure is progressing well, and earthworks for the heap leach pad extension are ahead of schedule, supported by favourable winter conditions. Significant progress was made on the ordering and initial receipt of major mining equipment, and the design and engineering for the SART plant progressed on plan.
Sustainability
Kinross advanced its research partnership with Lakehead University with a five-year funding commitment to support the Northern Ontario Heritage Fund Industrial Research Chair in Mineral Exploration, established with grant funding from the Northern Ontario Heritage Fund Corporation. In addition to supporting exploration efforts at Great Bear, the partnership is expected to play an important role in training and developing the future workforce through graduate students and field assistants, helping build the skilled talent base in the region and create opportunities for local communities.
In Chile, Kinross advanced its commitment to community well-being by partnering with public and private stakeholders to finance the development of a new angiography unit at the Copiapó Regional Hospital. The investment addresses a critical healthcare gap in the Atacama region, which previously lacked access to advanced cardiovascular diagnostic and treatment capabilities, and is expected to improve timely care and health outcomes for thousands of residents.
Kinross plans to publish its 2025 Sustainability Report in the second quarter, providing a transparent account of its Sustainability performance and outlining priorities in the year ahead and beyond.
Conference call details
In connection with this news release, Kinross will hold a conference call and audio webcast on April 30, 2026, at 8:00 a.m. EDT to discuss the results, followed by a question-and-answer session. To access the call, please dial:
Canada & US toll-free – (888) 596-4144; Conference ID: 9425112
Outside of Canada & US – +1 (646) 968-2525; Conference ID: 9425112
Replay (available up to 14 days after the call):
Canada & US toll-free – +1 (800) 770-2030; Conference ID: 9425112 #
Outside of Canada & US – +1 (609) 800-9909; Conference ID: 9425112 #
You may also access the conference call on a listen-only basis via webcast at our website www.kinross.com. The audio webcast will be archived on www.kinross.com.
Annual Meeting of Shareholders
Kinross’ Annual Meeting of Shareholders will be held on Thursday, April 30, 2026, at 10:00 a.m. EDT.
The meeting will be accessible online at: https://meetings.lumiconnect.com/400-541-772-335. The link to the meeting will also be accessible at www.kinross.com and will be archived for later use.
Voting and participation instructions for eligible shareholders are provided in the Company’s Notice of Annual Meeting of Shareholders and Management Information Circular.
This release should be read in conjunction with Kinross’ 2026 first-quarter unaudited Financial Statements and Management’s Discussion and Analysis report at www.kinross.com. Kinross’ 2026 first-quarter Financial Statements and Management’s Discussion and Analysis have been filed with Canadian securities regulators (available at www.sedarplus.ca) and furnished with the U.S. Securities and Exchange Commission (available at www.sec.gov). Kinross shareholders may obtain a copy of the financial statements free of charge upon request to the Company.
About Kinross Gold Corporation
Kinross is a Canadian-based global senior gold mining company with operations and projects in the United States, Brazil, Mauritania, Chile and Canada. Our focus is on delivering value based on the core principles of responsible mining, operational excellence, disciplined growth, and balance sheet strength. Kinross maintains listings on the Toronto Stock Exchange (symbol: K) and the New York Stock Exchange (symbol: KGC).
Media Contact
Samantha Sheffield
Director, Corporate Communications
phone: 416-365-3034
Samantha.Sheffield@Kinross.com
Investor Relations Contact
David Shaver
Executive Vice-President, Investor Relations & Communications
phone: 416-365-2854
InvestorRelations@Kinross.com
Review of operations
| Three months ended March 31, | Gold equivalent ounces |
|||||||||||||||||
| Produced | Sold | Production cost of sales ($millions) | Production cost of sales/equivalent ounce sold | |||||||||||||||
| 2026 | 2025 | 2026 | 2025 | 2026 | 2025 | 2026 | 2025 | |||||||||||
| Tasiast | 130,014 | 137,629 | 131,679 | 129,493 | 130.3 | 105.0 | 990 | 811 | ||||||||||
| Paracatu | 160,583 | 146,639 | 158,849 | 146,855 | 177.7 | 139.6 | 1,119 | 951 | ||||||||||
| La Coipa | 54,211 | 52,315 | 53,737 | 55,870 | 82.0 | 64.1 | 1,526 | 1,147 | ||||||||||
| Fort Knox | 102,372 | 112,054 | 96,218 | 112,110 | 174.8 | 131.8 | 1,817 | 1,176 | ||||||||||
| Round Mountain | 26,200 | 35,686 | 26,084 | 35,960 | 72.4 | 57.0 | 2,776 | 1,585 | ||||||||||
| Bald Mountain | 27,561 | 45,538 | 27,561 | 43,801 | 53.3 | 49.2 | 1,934 | 1,123 | ||||||||||
| United States Total | 156,133 | 193,278 | 149,863 | 191,871 | 300.5 | 238.0 | 2,005 | 1,240 | ||||||||||
| Less: Manh Choh non-controlling interest (30%) | (8,378 | ) | (17,773 | ) | (8,273 | ) | (17,525 | ) | (19.9 | ) | (20.7 | ) | ||||||
| United States Attributable Total | 147,755 | 175,505 | 141,590 | 174,346 | 280.6 | 217.3 | 1,982 | 1,246 | ||||||||||
| Operations Total | 500,941 | 529,861 | 494,128 | 524,089 | 690.5 | 546.7 | 1,397 | 1,043 | ||||||||||
| Attributable Total | 492,563 | 512,088 | 485,855 | 506,564 | 670.6 | 526.0 | 1,380 | 1,038 | ||||||||||
Consolidated balance sheets
| (expressed in millions of U.S. dollars, except share amounts) | |||||||||
| As at | |||||||||
| March 31, | December 31, | ||||||||
| 2026 | 2025 | ||||||||
| Assets | |||||||||
| Current assets | |||||||||
| Cash and cash equivalents | $ | 2,185.0 | $ | 1,742.3 | |||||
| Restricted cash | 15.3 | 13.5 | |||||||
| Accounts receivable and prepaid assets | 129.0 | 145.8 | |||||||
| Inventories | 1,315.2 | 1,370.3 | |||||||
| Other current assets | 30.5 | 16.6 | |||||||
| 3,675.0 | 3,288.5 | ||||||||
| Non-current assets | |||||||||
| Property, plant and equipment | 8,310.0 | 8,289.4 | |||||||
| Long-term investments | 115.7 | 99.3 | |||||||
| Other long-term assets | 769.6 | 708.9 | |||||||
| Deferred tax assets | 13.5 | 25.0 | |||||||
| Total assets | $ | 12,883.8 | $ | 12,411.1 | |||||
| Liabilities | |||||||||
| Current liabilities | |||||||||
| Accounts payable and accrued liabilities | $ | 665.2 | $ | 716.4 | |||||
| Current income tax payable | 543.1 | 595.7 | |||||||
| Current portion of provisions | 75.2 | 74.2 | |||||||
| Other current liabilities | 9.5 | 13.3 | |||||||
| 1,293.0 | 1,399.6 | ||||||||
| Non-current liabilities | |||||||||
| Long-term debt | 738.5 | 738.2 | |||||||
| Provisions | 977.7 | 976.6 | |||||||
| Other long-term liabilities | 51.5 | 64.8 | |||||||
| Deferred tax liabilities | 602.2 | 537.8 | |||||||
| Total liabilities | $ | 3,662.9 | $ | 3,717.0 | |||||
| Equity | |||||||||
| Common shareholders’ equity | |||||||||
| Common share capital | $ | 4,363.8 | $ | 4,382.0 | |||||
| Contributed surplus | 9,851.3 | 10,137.6 | |||||||
| Accumulated deficit | (5,148.2 | ) | (5,943.3 | ) | |||||
| Accumulated other comprehensive income (loss) | 31.4 | (0.3 | ) | ||||||
| Total common shareholders’ equity | 9,098.3 | 8,576.0 | |||||||
| Non-controlling interests | 122.6 | 118.1 | |||||||
| Total equity | $ | 9,220.9 | $ | 8,694.1 | |||||
| Total liabilities and equity | $ | 12,883.8 | $ | 12,411.1 | |||||
| Common shares | |||||||||
| Authorized | Unlimited | Unlimited | |||||||
| Issued and outstanding | 1,194,109,463 | 1,199,843,037 | |||||||
Consolidated statements of operations
| (expressed in millions of U.S. dollars, except per share amounts) | |||||||||
| Three months ended | |||||||||
| March 31, | March 31, | ||||||||
| 2026 | 2025 | ||||||||
| Revenue | |||||||||
| Metal sales | $ | 2,407.7 | $ | 1,497.5 | |||||
| Cost of sales | |||||||||
| Production cost of sales | 690.5 | 546.7 | |||||||
| Depreciation, depletion and amortization | 275.7 | 288.4 | |||||||
| Total cost of sales | 966.2 | 835.1 | |||||||
| Gross profit | 1,441.5 | 662.4 | |||||||
| Other operating expense | 20.3 | 14.0 | |||||||
| Exploration and business development | 38.2 | 42.3 | |||||||
| General and administrative | 44.9 | 35.7 | |||||||
| Operating earnings | 1,338.1 | 570.4 | |||||||
| Other expense – net | (13.3 | ) | (13.2 | ) | |||||
| Finance income | 15.4 | 4.2 | |||||||
| Finance expense | (19.0 | ) | (35.2 | ) | |||||
| Earnings before tax | 1,321.2 | 526.2 | |||||||
| Income tax expense | (465.2 | ) | (136.8 | ) | |||||
| Net earnings | $ | 856.0 | $ | 389.4 | |||||
| Net earnings attributable to: | |||||||||
| Non-controlling interests | $ | 13.0 | $ | 21.4 | |||||
| Common shareholders | $ | 843.0 | $ | 368.0 | |||||
| Earnings per share attributable to common shareholders | |||||||||
| Basic | $ | 0.70 | $ | 0.30 | |||||
| Diluted | $ | 0.70 | $ | 0.30 | |||||
Consolidated statements of cash flows
| (expressed in millions of U.S. dollars) | |||||||||
| Three months ended | |||||||||
| March 31, | March 31, | ||||||||
| 2026 | 2025 | ||||||||
| Net inflow (outflow) of cash related to the following activities: | |||||||||
| Operating: | |||||||||
| Net earnings | $ | 856.0 | $ | 389.4 | |||||
| Adjustments to reconcile net earnings to net cash provided from operating activities: | |||||||||
| Depreciation, depletion and amortization | 275.7 | 288.4 | |||||||
| Share-based compensation expense | 6.6 | 4.6 | |||||||
| Finance expense – net | 3.6 | 31.0 | |||||||
| Income tax expense | 465.2 | 136.8 | |||||||
| Foreign exchange losses | 7.5 | 5.5 | |||||||
| Other | (7.3 | ) | (21.0 | ) | |||||
| Reclamation payments, net of reclamation (recovery) expense | (10.1 | ) | (6.2 | ) | |||||
| Changes in working capital: | |||||||||
| Accounts receivable and other assets | 6.9 | 11.4 | |||||||
| Inventories | 35.8 | (38.4 | ) | ||||||
| Accounts payable and accrued liabilities | (51.8 | ) | (16.1 | ) | |||||
| Cash flow provided from operating activities | 1,588.1 | 785.4 | |||||||
| Income taxes paid | (448.6 | ) | (178.3 | ) | |||||
| Net cash flow provided from operating activities | 1,139.5 | 607.1 | |||||||
| Investing: | |||||||||
| Additions to property, plant and equipment | (283.2 | ) | (207.7 | ) | |||||
| Interest paid capitalized to property, plant and equipment | (7.1 | ) | (13.5 | ) | |||||
| Additions to long-term investments and other assets | (25.3 | ) | (9.1 | ) | |||||
| Increase in restricted cash – net | (1.8 | ) | (1.7 | ) | |||||
| Interest received and other – net | 15.1 | 4.2 | |||||||
| Net cash flow used in investing activities | (302.3 | ) | (227.8 | ) | |||||
| Financing: | |||||||||
| Repayment of debt | – | (200.0 | ) | ||||||
| Interest paid | (17.2 | ) | (24.0 | ) | |||||
| Payment of lease liabilities | (2.2 | ) | (1.5 | ) | |||||
| Distributions paid to non-controlling interest | (9.0 | ) | (24.0 | ) | |||||
| Dividends paid to common shareholders | (47.9 | ) | (36.9 | ) | |||||
| Payments for employee taxes withheld from restricted share unit releases | (55.3 | ) | (10.0 | ) | |||||
| Repurchase and cancellation of shares | (250.1 | ) | – | ||||||
| Taxes paid on repurchase of shares | (12.1 | ) | – | ||||||
| Net cash flow used in financing activities | (393.8 | ) | (296.4 | ) | |||||
| Effect of exchange rate changes on cash and cash equivalents | (0.7 | ) | 0.2 | ||||||
| Increase in cash and cash equivalents | 442.7 | 83.1 | |||||||
| Cash and cash equivalents, beginning of period | 1,742.3 | 611.5 | |||||||
| Cash and cash equivalents, end of period | $ | 2,185.0 | $ | 694.6 | |||||
| Operating Summary | |||||||||||||||||||
| Mine | Period | Tonnes Ore Mined | Ore Processed (Milled) | Ore Processed (Heap Leach) | Grade (Mill) | Grade (Heap Leach) | Recovery (a)(b) | Gold Eq Production(c) | Gold Eq Sales(c) | Production cost of sales | Production cost of sales/oz(d) | Cap Ex – sustaining(e) | Total Cap Ex (e) | ||||||
| (‘000 tonnes) | (‘000 tonnes) | (‘000 tonnes) | (g/t) | (g/t) | (%) | (ounces) | (ounces) | ($ millions) | ($/ounce) | ($ millions) | ($ millions) | ||||||||
| West Africa | Tasiast | Q1 2026 | 3,495 | 2,092 | – | 2.30 | – | 94 | % | 130,014 | 131,679 | $ | 130.3 | $ | 990 | $ | 10.8 | $ | 60.0 |
| Q4 2025 | 3,120 | 2,252 | – | 1.87 | – | 94 | % | 125,625 | 118,912 | $ | 119.2 | $ | 1,002 | $ | 28.6 | $ | 80.5 | ||
| Q3 2025 | 1,685 | 2,181 | – | 1.78 | – | 94 | % | 120,934 | 116,251 | $ | 103.4 | $ | 889 | $ | 47.6 | $ | 102.0 | ||
| Q2 2025 | 1,921 | 1,730 | – | 2.11 | – | 95 | % | 119,241 | 121,745 | $ | 102.6 | $ | 843 | $ | 23.1 | $ | 89.7 | ||
| Q1 2025 | 1,812 | 1,932 | – | 2.15 | – | 95 | % | 137,629 | 129,493 | $ | 105.0 | $ | 811 | $ | 13.7 | $ | 80.1 | ||
| Americas | Paracatu | Q1 2026 | 10,272 | 12,507 | – | 0.41 | – | 85 | % | 160,583 | 158,849 | $ | 177.7 | $ | 1,119 | $ | 22.2 | $ | 25.8 |
| Q4 2025 | 10,929 | 12,395 | – | 0.45 | – | 83 | % | 155,048 | 154,565 | $ | 165.0 | $ | 1,068 | $ | 67.6 | $ | 67.6 | ||
| Q3 2025 | 12,958 | 13,214 | – | 0.44 | – | 82 | % | 150,367 | 149,903 | $ | 139.9 | $ | 933 | $ | 58.2 | $ | 58.2 | ||
| Q2 2025 | 13,497 | 14,527 | – | 0.39 | – | 82 | % | 149,264 | 148,787 | $ | 142.6 | $ | 958 | $ | 38.4 | $ | 38.4 | ||
| Q1 2025 | 13,318 | 12,507 | – | 0.43 | – | 83 | % | 146,639 | 146,855 | $ | 139.6 | $ | 951 | $ | 24.4 | $ | 24.4 | ||
| La Coipa(f) | Q1 2026 | 580 | 972 | – | 1.64 | – | 74 | % | 54,211 | 53,737 | $ | 82.0 | $ | 1,526 | $ | 19.9 | $ | 21.7 | |
| Q4 2025 | 1,219 | 1,203 | – | 2.42 | – | 74 | % | 67,319 | 71,419 | $ | 80.7 | $ | 1,130 | $ | 31.7 | $ | 31.7 | ||
| Q3 2025 | 1,006 | 932 | – | 2.36 | – | 76 | % | 57,997 | 57,544 | $ | 69.0 | $ | 1,199 | $ | 18.5 | $ | 18.5 | ||
| Q2 2025 | 580 | 911 | – | 1.77 | – | 78 | % | 54,139 | 50,400 | $ | 70.4 | $ | 1,397 | $ | 25.0 | $ | 25.0 | ||
| Q1 2025 | 1,265 | 971 | – | 2.19 | – | 80 | % | 52,315 | 55,870 | $ | 64.1 | $ | 1,147 | $ | 15.6 | $ | 15.6 | ||
| Fort Knox (100%)(g) | Q1 2026 | 9,523 | 1,154 | 7,314 | 1.45 | 0.28 | 86 | % | 102,372 | 96,218 | $ | 174.8 | $ | 1,817 | $ | 24.1 | $ | 24.1 | |
| Q4 2025 | 11,056 | 1,645 | 8,805 | 1.02 | 0.23 | 88 | % | 71,523 | 74,294 | $ | 125.8 | $ | 1,693 | $ | 38.0 | $ | 38.0 | ||
| Q3 2025 | 8,140 | 1,511 | 6,538 | 1.86 | 0.23 | 90 | % | 112,181 | 117,500 | $ | 159.7 | $ | 1,359 | $ | 45.0 | $ | 45.0 | ||
| Q2 2025 | 7,639 | 1,636 | 5,529 | 1.72 | 0.23 | 88 | % | 115,064 | 113,200 | $ | 141.3 | $ | 1,248 | $ | 43.0 | $ | 43.0 | ||
| Q1 2025 | 6,530 | 1,071 | 4,790 | 2.77 | 0.19 | 91 | % | 112,054 | 112,110 | $ | 131.8 | $ | 1,176 | $ | 28.2 | $ | 28.2 | ||
| Fort Knox (attributable)(g) | Q1 2026 | 9,463 | 1,103 | 7,314 | 1.31 | 0.28 | 85 | % | 93,994 | 87,945 | $ | 154.9 | $ | 1,761 | $ | 19.8 | $ | 19.8 | |
| Q4 2025 | 11,001 | 1,597 | 8,805 | 0.93 | 0.23 | 87 | % | 65,434 | 67,882 | $ | 113.6 | $ | 1,673 | $ | 31.5 | $ | 31.5 | ||
| Q3 2025 | 8,056 | 1,425 | 6,538 | 1.55 | 0.23 | 89 | % | 95,742 | 100,878 | $ | 138.4 | $ | 1,372 | $ | 40.4 | $ | 40.4 | ||
| Q2 2025 | 7,535 | 1,567 | 5,529 | 1.47 | 0.23 | 87 | % | 97,561 | 95,277 | $ | 118.8 | $ | 1,247 | $ | 38.7 | $ | 38.7 | ||
| Q1 2025 | 6,445 | 982 | 4,790 | 2.35 | 0.19 | 90 | % | 94,281 | 94,585 | $ | 111.1 | $ | 1,175 | $ | 24.6 | $ | 24.6 | ||
| Round Mountain | Q1 2026 | 790 | 953 | 513 | 0.37 | 0.21 | 52 | % | 26,200 | 26,084 | $ | 72.4 | $ | 2,776 | $ | 4.9 | $ | 53.9 | |
| Q4 2025 | 737 | 966 | 1,110 | 0.49 | 0.29 | 67 | % | 31,754 | 31,641 | $ | 86.6 | $ | 2,737 | $ | 8.6 | $ | 41.5 | ||
| Q3 2025 | 1,659 | 914 | 1,113 | 0.66 | 0.32 | 72 | % | 37,297 | 37,274 | $ | 78.1 | $ | 2,095 | $ | 4.5 | $ | 33.0 | ||
| Q2 2025 | 2,881 | 856 | 1,682 | 0.72 | 0.30 | 80 | % | 38,665 | 37,864 | $ | 52.1 | $ | 1,376 | $ | 5.7 | $ | 32.8 | ||
| Q1 2025 | 1,927 | 856 | 2,163 | 0.66 | 0.27 | 77 | % | 35,686 | 35,960 | $ | 57.0 | $ | 1,585 | $ | 2.8 | $ | 29.6 | ||
| Bald Mountain | Q1 2026 | 3,985 | – | 3,985 | – | 0.30 | nm | 27,561 | 27,561 | $ | 53.3 | $ | 1,934 | $ | 6.9 | $ | 39.7 | ||
| Q4 2025 | 3,165 | – | 3,165 | – | 0.30 | nm | 38,402 | 37,141 | $ | 55.4 | $ | 1,492 | $ | 13.1 | $ | 51.6 | |||
| Q3 2025 | 2,182 | – | 2,182 | – | 0.31 | nm | 41,525 | 42,261 | $ | 48.5 | $ | 1,148 | $ | 5.3 | $ | 27.9 | |||
| Q2 2025 | 1,578 | – | 1,578 | – | 1.07 | nm | 53,704 | 54,227 | $ | 59.4 | $ | 1,095 | $ | 12.7 | $ | 40.4 | |||
| Q1 2025 | 5,803 | – | 5,803 | – | 0.35 | nm | 45,538 | 43,801 | $ | 49.2 | $ | 1,123 | $ | 6.9 | $ | 17.8 | |||
| (a) | Due to the nature of heap leach operations, recovery rates at Bald Mountain cannot be accurately measured on a quarterly basis. Recovery rates at Fort Knox and Round Mountain represent mill recovery only. |
| (b) | “nm” means not meaningful. |
| (c) | Gold equivalent ounces include silver ounces produced and sold converted to a gold equivalent based on the ratio of the average spot market prices for the commodities for each period. The ratios for the quarters presented are as follows: Q1 2026: 57.79:1; Q4 2025: 76.34:1; Q3 2025: 87.73:1; Q2 2025: 97.41:1; Q1 2025: 89.69:1. |
| (d) | “Production cost of sales per equivalent ounce sold” is defined as production cost of sales divided by total gold equivalent ounces sold. |
| (e) | “Total Cap Ex” is “Additions to property, plant and equipment” on the interim condensed consolidated statements of cash flows. “Cap Ex – sustaining” is a non-GAAP financial measure. The definition and reconciliation of this non-GAAP financial measure is included on pages 22 and 23 of this news release. |
| (f) | La Coipa silver grade and recovery were as follows: Q1 2026: 35.03 g/t, 39%; Q4 2025: 33.21 g/t, 41%; Q3 2025: 41.34 g/t, 49%; Q2 2025: 28.89 g/t, 50%; Q1 2025: 31.97 g/t, 60%. |
| (g) | The Fort Knox segment is composed of Fort Knox and Manh Choh. Manh Choh tonnes of ore processed and grade were as follows: Q1 2026: 170,077 tonnes, 4.51 g/t; Q4 2025: 158,016 tonnes, 4.08 g/t; Q3 2025: 286,496 tonnes, 7.05 g/t; Q2 2025: 231,451 tonnes, 7.39 g/t; Q1 2025: 294,238 tonnes, 7.39 g/t. The attributable results for Fort Knox include 100% of Fort Knox and 70% of Manh Choh. |
Adjusted Net Earnings and Adjusted Net Earnings per Share
Adjusted net earnings and adjusted net earnings per share are non-GAAP financial measures and ratios which determine the performance of the Company, excluding certain impacts which the Company believes are not reflective of the Company’s underlying performance for the reporting period, such as the impact of foreign exchange gains and losses, reassessment of prior year taxes and/or taxes otherwise not related to the current period, impairment charges (reversals), gains and losses and other one-time costs related to acquisitions, dispositions and other transactions, and non-hedge derivative gains and losses. Although some of the items are recurring, the Company believes that they are not reflective of the underlying operating performance of its current business and are not necessarily indicative of future operating results. Management believes that these measures and ratios, which are used internally to assess performance and in planning and forecasting future operating results, provide investors with the ability to better evaluate underlying performance, particularly since the excluded items are typically not included in public guidance. However, adjusted net earnings and adjusted net earnings per share measures and ratios are not necessarily indicative of net earnings and earnings per share measures and ratios as determined under IFRS.
The following table provides a reconciliation of net earnings to adjusted net earnings for the periods presented:
| (expressed in millions of U.S. dollars, except per share amounts) | Three months ended | ||||||
| March 31, | |||||||
| 2026 | 2025 | ||||||
| Net earnings attributable to common shareholders – as reported | $ | 843.0 | $ | 368.0 | |||
| Adjusting items: | |||||||
| Foreign exchange losses | 6.0 | 7.7 | |||||
| Foreign exchange gains on translation of tax basis and foreign exchange on deferred income taxes within income tax expense | (4.5 | ) | (5.9 | ) | |||
| Taxes in respect of prior periods | 2.2 | (7.9 | ) | ||||
| Costs in connection with conveyor belt repairs | 11.1 | – | |||||
| Other(a) | (1.6 | ) | 1.7 | ||||
| Tax effects of the above adjustments | (2.1 | ) | 0.4 | ||||
| 11.1 | (4.0 | ) | |||||
| Adjusted net earnings | $ | 854.1 | $ | 364.0 | |||
| Weighted average number of common shares outstanding – Basic | 1,199.5 | 1,229.6 | |||||
| Adjusted net earnings per share | $ | 0.71 | $ | 0.30 | |||
| Basic earnings per share attributable to common shareholders – as reported | $ | 0.70 | $ | 0.30 | |||
| (a) | Other includes various impacts, such as one-time costs and credits at sites, and gains and losses on hedges, which the Company believes are not reflective of the Company’s underlying performance for the reporting period. |
Attributable Free Cash Flow
Attributable free cash flow is a non-GAAP financial measure and is defined as net cash flow provided from operating activities less attributable capital expenditures and non-controlling interest included in net cash flows provided from operating activities. The Company believes that this measure, which is used internally to evaluate the Company’s underlying cash generation performance and the ability to repay creditors and return cash to shareholders, provides investors with the ability to better evaluate the Company’s underlying performance. However, this measure is not necessarily indicative of operating earnings or net cash flow provided from operating activities as determined under IFRS.
The following table provides a reconciliation of attributable free cash flow for the periods presented:
| (expressed in millions of U.S. dollars) | Three months ended | ||||||
| March 31, | |||||||
| 2026 | 2025 | ||||||
| Net cash flow provided from operating activities – as reported | $ | 1,139.5 | $ | 607.1 | |||
| Adjusting items: | |||||||
| Attributable(a) capital expenditures | (278.9 | ) | (204.1 | ) | |||
| Non-controlling interest(b) cash flow from operating activities | (23.1 | ) | (22.2 | ) | |||
| Attributable(a) free cash flow | $ | 837.5 | $ | 380.8 | |||
See pages 23 and 24 for details of the footnotes referenced within the table above.
Attributable Adjusted Operating Cash Flow
Attributable adjusted operating cash flow is a non-GAAP financial measure and is defined as net cash flow provided from operating activities excluding changes in working capital, certain impacts which the Company believes are not reflective of the Company’s regular operating cash flow, and net cash flows provided from operating activities, net of working capital changes, relating to non-controlling interests. Working capital is excluded given that numerous factors can result in it being volatile. The Company uses attributable adjusted operating cash flow internally as a measure of the underlying operating cash flow performance and future operating cash flow-generating capability of the Company. However, the attributable adjusted operating cash flow measure is not necessarily indicative of net cash flow provided from operating activities as determined under IFRS.
The following table provides a reconciliation of attributable adjusted operating cash flow for the periods presented:
| (expressed in millions of U.S. dollars) | Three months ended | ||||||
| March 31, | |||||||
| 2026 | 2025(m) | ||||||
| Net cash flow provided from operating activities – as reported | $ | 1,139.5 | $ | 607.1 | |||
| Adjusting items: | |||||||
| Working capital changes: | |||||||
| Accounts receivable and other assets | (6.9 | ) | (11.4 | ) | |||
| Inventories | (35.8 | ) | 38.4 | ||||
| Accounts payable and accrued liabilities | 51.8 | 16.1 | |||||
| 1,148.6 | 650.2 | ||||||
| Non-controlling interest(b) cash flow from operating activities, net of working capital changes | (19.3 | ) | (29.9 | ) | |||
| Attributable(a) adjusted operating cash flow | $ | 1,129.3 | $ | 620.3 | |||
See pages 23 and 24 for details of the footnotes referenced within the table above.
Attributable Average Realized Gold Price per Ounce
Attributable average realized gold price per ounce is a non-GAAP ratio which calculates the average price realized from gold sales attributable to the Company. The Company believes that this measure provides a more accurate measure with which to compare the Company’s gold sales performance to market gold prices. The following table provides a reconciliation of attributable average realized gold price per ounce for the periods presented:
| (expressed in millions of U.S. dollars, except ounces and average realized gold price per ounce) | Three months ended | ||||||
| March 31, | |||||||
| 2026 | 2025 | ||||||
| Metal sales – as reported | $ | 2,407.7 | $ | 1,497.5 | |||
| Less: silver revenue(c) | (56.7 | ) | (22.5 | ) | |||
| Less: non-controlling interest(b) gold revenue | (38.9 | ) | (50.1 | ) | |||
| Attributable(a) gold revenue | $ | 2,312.1 | $ | 1,424.9 | |||
| Gold ounces sold | 482,472 | 516,268 | |||||
| Less: non-controlling interest(b) gold ounces sold | (8,013 | ) | (17,383 | ) | |||
| Attributable(a) gold ounces sold | 474,459 | 498,885 | |||||
| Attributable(a) average realized gold price per ounce | $ | 4,873 | $ | 2,856 | |||
| Average realized gold price per ounce(d) | $ | 4,873 | $ | 2,857 | |||
See pages 23 and 24 for details of the footnotes referenced within the table above.
Attributable Production Cost of Sales per Equivalent Ounce Sold
Production cost of sales per equivalent ounce sold is defined as production cost of sales, as reported on the consolidated statement of operations, divided by the total number of gold equivalent ounces sold. This measure converts the Company’s non-gold production into gold equivalent ounces and credits it to total production.
Attributable production cost of sales per equivalent ounce sold is a non-GAAP ratio and is defined as attributable production cost of sales divided by the attributable number of gold equivalent ounces sold. This measure converts the Company’s attributable non-gold production into gold equivalent ounces and credits it to total attributable production. Management uses this measure to monitor and evaluate the performance of its operating properties that are attributable to its shareholders.
The following table provides a reconciliation of production cost of sales and attributable production cost of sales per equivalent ounce sold for the periods presented:
| (expressed in millions of U.S. dollars, except ounces and production cost of sales per equivalent ounce) | Three months ended | ||||||
| March 31, | |||||||
| 2026 | 2025 | ||||||
| Production cost of sales – as reported | $ | 690.5 | $ | 546.7 | |||
| Less: non-controlling interest(b) production cost of sales | (19.9 | ) | (20.7 | ) | |||
| Attributable(a) production cost of sales | $ | 670.6 | $ | 526.0 | |||
| Gold equivalent ounces sold | 494,128 | 524,089 | |||||
| Less: non-controlling interest(b) gold equivalent ounces sold | (8,273 | ) | (17,525 | ) | |||
| Attributable(a) gold equivalent ounces sold | 485,855 | 506,564 | |||||
| Attributable(a) production cost of sales per equivalent ounce sold | $ | 1,380 | $ | 1,038 | |||
| Production cost of sales per equivalent ounce sold(e) | $ | 1,397 | $ | 1,043 | |||
See pages 23 and 24 for details of the footnotes referenced within the table above.
Attributable Production Cost of Sales per Ounce Sold on a By-Product Basis
Attributable production cost of sales per ounce sold on a by-product basis is a non-GAAP ratio which calculates the Company’s non-gold production as a credit against its per ounce production costs, rather than converting its non-gold production into gold equivalent ounces and crediting it to total production, as is the case in co-product accounting. Management believes that this ratio provides investors with the ability to better evaluate Kinross’ production cost of sales per ounce on a comparable basis with other major gold producers who routinely calculate their cost of sales per ounce using by-product accounting rather than co-product accounting.
The following table provides a reconciliation of attributable production cost of sales per ounce sold on a by-product basis for the periods presented:
| (expressed in millions of U.S. dollars, except ounces and production cost of sales per ounce) | Three months ended | ||||||
| March 31, | |||||||
| 2026 | 2025 | ||||||
| Production cost of sales – as reported | $ | 690.5 | $ | 546.7 | |||
| Less: non-controlling interest(b) production cost of sales | (19.9 | ) | (20.7 | ) | |||
| Less: attributable(a) impact of silver by-product(n) | (55.5 | ) | (22.1 | ) | |||
| Attributable(a) production cost of sales on a by-product basis | $ | 615.1 | $ | 503.9 | |||
| Gold ounces sold | 482,472 | 516,268 | |||||
| Less: non-controlling interest(b) gold ounces sold | (8,013 | ) | (17,383 | ) | |||
| Attributable(a) gold ounces sold | 474,459 | 498,885 | |||||
| Attributable(a) production cost of sales per ounce sold on a by-product basis | $ | 1,296 | $ | 1,010 | |||
| Production cost of sales per equivalent ounce sold(e) | $ | 1,397 | $ | 1,043 | |||
See pages 23 and 24 for details of the footnotes referenced within the table above.
Attributable All-In Sustaining Cost and All-In Cost per Ounce Sold on a By-Product Basis
Attributable all-in sustaining cost and all-in cost per ounce sold on a by-product basis are non-GAAP financial measures and ratios, as applicable, calculated based on guidance published by the World Gold Council. The WGC is a market development organization for the gold industry and is an association whose membership comprises leading gold mining companies including Kinross. Although the WGC is not a mining industry regulatory organization, it worked closely with its member companies to develop these metrics. Adoption of the all-in sustaining cost and all-in cost metrics is voluntary and not necessarily standard, and therefore, these measures and ratios presented by the Company may not be comparable to similar measures and ratios presented by other issuers. The Company believes that the all-in sustaining cost and all-in cost measures complement existing measures and ratios reported by Kinross.
All-in sustaining cost includes both operating and capital costs required to sustain gold production on an ongoing basis. The value of silver sold is deducted from the total production cost of sales as it is considered residual production, i.e. a by-product. Sustaining operating costs represent expenditures incurred at current operations that are considered necessary to maintain current production. Sustaining capital represents capital expenditures at existing operations comprising mine development costs, including capitalized development, and ongoing replacement of mine equipment and other capital facilities, and does not include capital expenditures for major growth projects or enhancement capital for significant infrastructure improvements at existing operations.
All-in cost is comprised of all-in sustaining cost as well as operating expenditures incurred at locations with no current operation, or costs related to other non-sustaining activities, and capital expenditures for major growth projects or enhancement capital for significant infrastructure improvements at existing operations.
Attributable all-in sustaining cost and all-in cost per ounce sold on a by-product basis are calculated by adjusting production cost of sales, as reported on the consolidated statements of operations, as follows:
| (expressed in millions of U.S. dollars, except ounces and costs per ounce) | Three months ended | ||||||
| March 31, | |||||||
| 2026 | 2025 | ||||||
| Production cost of sales – as reported | $ | 690.5 | $ | 546.7 | |||
| Less: non-controlling interest(b) production cost of sales | (19.9 | ) | (20.7 | ) | |||
| Less: attributable(a) impact of silver by-product(n) | (55.5 | ) | (22.1 | ) | |||
| Attributable(a) production cost of sales on a by-product basis | $ | 615.1 | $ | 503.9 | |||
| Adjusting items on an attributable(a) basis: | |||||||
| General and administrative(f) | 44.9 | 35.7 | |||||
| Other operating expense – sustaining(g) | 0.2 | 0.2 | |||||
| Reclamation and remediation – sustaining(h) | 23.1 | 22.3 | |||||
| Exploration and business development – sustaining(i) | 16.1 | 12.5 | |||||
| Additions to property, plant and equipment – sustaining(j) | 84.6 | 88.2 | |||||
| Lease payments – sustaining(k) | 2.0 | 1.3 | |||||
| All-in Sustaining Cost on a by-product basis – attributable(a) | $ | 786.0 | $ | 664.1 | |||
| Adjusting items on an attributable(a) basis: | |||||||
| Other operating expense – non-sustaining(g) | 8.5 | 16.2 | |||||
| Reclamation and remediation – non-sustaining(h) | 2.1 | 2.3 | |||||
| Exploration and business development – non-sustaining(i) | 21.7 | 29.4 | |||||
| Additions to property, plant and equipment – non-sustaining(j) | 194.3 | 115.9 | |||||
| Lease payments – non-sustaining(k) | 0.2 | 0.2 | |||||
| All-in Cost on a by-product basis – attributable(a) | $ | 1,012.8 | $ | 828.1 | |||
| Gold ounces sold | 482,472 | 516,268 | |||||
| Less: non-controlling interest(b) gold ounces sold | (8,013 | ) | (17,383 | ) | |||
| Attributable(a) gold ounces sold | 474,459 | 498,885 | |||||
| Attributable(a) all-in sustaining cost per ounce sold on a by-product basis | $ | 1,657 | $ | 1,331 | |||
| Attributable(a) all-in cost per ounce sold on a by-product basis | $ | 2,135 | $ | 1,660 | |||
| Production cost of sales per equivalent ounce sold(e) | $ | 1,397 | $ | 1,043 | |||
See pages 23 and 24 for details of the footnotes referenced within the table above.
Attributable All-In Sustaining Cost and All-In Cost per Equivalent Ounce Sold
The Company also assesses its attributable all-in sustaining cost and all-in cost on a gold equivalent ounce basis. Under these non-GAAP financial measures and ratios, the Company’s production of silver is converted into gold equivalent ounces and credited to total production.
Attributable all-in sustaining cost and all-in cost per equivalent ounce sold are calculated by adjusting production cost of sales, as reported on the consolidated statements of operations, as follows:
| (expressed in millions of U.S. dollars, except ounces and costs per ounce) | Three months ended | ||||||
| March 31, | |||||||
| 2026 | 2025 | ||||||
| Production cost of sales – as reported | $ | 690.5 | $ | 546.7 | |||
| Less: non-controlling interest(b) production cost of sales | (19.9 | ) | (20.7 | ) | |||
| Attributable(a) production cost of sales | $ | 670.6 | $ | 526.0 | |||
| Adjusting items on an attributable(a) basis: | |||||||
| General and administrative(f) | 44.9 | 35.7 | |||||
| Other operating expense – sustaining(g) | 0.2 | 0.2 | |||||
| Reclamation and remediation – sustaining(h) | 23.1 | 22.3 | |||||
| Exploration and business development – sustaining(i) | 16.1 | 12.5 | |||||
| Additions to property, plant and equipment – sustaining(j) | 84.6 | 88.2 | |||||
| Lease payments – sustaining(k) | 2.0 | 1.3 | |||||
| All-in Sustaining Cost – attributable(a) | $ | 841.5 | $ | 686.2 | |||
| Adjusting items on an attributable(a) basis: | |||||||
| Other operating expense – non-sustaining(g) | 8.5 | 16.2 | |||||
| Reclamation and remediation – non-sustaining(h) | 2.1 | 2.3 | |||||
| Exploration and business development – non-sustaining(i) | 21.7 | 29.4 | |||||
| Additions to property, plant and equipment – non-sustaining(j) | 194.3 | 115.9 | |||||
| Lease payments – non-sustaining(k) | 0.2 | 0.2 | |||||
| All-in Cost – attributable(a) | $ | 1,068.3 | $ | 850.2 | |||
| Gold equivalent ounces sold | 494,128 | 524,089 | |||||
| Less: non-controlling interest(b) gold equivalent ounces sold | (8,273 | ) | (17,525 | ) | |||
| Attributable(a) gold equivalent ounces sold | 485,855 | 506,564 | |||||
| Attributable(a) all-in sustaining cost per equivalent ounce sold | $ | 1,732 | $ | 1,355 | |||
| Attributable(a) all-in cost per equivalent ounce sold | $ | 2,199 | $ | 1,678 | |||
| Production cost of sales per equivalent ounce sold(e) | $ | 1,397 | $ | 1,043 | |||
See pages 23 and 24 for details of the footnotes referenced within the table above.
Capital Expenditures and Attributable Capital Expenditures
Capital expenditures are classified as either sustaining capital expenditures or non-sustaining capital expenditures, depending on the nature of the expenditure. Sustaining capital expenditures typically represent capital expenditures at existing operations including capitalized exploration costs and capitalized development unless related to major projects, ongoing replacement of mine equipment and other capital facilities and other capital expenditures and is calculated as total additions to property, plant and equipment (as reported on the consolidated statements of cash flows), less non-sustaining capital expenditures. Non-sustaining capital expenditures represent capital expenditures for major projects, including major capital development projects at existing operations that are expected to materially benefit the operation, as well as enhancement capital for significant infrastructure improvements at existing operations. Management believes the distinction between sustaining capital expenditures and non-sustaining expenditures is a useful indicator of the purpose of capital expenditures and this distinction is an input into the calculation of attributable all-in sustaining costs per ounce and attributable all-in costs per ounce. The categorization of sustaining capital expenditures and non-sustaining capital expenditures is consistent with the definitions under the WGC all-in cost standard. Sustaining capital expenditures and non-sustaining capital expenditures are not defined under IFRS, however, the sum of these two measures total to additions to property, plant and equipment as disclosed under IFRS on the consolidated statements of cash flows.
Additions to property, plant and equipment per the consolidated statements of cash flows includes 100% of capital expenditures for Manh Choh. Attributable capital expenditures is a non-GAAP financial measure and includes Kinross’ 70% share of capital expenditures for Manh Choh. Management believes this to be a useful indicator of Kinross’ cash resources utilized for capital expenditures.
The following table provides a reconciliation of the classification of capital expenditures for the periods presented:
| (expressed in millions of U.S. dollars) | |||||||||||||||||||||
| Three months ended March 31, 2026 | Tasiast (Mauritania) | Paracatu (Brazil) | La Coipa (Chile) | Fort Knox(l)(USA) | Round Mountain (USA) | Bald Mountain (USA) | Total USA | Other | Total | ||||||||||||
| Sustaining capital expenditures | $ | 10.8 | $ | 22.2 | $ | 19.9 | $ | 24.1 | $ | 4.9 | $ | 6.9 | $ | 35.9 | $ | 0.1 | $ | 88.9 | |||
| Non-sustaining capital expenditures | 49.2 | 3.6 | 1.8 | – | 49.0 | 32.8 | 81.8 | 57.9 | 194.3 | ||||||||||||
| Additions to property, plant and equipment – per cash flow | $ | 60.0 | $ | 25.8 | $ | 21.7 | $ | 24.1 | $ | 53.9 | $ | 39.7 | $ | 117.7 | $ | 58.0 | $ | 283.2 | |||
| Less: Non-controlling interest(b) | $ | – | $ | – | $ | – | $ | (4.3 | ) | $ | – | $ | – | $ | (4.3 | ) | $ | – | $ | (4.3 | ) |
| Attributable(a) capital expenditures | $ | 60.0 | $ | 25.8 | $ | 21.7 | $ | 19.8 | $ | 53.9 | $ | 39.7 | $ | 113.4 | $ | 58.0 | $ | 278.9 | |||
| Three months ended March 31, 2025 | |||||||||||||||||||||
| Sustaining capital expenditures | $ | 13.7 | $ | 24.4 | $ | 15.6 | $ | 28.2 | $ | 2.8 | $ | 6.9 | $ | 37.9 | $ | 0.2 | $ | 91.8 | |||
| Non-sustaining capital expenditures | 66.4 | – | – | – | 26.8 | 10.9 | 37.7 | 11.8 | 115.9 | ||||||||||||
| Additions to property, plant and equipment – per cash flow | $ | 80.1 | $ | 24.4 | $ | 15.6 | $ | 28.2 | $ | 29.6 | $ | 17.8 | $ | 75.6 | $ | 12.0 | $ | 207.7 | |||
| Less: Non-controlling interest(b) | $ | – | $ | – | $ | – | $ | (3.6 | ) | $ | – | $ | – | $ | (3.6 | ) | $ | – | $ | (3.6 | ) |
| Attributable(a)capital expenditures | $ | 80.1 | $ | 24.4 | $ | 15.6 | $ | 24.6 | $ | 29.6 | $ | 17.8 | $ | 72.0 | $ | 12.0 | $ | 204.1 | |||
See pages 23 and 24 for details of the footnotes referenced within the tables above.
Endnotes
| (a) | “Attributable” measures and ratios include Kinross’ share of Manh Choh (70%) sales, costs, cash flows and capital expenditures. |
| (b) | “Non-controlling interest” represents the non-controlling interest portion in Manh Choh (30%) and other subsidiaries for which the Company’s interest is less than 100% for cash flow from operating activities, costs, sales and capital expenditures, as appropriate. |
| (c) | “Silver revenue” represents the portion of metal sales realized from the production of secondary or by-product metal (i.e. silver), which is produced as a by-product of the process used to produce gold and effectively reduces the cost of gold production. |
| (d) | “Average realized gold price per ounce” is defined as gold revenue divided by total gold ounces sold. |
| (e) | “Production cost of sales per equivalent ounce sold” is defined as production cost of sales divided by total gold equivalent ounces sold. |
| (f) | “General and administrative” expenses are as reported on the consolidated statements of operations, excluding certain impacts which the Company believes are not reflective of the Company’s underlying performance for the reporting period. General and administrative expenses are considered sustaining costs as they are required to be absorbed on a continuing basis for the effective operation and governance of the Company. |
| (g) | “Other operating expense – sustaining” is calculated as “Other operating expense” as reported on the consolidated statements of operations, less the non-controlling interest portion in Manh Choh (30%) and other subsidiaries for which the Company’s interest is less than 100% and other operating and reclamation and remediation expenses related to non-sustaining activities as well as other items not reflective of the underlying operating performance of the Company. Other operating expenses are classified as either sustaining or non-sustaining based on the type and location of the expenditure incurred. The majority of other operating expenses that are incurred at existing operations are considered costs necessary to sustain operations, and are therefore, classified as sustaining. Other operating expenses incurred at locations where there is no current operation or related to other non-sustaining activities are classified as non-sustaining. |
| (h) | “Reclamation and remediation – sustaining” is calculated as current period accretion related to reclamation and remediation obligations plus current period amortization of the corresponding reclamation and remediation assets, less the non-controlling interest portion in Manh Choh (30%) and other subsidiaries for which the Company’s interest is less than 100%, and is intended to reflect the periodic cost of reclamation and remediation for currently operating mines. Reclamation and remediation costs for development projects or closed mines are excluded from this amount and classified as non-sustaining. |
| (i) | “Exploration and business development – sustaining” is calculated as “Exploration and business development” expenses as reported on the consolidated statements of operations, less the non-controlling interest portion in Manh Choh (30%) and other subsidiaries for which the Company’s interest is less than 100% and non-sustaining exploration and business development expenses. Exploration expenses are classified as either sustaining or non-sustaining based on a determination of the type and location of the exploration expenditure. Exploration expenditures within the footprint of operating mines are considered costs required to sustain current operations and are therefore included in sustaining costs. Exploration expenditures focused on new ore bodies near existing mines (i.e. brownfield), new exploration projects (i.e. greenfield) or for other generative exploration activity not linked to existing mining operations are classified as non-sustaining. Business development expenses are classified as either sustaining or non-sustaining based on a determination of the type of expense and requirement for general or growth-related operations. |
| (j) | “Additions to property, plant and equipment – sustaining” and “non-sustaining” are as presented on pages 22 and 23 of this news release and include Kinross’ share of Manh Choh’s (70%) sustaining and non-sustaining capital expenditures. |
| (k) | “Lease payments – sustaining” represents the majority of lease payments as reported on the consolidated statements of cash flows and is made up of the principal and financing components of such cash payments, less the non-controlling interest portion in Manh Choh (30%) and other subsidiaries for which the Company’s interest is less than 100%, and non-sustaining lease payments. Lease payments for development projects or closed mines are classified as non-sustaining. |
| (l) | The Fort Knox segment is composed of Fort Knox and Manh Choh for all periods presented. |
| (m) | Attributable adjusted operating cash flow for the three months ended March 31, 2025 has been presented in accordance with the current period’s presentation. |
| (n) | “Impact of silver by-product” represents the costs allocated to the production of secondary or by-product metal (i.e. silver), which is produced as a by-product of the process used to produce gold. |
CPM Group’s 10-Year Copper Outlook are now available. ... READ MORE
Arizona Gold and Silver Inc. (TSX-V: AZS) (OTCQB: AZASF) is ple... READ MORE
Brixton Metals Corporation (TSX-V: BBB) (OTCQX: BBBXF) is pleased... READ MORE
Valkea Resources Corp. (TSX-V: OZ) is pleased to announce the clo... READ MORE
Tiger Gold Corp. (TSX-V: TIGR) (FSE: D150) (OTCQB: TGRGF) is plea... READ MORE


