


Robust margins drive record free cash flow of over $600 million
On track for $650 million in return of capital to shareholders in 2025
Development projects advancing on plan
Kinross Gold Corporation (TSX: K) (NYSE: KGC) announced its results for the second quarter ended June 30, 2025.
2025 second-quarter highlights:
Return of capital to shareholders:
Operations highlights:
Development and exploration projects:
CEO commentary:
“Our portfolio of mines continued to perform well during the quarter contributing to a strong first half of the year and positioning us well to achieve our full-year guidance. The Company delivered a 21% increase in margins of $2,204 compared with Q1 2025, outpacing the 15% increase in the gold price over the same period. We also delivered record free cash flow of approximately $650 million, which increased by 74% compared with the previous quarter.
“Since reactivating our share buyback program earlier this year, we have repurchased $225 million in shares of the $500 million planned for the year, while maintaining our quarterly dividend and significantly strengthening our investment-grade balance sheet.
“We are excited about our pipeline of high-quality development and exploration projects, all of which progressed well during the quarter. We have strong optionality in our substantial resource base and are focused on drilling, technical studies and permitting to advance longer-dated projects into our production profile to extend mine life, with a focus on driving margin growth.
“We are also pleased to have released our 2024 Sustainability Report during the quarter, which provides a transparent and comprehensive account of our reporting in this important area. We continue to be focused on sustainability across all aspects of our business, from operations and growth projects, to exploration and strategic priorities.”
Summary of financial and operating results
| Three months ended | Six months ended | ||||||||||||
| June 30, | June 30, | ||||||||||||
| (in millions of U.S. dollars, except ounces, per share amounts, and per ounce amounts) | 2025 | 2024 | 2025 | 2024 | |||||||||
| Operating Highlights(a) | |||||||||||||
| Total gold equivalent ounces(b) | |||||||||||||
| Produced | 530,077 | 535,338 | 1,059,938 | 1,062,737 | |||||||||
| Sold | 526,223 | 520,760 | 1,050,312 | 1,043,160 | |||||||||
| Attributable gold equivalent ounces(b) | |||||||||||||
| Produced | 512,574 | 535,338 | 1,024,662 | 1,062,737 | |||||||||
| Sold | 508,300 | 520,760 | 1,014,864 | 1,043,160 | |||||||||
| Gold ounces – sold | 519,391 | 505,122 | 1,035,659 | 1,008,726 | |||||||||
| Silver ounces – sold (000’s) | 666 | 1,268 | 1,367 | 2,935 | |||||||||
| Earnings(a) | |||||||||||||
| Metal sales | $ | 1,728.5 | $ | 1,219.5 | $ | 3,226.0 | $ | 2,301.0 | |||||
| Production cost of sales | $ | 568.4 | $ | 536.1 | $ | 1,115.1 | $ | 1,049.0 | |||||
| Depreciation, depletion and amortization | $ | 262.9 | $ | 295.8 | $ | 551.3 | $ | 566.5 | |||||
| Operating earnings | $ | 774.8 | $ | 298.3 | $ | 1,345.2 | $ | 491.5 | |||||
| Net earnings attributable to common shareholders | $ | 530.7 | $ | 210.9 | $ | 898.7 | $ | 317.9 | |||||
| Net earnings per share attributable to common shareholders (basic and diluted) | $ | 0.43 | $ | 0.17 | $ | 0.73 | $ | 0.26 | |||||
| Adjusted net earnings(c) | $ | 541.0 | $ | 174.7 | $ | 905.0 | $ | 299.6 | |||||
| Adjusted net earnings per share(c) | $ | 0.44 | $ | 0.14 | $ | 0.74 | $ | 0.24 | |||||
| Cash Flow(a) | |||||||||||||
| Net cash flow provided from operating activities | $ | 992.4 | $ | 604.0 | $ | 1,589.5 | $ | 978.4 | |||||
| Attributable adjusted operating cash flow(c) | $ | 843.9 | $ | 478.3 | $ | 1,520.1 | $ | 904.0 | |||||
| Capital expenditures(d) | $ | 306.1 | $ | 274.2 | $ | 513.8 | $ | 516.1 | |||||
| Attributable capital expenditures(c) | $ | 301.8 | $ | 264.5 | $ | 505.9 | $ | 496.6 | |||||
| Attributable free cash flow(c) | $ | 646.6 | $ | 345.9 | $ | 1,017.4 | $ | 491.2 | |||||
| Per Ounce Metrics(a) | |||||||||||||
| Average realized gold price per ounce(e) | $ | 3,284 | $ | 2,342 | $ | 3,071 | $ | 2,206 | |||||
| Attributable average realized gold price per ounce(c) | $ | 3,285 | $ | 2,342 | $ | 3,071 | $ | 2,206 | |||||
| Production cost of sales per equivalent ounce sold(b)(f) | $ | 1,080 | $ | 1,029 | $ | 1,062 | $ | 1,006 | |||||
| Attributable production cost of sales per equivalent ounce sold(b)(c) | $ | 1,074 | $ | 1,029 | $ | 1,056 | $ | 1,006 | |||||
| Attributable production cost of sales per ounce sold on a by-product basis(c) | $ | 1,044 | $ | 989 | $ | 1,027 | $ | 965 | |||||
| Attributable all-in sustaining cost per equivalent ounce sold(b)(c) | $ | 1,493 | $ | 1,387 | $ | 1,424 | $ | 1,348 | |||||
| Attributable all-in sustaining cost per ounce sold on a by-product basis(c) | $ | 1,469 | $ | 1,357 | $ | 1,400 | $ | 1,319 | |||||
| Attributable all-in cost per equivalent ounce sold(b)(c) | $ | 1,936 | $ | 1,774 | $ | 1,808 | $ | 1,702 | |||||
| Attributable all-in cost per ounce sold on a by-product basis(c) | $ | 1,918 | $ | 1,756 | $ | 1,789 | $ | 1,685 | |||||
| (a) | All measures and ratios include 100% of the results from Manh Choh, except measures and ratios denoted as “attributable.” “Attributable” measures and ratios include Kinross’ 70% share of Manh Choh production, sales, cash flow, capital expenditures and costs, as applicable. | |
| (b) | “Gold equivalent ounces” include silver ounces produced and sold converted to a gold equivalent based on a ratio of the average spot market prices for the commodities for each period. The ratio for the second quarter and first six months of 2025 was 97.41:1 and 93.60:1, respectively (second quarter and first six months of 2024 – 81.06:1 and 84.51:1, respectively). | |
| (c) | The definition and reconciliation of these non-GAAP financial measures and ratios is included on pages 16 to 21 of this news release. Non-GAAP financial measures and ratios have no standardized meaning under International Financial Reporting Standards (“IFRS”) and therefore, may not be comparable to similar measures presented by other issuers. | |
| (d) | “Capital expenditures” is as reported as “Additions to property, plant and equipment” on the interim condensed consolidated statements of cash flows. | |
| (e) | “Average realized gold price per ounce” is defined as gold revenue divided by total gold ounces sold. | |
| (f) | “Production cost of sales per equivalent ounce sold” is defined as production cost of sales divided by total gold equivalent ounces sold. | |
The following operating and financial results are based on second-quarter gold equivalent production:
Production: Kinross produced 512,574 Au eq. oz. in Q2 2025, compared with 535,338 Au eq. oz. in Q2 2024. Higher production from Fort Knox, with the commencement of higher-grade, higher-recovery ore feed from Manh Choh in the second half of 2024, and higher production from Paracatu, was offset by lower production from Tasiast and Round Mountain, as planned.
Average realized gold price8: The average realized gold price in Q2 2025 was $3,284 per ounce, compared with $2,342 per ounce in Q2 2024.
Revenue: During the second quarter, revenue increased to $1,728.5 million, compared with $1,219.5 million during Q2 2024. The 42% year-over-year increase is due to the increase in the average realized gold price.
Production cost of sales: Production cost of sales per Au eq. oz. sold2 was $1,080 for the quarter, compared with $1,029 in Q2 2024. Attributable production cost of sales per Au eq. oz. sold1 was $1,074 for the quarter, compared with $1,029 in Q2 2024.
Attributable production cost of sales per Au oz. sold on a by-product basis1 was $1,044 in Q2 2025, compared with $989 in Q2 2024, based on attributable gold sales of 501,628 ounces and attributable silver sales of 650,026 ounces.
Margins4: Kinross’ margin per Au eq. oz. sold increased by 68% to $2,204 for Q2 2025, compared with the Q2 2024 margin of $1,313, outpacing the 40% increase in average realized gold price.
Attributable all-in sustaining cost1: Attributable all-in sustaining cost per Au eq. oz. sold was $1,493 in Q2 2025, compared with $1,387 in Q2 2024.
In Q2 2025, attributable all-in sustaining cost per Au oz. sold on a by-product basis was $1,469, compared with $1,357 in Q2 2024.
Operating cash flow3: Operating cash flow increased to $992.4 million for Q2 2025, compared with $604.0 million for Q2 2024.
Attributable adjusted operating cash flow1 for Q2 2025 increased to $843.9 million, compared with $478.3 million for Q2 2024.
Attributable free cash flow1: Attributable free cash flow increased by 87% to $646.6 million in Q2 2025, compared with $345.9 million in Q2 2024.
Reported earnings5: Reported net earnings more than doubled to $530.7 million for Q2 2025, or $0.43 per share, compared with reported net earnings of $210.9 million, or $0.17 per share, for Q2 2024.
Adjusted net earnings6 more than tripled to $541.0 million, or $0.44 per share, for Q2 2025, compared with $174.7, or $0.14 per share, for Q2 2024.
Attributable capital expenditures1: Attributable capital expenditures increased to $301.8 million for Q2 2025, compared with $264.5 million for Q2 2024. The increase was driven by the ramp-up of development activities at Great Bear, Bald Mountain Redbird Phase 1 and La Coipa Phase 7, partially offset by lower spending on capital development due to mine sequencing at Fort Knox and Manh Choh.
Balance sheet
As of June 30, 2025, Kinross had cash and cash equivalents of $1,136.5 million, compared with $694.6 million at March 31, 2025, and net debt9 of approximately $100 million.
The Company had additional available credit10 of $1.6 billion and total liquidity7 of approximately $2.8 billion as of June 30, 2025.
Return of capital to shareholders
Reflecting the Company’s financial strength, Kinross reactivated its share buyback program in April 2025, while continuing its quarterly dividend program.
Kinross repurchased approximately $170 million in shares during the quarter, and approximately $225 million to date (representing 15.2 million shares). Including its quarterly dividend, Kinross has returned approximately $300 million in capital to shareholders to date in 2025.
Kinross continues to target returning a minimum of $650 million to shareholders for the full year, including a minimum of $500 million in share repurchases.
As part of its continuing quarterly dividend program, the Company declared a dividend of $0.03 per common share payable on September 4, 2025, to shareholders of record as of August 21, 2025.
Operating results
Mine-by-mine summaries for 2025 second-quarter operating results may be found on pages 10 and 14 of this news release. Highlights include the following:
At Tasiast, production decreased quarter-over-quarter and year-over-year driven by planned lower grades and lower throughput. The higher recoveries following a number of optimization initiatives to the mill were partially offset by planned lower grades year-over-year. Cost of sales per ounce sold increased compared with the previous quarter and Q2 2024 due to lower production. Tasiast remains on track to meet its annual guidance.
Production at Paracatu increased quarter-over-quarter due to higher throughput, partially offset by lower grades. Year-over-year production increased due to higher grades and recoveries partially offset by an expected decrease in throughput, as per planned mine sequencing which moved into harder, higher-grade ore this year. Cost of sales per ounce sold was in line with the previous quarter and decreased compared with Q2 2024 due to the increase in production.
At La Coipa, production increased quarter-over-quarter due to timing of ounces processed through the mill, partially offset by lower grades as a result of decreased ore tonnes mined from the pit and increased feed from low-grade stockpiles driven by higher groundwater inflows into the pits than anticipated. Relative to Q2 2024, production decreased also due to lower grades with higher feed from low-grade stockpiles. In the second half of the year, production is expected to increase as mining transitions to higher-grade ore from Phase 7, and the mine remains on track to meet its annual production guidance. Cost of sales per ounce sold was higher quarter-over-quarter as a result of the lower grades and higher royalty costs, and year-over-year as a result of the decrease in production and higher royalty, labour and contractor costs. Permitting work for mine life extensions continues, including the submission of the Environmental Impact Assessment during the quarter.
At Fort Knox, production was largely in line quarter-over-quarter, and increased year-over-year as a result of the contribution of Manh Choh’s higher-grade, higher-recovery ore starting in the second half of 2024. Cost of sales per ounce sold increased quarter-over-quarter due to higher processing costs and the timing of ounces recovered from the heap leach pads. Year-over-year costs decreased as a result of the increase in production, partially offset by higher royalty and reagent costs related largely to the start of Manh Choh production.
At Round Mountain, production was higher quarter-over-quarter driven by higher grades. Production decreased year-over-year as a result of lower mill grades and fewer ounces recovered from the heap leach pads as per planned mine sequencing as the site transitions from Phase W to Phase S.
At Bald Mountain, production was higher quarter-over-quarter and year-over-year largely as a result of strong grades and timing of ounces recovered from the heap leach pads, partially offset by fewer tonnes of ore stacked. Cost of sales per ounce sold was lower quarter-over-quarter and year-over-year as a result of the increase in production and higher proportion of capital development tonnes as mining at Redbird Phase I continues to ramp-up.
Development and exploration projects
Great Bear
At Great Bear, Kinross continues to progress its AEX program, permitting and detailed engineering for the Main Project.
AEX construction commenced in Q4 2024, earthwork activities are underway, and the AEX camp is nearing completion. Initial development of the exploration decline is on target for December 2025, subject to permitting.
For the Main Project, Kinross is progressing detailed engineering on the mill, the tailings management facility, and other site infrastructure. Initial procurement activities for major process equipment have commenced, with awards planned to start in late 2025, and manufacturing for a few long lead items is expected to commence in 2026.
In order to advance the Impact Statement (IS) on a timely basis, the Company is coordinating with the Impact Assessment Agency of Canada (IAAC) on a staged filing process. The Company intends to file the majority of the technical chapters by year end and the remaining chapters by the end of Q1 2026. This approach will underpin a robust IS filing with the necessary technical and Indigenous contributions to help facilitate an efficient review process by IAAC.
Kinross also advanced its regional exploration drilling program during the quarter, targeting favorable geophysical signatures as well as lithological contacts, looking for new, near-surface mineralization.
Round Mountain Phase X
Decline development at Round Mountain Phase X is advancing well, with over 4,500 metres developed to date. Extensive infill drilling has been completed in both the upper zone and lower zones, with results continuing to intersect strong widths and grades, and extension drilling indicating continuation of mineralization down dip outside the original exploration target. Highlights include:
Engineering work and technical studies are advancing well to support potential project execution at Phase X.
Kinross plans to provide a project, resource and economics update with year-end results.
See Appendix A for a Round Mountain Phase X long section.
Curlew Basin exploration
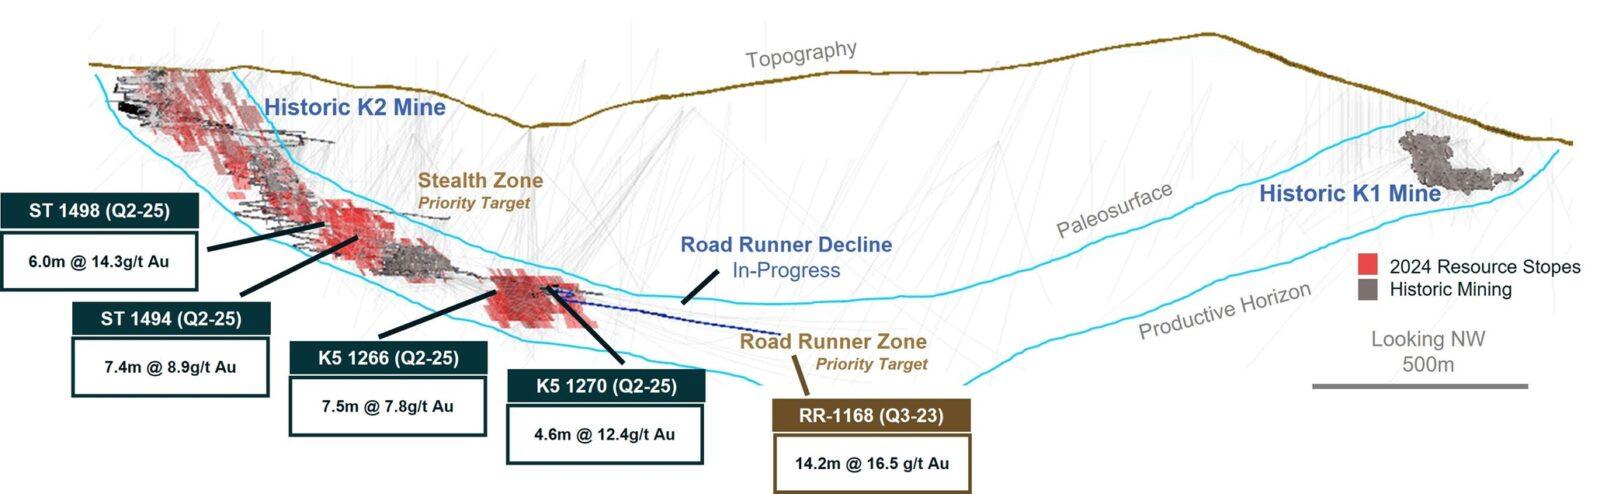
Drilling at Curlew continues to intersect high grades and strong widths at both North Stealth and K5, indicating potential to further improve the quality of the resource and the mine plan with additions of high margin mineralization. Highlights include (true width):
Extension of the underground declines is progressing well with over 800 metres developed year-to-date, focused on providing drilling access to follow up on the high grade 2023 discovery at Roadrunner and to extend mineralization in the high grade North Stealth area.
Technical studies and detailed engineering are also progressing well at Curlew.
See Appendix A for a Curlew cross section.
Bald Mountain Redbird
At Redbird, mining is advancing on schedule. Studies and detailed engineering related to the potential Phase 2 extension of Redbird are progressing well, including engineering related to the heap leach pad expansion, technical studies and mine plan optimization work. Exploration drilling and technical studies are also progressing, targeting satellite pit opportunities on the large Bald Mountain property, which could potentially augment the production profile from Redbird 2.
Lobo-Marte
Kinross is progressing baseline studies to support the Environmental Impact Assessment (EIA) for the Lobo-Marte project. Lobo-Marte continues to be a potential large, low-cost mine and Kinross is committed to progressing next steps to advance the project.
Sustainability
Following the publication of Kinross’ 2024 Sustainability Report and summary, below are several water-related highlights, a material sustainability topic for the Company and its stakeholders. Kinross’ water management standard prioritizes water supply security, water conservation and stewardship, and prevention of downstream environmental impacts. There is a strong focus on water efficiency, with a high water recycling rate of 75%, as well as maintaining water quality at locations both near and far from sites. Kinross also maintained its conformance with the Responsible Gold Mining Principles, which include principles for water efficiency and quality.
In Chile, La Coipa contributed to this efficiency through an optimization program of the main processing circuits which resulted in lower water loss going to the dry stack tailings. Near Maricunga, wetland restoration resulted in the resurgence of ecosystem services and the return of native plant species.
At all of the Company’s development projects, science-based methods are utilized to ensure strong baseline information, including environmental DNA studies for the Great Bear project and watershed groundwater modeling for the Lobo-Marte project.
At Fort Knox in Alaska, fish populations continue to thrive at Fish Creek based on continuous monitoring by the Alaska department of Fish and Game since the late 1990s. Fish Creek was a historic placer mining area, reclaimed by Kinross in the early 1990s for the benefit of the local communities. Also in Alaska, Kinross continued its long-standing partnership with Trout Unlimited and the Alaska Abandoned Mine Restoration Initiative, with sustained progress in the recovery of fish populations in Resurrection Creek, south of Anchorage, also a placer mining area.
About Kinross Gold Corporation
Kinross is a Canadian-based global senior gold mining company with operations and projects in the United States, Brazil, Mauritania, Chile and Canada. Our focus is on delivering value based on the core principles of responsible mining, operational excellence, disciplined growth, and balance sheet strength. Kinross maintains listings on the Toronto Stock Exchange and the New York Stock Exchange.
Review of operations
| Three months ended June 30, | Gold equivalent ounces | |||||||||||||||
| Produced | Sold | Production cost of sales ($millions) |
Production cost of sales/equivalent ounce sold |
|||||||||||||
| 2025 | 2024 | 2025 | 2024 | 2025 | 2024 | 2025 | 2024 | |||||||||
| Tasiast | 119,241 | 161,629 | 121,745 | 156,038 | 102.6 | 102.3 | 843 | 656 | ||||||||
| Paracatu | 149,264 | 130,228 | 148,787 | 130,174 | 142.6 | 135.2 | 958 | 1,039 | ||||||||
| La Coipa | 54,139 | 65,851 | 50,400 | 63,506 | 70.4 | 58.8 | 1,397 | 926 | ||||||||
| Fort Knox | 115,064 | 69,914 | 113,200 | 70,477 | 141.3 | 94.8 | 1,248 | 1,345 | ||||||||
| Round Mountain | 38,665 | 61,787 | 37,864 | 60,049 | 52.1 | 93.9 | 1,376 | 1,564 | ||||||||
| Bald Mountain | 53,704 | 45,929 | 54,227 | 39,818 | 59.4 | 50.6 | 1,095 | 1,271 | ||||||||
| United States Total | 207,433 | 177,630 | 205,291 | 170,344 | 252.8 | 239.3 | 1,231 | 1,405 | ||||||||
| Less: Manh Choh non-controlling interest (30%) | (17,503) | – | (17,923) | – | (22.5) | – | ||||||||||
| United States Attributable Total | 189,930 | 177,630 | 187,368 | 170,344 | 230.3 | 239.3 | 1,229 | 1,405 | ||||||||
| Operations Total(a) | 530,077 | 535,338 | 526,223 | 520,760 | 568.4 | 536.1 | 1,080 | 1,029 | ||||||||
| Attributable Total(a) | 512,574 | 535,338 | 508,300 | 520,760 | 545.9 | 536.1 | 1,074 | 1,029 | ||||||||
| Six months ended June 30, | Gold equivalent ounces | |||||||||||||||
| Produced | Sold | Production cost of sales ($millions) |
Production cost of sales/equivalent ounce sold |
|||||||||||||
| 2025 | 2024 | 2025 | 2024 | 2025 | 2024 | 2025 | 2024 | |||||||||
| Tasiast | 256,870 | 320,828 | 251,238 | 307,052 | 207.6 | 202.0 | 826 | 658 | ||||||||
| Paracatu | 295,903 | 258,501 | 295,642 | 258,284 | 282.2 | 270.9 | 955 | 1,049 | ||||||||
| La Coipa | 106,454 | 137,096 | 106,270 | 134,631 | 134.5 | 110.9 | 1,266 | 824 | ||||||||
| Fort Knox | 227,118 | 123,264 | 225,310 | 126,769 | 273.1 | 177.3 | 1,212 | 1,399 | ||||||||
| Round Mountain | 74,351 | 130,139 | 73,824 | 128,218 | 109.1 | 184.5 | 1,478 | 1,439 | ||||||||
| Bald Mountain | 99,242 | 92,909 | 98,028 | 87,059 | 108.6 | 102.7 | 1,108 | 1,180 | ||||||||
| United States Total | 400,711 | 346,312 | 397,162 | 342,046 | 490.8 | 464.5 | 1,236 | 1,358 | ||||||||
| Less: Manh Choh non-controlling interest (30%) | (35,276) | – | (35,448) | – | (43.2) | – | ||||||||||
| United States Attributable Total | 365,435 | 346,312 | 361,714 | 342,046 | 447.6 | 464.5 | 1,237 | 1,358 | ||||||||
| Operations Total(a) | 1,059,938 | 1,062,737 | 1,050,312 | 1,043,160 | 1,115.1 | 1,049.0 | 1,062 | 1,006 | ||||||||
| Attributable Total(a) | 1,024,662 | 1,062,737 | 1,014,864 | 1,043,160 | 1,071.9 | 1,049.0 | 1,056 | 1,006 | ||||||||
| (a) | Totals include immaterial sales and related costs from Maricunga for the three and six months ended June 30, 2024. | |
Consolidated balance sheets
| (unaudited, expressed in millions of U.S. dollars, except share amounts) | ||||||
| As at | ||||||
| June 30, | December 31, | |||||
| 2025 | 2024 | |||||
| Assets | ||||||
| Current assets | ||||||
| Cash and cash equivalents | $ | 1,136.5 | $ | 611.5 | ||
| Restricted cash | 12.7 | 10.2 | ||||
| Accounts receivable and prepaid assets | 239.9 | 257.3 | ||||
| Inventories | 1,344.7 | 1,243.2 | ||||
| Other current assets | 14.8 | 4.5 | ||||
| 2,748.6 | 2,126.7 | |||||
| Non-current assets | ||||||
| Property, plant and equipment | 7,972.7 | 7,968.6 | ||||
| Long-term investments | 89.6 | 51.9 | ||||
| Other long-term assets | 647.2 | 713.1 | ||||
| Deferred tax assets | 5.3 | 5.3 | ||||
| Total assets | $ | 11,463.4 | $ | 10,865.6 | ||
| Liabilities | ||||||
| Current liabilities | ||||||
| Accounts payable and accrued liabilities | $ | 611.3 | $ | 543.0 | ||
| Current income tax payable | 285.9 | 236.7 | ||||
| Current portion of long-term debt | – | 199.9 | ||||
| Current portion of provisions | 60.0 | 62.5 | ||||
| Other current liabilities | 9.5 | 18.0 | ||||
| 966.7 | 1,060.1 | |||||
| Non-current liabilities | ||||||
| Long-term debt | 1,236.4 | 1,235.5 | ||||
| Provisions | 964.3 | 941.5 | ||||
| Other long-term liabilities | 56.3 | 78.9 | ||||
| Deferred tax liabilities | 551.7 | 549.0 | ||||
| Total liabilities | $ | 3,775.4 | $ | 3,865.0 | ||
| Equity | ||||||
| Common shareholders’ equity | ||||||
| Common share capital | $ | 4,451.0 | $ | 4,487.3 | ||
| Contributed surplus | 10,503.7 | 10,643.0 | ||||
| Accumulated deficit | (7,356.2) | (8,181.3) | ||||
| Accumulated other comprehensive loss | (44.8) | (87.4) | ||||
| Total common shareholders’ equity | 7,553.7 | 6,861.6 | ||||
| Non-controlling interests | 134.3 | 139.0 | ||||
| Total equity | $ | 7,688.0 | $ | 7,000.6 | ||
| Total liabilities and equity | $ | 11,463.4 | $ | 10,865.6 | ||
| Common shares | ||||||
| Authorized | Unlimited | Unlimited | ||||
| Issued and outstanding | 1,218,782,161 | 1,229,125,606 | ||||
Consolidated statements of operations
| (unaudited, expressed in millions of U.S. dollars, except per share amounts) | ||||||||||||
| Three months ended | Six months ended | |||||||||||
| June 30, | June 30, | June 30, | June 30, | |||||||||
| 2025 | 2024 | 2025 | 2024 | |||||||||
| Revenue | ||||||||||||
| Metal sales | $ | 1,728.5 | $ | 1,219.5 | $ | 3,226.0 | $ | 2,301.0 | ||||
| Cost of sales | ||||||||||||
| Production cost of sales | 568.4 | 536.1 | 1,115.1 | 1,049.0 | ||||||||
| Depreciation, depletion and amortization | 262.9 | 295.8 | 551.3 | 566.5 | ||||||||
| Total cost of sales | 831.3 | 831.9 | 1,666.4 | 1,615.5 | ||||||||
| Gross profit | 897.2 | 387.6 | 1,559.6 | 685.5 | ||||||||
| Other operating expense | 31.1 | 1.9 | 45.1 | 29.5 | ||||||||
| Exploration and business development | 61.7 | 55.7 | 104.0 | 97.4 | ||||||||
| General and administrative | 29.6 | 31.7 | 65.3 | 67.1 | ||||||||
| Operating earnings | 774.8 | 298.3 | 1,345.2 | 491.5 | ||||||||
| Other (expense) income – net | (19.8) | 5.7 | (33.0) | 5.8 | ||||||||
| Finance income | 7.4 | 4.5 | 11.6 | 8.4 | ||||||||
| Finance expense | (32.9) | (21.8) | (68.1) | (43.3) | ||||||||
| Earnings before tax | 729.5 | 286.7 | 1,255.7 | 462.4 | ||||||||
| Income tax expense – net | (170.9) | (77.8) | (307.7) | (146.9) | ||||||||
| Net earnings | $ | 558.6 | $ | 208.90 | $ | 948.0 | $ | 315.5 | ||||
| Net earnings (loss) attributable to: | ||||||||||||
| Non-controlling interests | $ | 27.9 | $ | (2.0) | $ | 49.3 | $ | (2.4) | ||||
| Common shareholders | $ | 530.7 | $ | 210.9 | $ | 898.7 | $ | 317.9 | ||||
| Earnings per share attributable to common shareholders | ||||||||||||
| Basic | $ | 0.43 | $ | 0.17 | $ | 0.73 | $ | 0.26 | ||||
| Diluted | $ | 0.43 | $ | 0.17 | $ | 0.73 | $ | 0.26 | ||||
Consolidated statements of cash flows
| (unaudited, expressed in millions of U.S. dollars) | ||||||||||||
| Three months ended | Six months ended | |||||||||||
| June 30, | June 30, | June 30, | June 30, | |||||||||
| 2025 | 2024 | 2025 | 2024 | |||||||||
| Net inflow (outflow) of cash related to the following activities: | ||||||||||||
| Operating: | ||||||||||||
| Net earnings | $ | 558.6 | $ | 208.90 | $ | 948.0 | $ | 315.50 | ||||
| Adjustments to reconcile net earnings to net cash provided from operating activities: | ||||||||||||
| Depreciation, depletion and amortization | 262.9 | 295.8 | 551.3 | 566.5 | ||||||||
| Share-based compensation expense | 3.2 | 2.8 | 7.8 | 5.3 | ||||||||
| Finance expense | 32.9 | 21.8 | 68.1 | 43.3 | ||||||||
| Deferred tax (recovery) expense | (1.0) | (21.2) | 2.5 | (12.6) | ||||||||
| Foreign exchange losses (gains) and other | 23.3 | (7.1) | 8.3 | 7.9 | ||||||||
| Changes in operating assets and liabilities: | ||||||||||||
| Accounts receivable and other assets | 7.2 | 6.2 | 14.3 | 15.0 | ||||||||
| Inventories | 8.9 | 2.5 | (29.5) | 8.4 | ||||||||
| Accounts payable, accrued liabilities and other | 206.4 | 147.0 | 307.0 | 160.6 | ||||||||
| Cash flow provided from operating activities | 1,102.4 | 656.7 | 1,877.8 | 1,109.9 | ||||||||
| Income taxes paid | (110.0) | (52.7) | (288.3) | (131.5) | ||||||||
| Net cash flow provided from operating activities | 992.4 | 604.0 | 1,589.5 | 978.4 | ||||||||
| Investing: | ||||||||||||
| Additions to property, plant and equipment | (306.1) | (274.2) | (513.8) | (516.1) | ||||||||
| Interest paid capitalized to property, plant and equipment | – | (17.0) | (13.5) | (51.9) | ||||||||
| Net additions to long-term investments and other assets | (14.8) | (15.7) | (23.9) | (18.8) | ||||||||
| (Increase) decrease in restricted cash – net | (0.8) | 0.8 | (2.5) | 0.3 | ||||||||
| Interest received and other – net | 9.0 | 3.8 | 13.2 | 7.7 | ||||||||
| Net cash flow used in investing activities | (312.7) | (302.3) | (540.5) | (578.8) | ||||||||
| Financing: | ||||||||||||
| Repayment of debt | – | (200.0) | (200.0) | (200.0) | ||||||||
| Interest paid | – | – | (24.0) | (18.5) | ||||||||
| Payment of lease liabilities | (1.5) | (3.4) | (3.0) | (6.8) | ||||||||
| Funding from non-controlling interest | – | 11.7 | – | 27.2 | ||||||||
| Distributions paid to non-controlling interest | (30.0) | – | (54.0) | – | ||||||||
| Dividends paid to common shareholders | (36.7) | (36.8) | (73.6) | (73.7) | ||||||||
| Repurchase and cancellation of shares | (170.1) | – | (170.1) | – | ||||||||
| Other – net | – | – | – | 0.3 | ||||||||
| Net cash flow used in financing activities | (238.3) | (228.5) | (524.7) | (271.5) | ||||||||
| Effect of exchange rate changes on cash and cash equivalents | 0.5 | (0.1) | 0.7 | (0.5) | ||||||||
| Increase in cash and cash equivalents | 441.9 | 73.1 | 525.0 | 127.6 | ||||||||
| Cash and cash equivalents, beginning of period | 694.6 | 406.9 | 611.5 | 352.4 | ||||||||
| Cash and cash equivalents, end of period | 1,136.5 | 480.0 | $ | 1,136.5 | $ | 480.0 | ||||||
|
Operating Summary |
|
|||||||||||||||||
| Mine | Period | Tonnes Ore Mined | Ore Processed (Milled) | Ore Processed (Heap Leach) | Grade (Mill) | Grade (Heap Leach) | Recovery (a)(b) | Gold Eq Production(c) | Gold Eq Sales(c) | Production cost of sales | Production cost of sales/oz(d) | Cap Ex – sustaining(e) | Total Cap Ex (e) | |||||
| (‘000 tonnes) | (‘000 tonnes) | (‘000 tonnes) | (g/t) | (g/t) | (%) | (ounces) | (ounces) | ($ millions) | ($/ounce) | ($ millions) | ($ millions) | |||||||
| West Africa | Tasiast | Q2 2025 | 1,921 | 1,730 | – | 2.11 | – | 95% | 119,241 | 121,745 | $ | 102.6 | $ | 843 | $ | 23.1 | $ | 89.7 |
| Q1 2025 | 1,812 | 1,932 | – | 2.15 | – | 95% | 137,629 | 129,493 | $ | 105.0 | $ | 811 | $ | 13.7 | $ | 80.1 | ||
| Q4 2024 | 1,824 | 2,205 | – | 2.13 | – | 94% | 139,411 | 144,041 | $ | 104.4 | $ | 725 | $ | 33.7 | $ | 105.4 | ||
| Q3 2024 | 1,748 | 2,203 | – | 2.46 | – | 91% | 162,155 | 158,521 | $ | 109.0 | $ | 688 | $ | 13.5 | $ | 83.8 | ||
| Q2 2024 | 1,985 | 2,161 | – | 2.70 | – | 92% | 161,629 | 156,038 | $ | 102.3 | $ | 656 | $ | 7.0 | $ | 75.2 | ||
| Americas | Paracatu | Q2 2025 | 13,497 | 14,527 | – | 0.39 | – | 82% | 149,264 | 148,787 | $ | 142.6 | $ | 958 | $ | 38.4 | $ | 38.4 |
| Q1 2025 | 13,318 | 12,507 | – | 0.43 | – | 83% | 146,639 | 146,855 | $ | 139.6 | $ | 951 | $ | 24.4 | $ | 24.4 | ||
| Q4 2024 | 12,944 | 13,116 | – | 0.40 | – | 80% | 123,899 | 124,690 | $ | 131.6 | $ | 1,055 | $ | 35.1 | $ | 35.1 | ||
| Q3 2024 | 13,127 | 14,551 | – | 0.38 | – | 81% | 146,174 | 145,235 | $ | 146.1 | $ | 1,006 | $ | 41.2 | $ | 41.2 | ||
| Q2 2024 | 14,094 | 15,053 | – | 0.35 | – | 80% | 130,228 | 130,174 | $ | 135.2 | $ | 1,039 | $ | 44.6 | $ | 44.6 | ||
| La Coipa(f) | Q2 2025 | 580 | 911 | – | 1.77 | – | 78% | 54,139 | 50,400 | $ | 70.4 | $ | 1,397 | $ | 25.0 | $ | 25.0 | |
| Q1 2025 | 1,265 | 971 | – | 2.19 | – | 80% | 52,315 | 55,870 | $ | 64.1 | $ | 1,147 | $ | 15.6 | $ | 15.6 | ||
| Q4 2024 | 1,385 | 1,017 | – | 1.98 | – | 79% | 58,533 | 57,852 | $ | 68.2 | $ | 1,179 | $ | 26.6 | $ | 26.6 | ||
| Q3 2024 | 786 | 809 | – | 2.17 | – | 80% | 50,502 | 48,594 | $ | 52.2 | $ | 1,074 | $ | 21.3 | $ | 24.9 | ||
| Q2 2024 | 690 | 882 | – | 1.97 | – | 84% | 65,851 | 63,506 | $ | 58.8 | $ | 926 | $ | 10.7 | $ | 10.7 | ||
| Fort Knox (100%)(g) | Q2 2025 | 7,639 | 1,636 | 5,529 | 1.72 | 0.23 | 88% | 115,064 | 113,200 | $ | 141.3 | $ | 1,248 | $ | 43.0 | $ | 43.0 | |
| Q1 2025 | 6,530 | 1,071 | 4,790 | 2.77 | 0.19 | 91% | 112,054 | 112,110 | $ | 131.8 | $ | 1,176 | $ | 28.2 | $ | 28.2 | ||
| Q4 2024 | 7,692 | 1,524 | 6,664 | 1.51 | 0.21 | 82% | 104,901 | 108,512 | $ | 141.0 | $ | 1,299 | $ | 53.3 | $ | 54.0 | ||
| Q3 2024 | 7,612 | 1,105 | 5,822 | 4.03 | 0.19 | 91% | 149,093 | 140,121 | $ | 134.2 | $ | 958 | $ | 56.6 | $ | 70.4 | ||
| Q2 2024 | 8,331 | 2,003 | 6,385 | 0.85 | 0.22 | 81% | 69,914 | 70,477 | $ | 94.8 | $ | 1,345.12 | $ | 47.6 | $ | 89.2 | ||
| Fort Knox (attributable)(g) | Q2 2025 | 7,535 | 1,567 | 5,529 | 1.47 | 0.23 | 87% | 97,561 | 95,277 | $ | 118.8 | $ | 1,246.89 | $ | 38.7 | $ | 38.7 | |
| Q1 2025 | 6,445 | 982 | 4,790 | 2.35 | 0.19 | 90% | 94,281 | 94,585 | $ | 111.1 | $ | 1,174.60 | $ | 24.6 | $ | 24.60 | ||
| Q4 2024 | 7,619 | 1,483 | 6,664 | 1.28 | 0.21 | 81% | 91,755 | 94,763 | $ | 125.1 | $ | 1,320.14 | $ | 51.1 | $ | 52.1 | ||
| Q3 2024 | 7,509 | 991 | 5,822 | 3.44 | 0.19 | 91% | 119,500 | 112,346 | $ | 109.3 | $ | 972.89 | $ | 55.4 | $ | 67.2 | ||
| Q2 2024 | 8,249 | 2,003 | 6,385 | 0.85 | 0.22 | 81% | 69,914 | 70,477 | $ | 94.8 | $ | 1,345.12 | $ | 47.6 | $ | 79.5 | ||
| Round Mountain | Q2 2025 | 2,881 | 856 | 1,682 | 0.72 | 0.30 | 80% | 38,665 | 37,864 | $ | 52.1 | $ | 1,376 | $ | 5.70 | $ | 32.8 | |
| Q1 2025 | 1,927 | 856 | 2,163 | 0.66 | 0.27 | 77% | 35,686 | 35,960 | $ | 57.0 | $ | 1,585 | $ | 2.8 | $ | 29.6 | ||
| Q4 2024 | 3,111 | 768 | 1,736 | 1.05 | 0.22 | 82% | 42,969 | 45,342 | $ | 80.0 | $ | 1,764 | $ | 4.4 | $ | 33.9 | ||
| Q3 2024 | 2,958 | 790 | 1,032 | 0.74 | 0.29 | 80% | 42,279 | 41,436 | $ | 63.8 | $ | 1,540 | $ | 5.2 | $ | 35.9 | ||
| Q2 2024 | 2,956 | 806 | 1,541 | 1.11 | 0.35 | 73% | 61,787 | 60,049 | $ | 93.9 | $ | 1,564 | $ | 2.1 | $ | 37.2 | ||
| Bald Mountain | Q2 2025 | 1,578 | – | 1,578 | – | 1.07 | nm | 53,704 | 54,227 | $ | 59.4 | $ | 1,095 | $ | 12.7 | $ | 40.4 | |
| Q1 2025 | 5,803 | – | 5,803 | – | 0.35 | nm | 45,538 | 43,801 | $ | 49.2 | $ | 1,123 | $ | 6.9 | $ | 17.8 | ||
| Q4 2024 | 7,622 | – | 7,622 | – | 0.46 | nm | 44,642 | 51,291 | $ | 58.7 | $ | 1,144 | $ | 4.6 | $ | 6.4 | ||
| Q3 2024 | 6,384 | – | 6,384 | – | 0.53 | nm | 43,496 | 44,410 | $ | 58.9 | $ | 1,326 | $ | 5 | $ | 6.1 | ||
| Q2 2024 | 2,906 | – | 2,906 | – | 0.47 | nm | 45,929 | 39,818 | $ | 50.6 | $ | 1,271 | $ | 4.4 | $ | 4.6 | ||
| (a) | Due to the nature of heap leach operations, recovery rates at Bald Mountain cannot be accurately measured on a quarterly basis. Recovery rates at Fort Knox and Round Mountain represent mill recovery only. | |||||||||||||||||
| (b) | “nm” means not meaningful. | |||||||||||||||||
| (c) | Gold equivalent ounces include silver ounces produced and sold converted to a gold equivalent based on the ratio of the average spot market prices for the commodities for each period. The ratios for the quarters presented are as follows: Q2 2025: 97.41:1; Q1 2025: 89.69:1; Q4 2024: 84.67:1; Q3 2024: 84.06:1; Q2 2024: 81.06:1. | |||||||||||||||||
| (d) | “Production cost of sales per equivalent ounce sold” is defined as production cost of sales divided by total gold equivalent ounces sold. | |||||||||||||||||
| (e) | “Total Cap Ex” is as reported as “Additions to property, plant and equipment” on the interim condensed consolidated statements of cash flows. “Cap Ex – sustaining” is a non-GAAP financial measure. The definition and reconciliation of this non-GAAP financial measure is included on pages 20 to 21 of this news release. | |||||||||||||||||
| (f) | La Coipa silver grade and recovery were as follows: Q2 2025: 28.89 g/t, 50%; Q1 2025: 31.97 g/t, 60%; Q4 2024: 42.57 g/t, 43%; Q3 2024: 49.13 g/t, 58%; Q2 2024: 65.02 g/t, 51%. | |||||||||||||||||
| (g) | The Fort Knox segment is composed of Fort Knox and Manh Choh, and comparative results shown are presented in accordance with the current year’s presentation. Manh Choh tonnes of ore processed and grade were as follows: Q2 2025: 231,451 tonnes, 7.39 g/t; Q1 2025: 294,238 tonnes, 7.39 g/t; Q4 2024: 138,937 tonnes, 9.58 g/t; Q3 2024: 379,786 tonnes, 9.13 g/t. Tonnes of ore processed and grade were nil for all other periods presented as production commenced in July 2024. The attributable results for Fort Knox include 100% of Fort Knox and 70% of Manh Choh. | |||||||||||||||||
Figure 1: At Round Mountain Phase X, drilling continues to confirm good grades and widths in the primary target zones. Further, extension drilling is showing continuation of down dip mineralization outside of the original target zone.
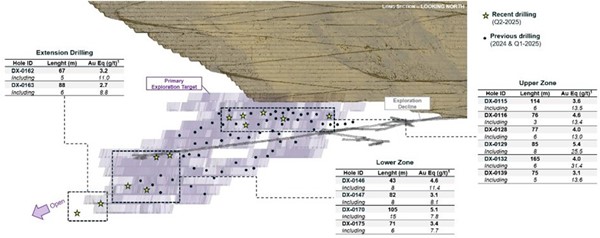
Figure 2: At Curlew, drill results continued to demonstrate wide, high-grade intercepts.
Hudbay Minerals Inc. (TSX:HBM) (NYSE: HBM) today released its ann... READ MORE
Strategic acquisition of an established operating gold mine, loca... READ MORE
Cerro de Pasco Resources Inc. (TSX-V: CDPR) (OTCQB: GPPRF) (FRA: ... READ MORE
The Garneau Titanium Project Features Ilmenite-Rich Boulder with ... READ MORE
ValOre Metals Corp. (TSX‐V: VO) (OTCQB: KVLQF) (Frankfurt: KEQ0... READ MORE


