


Delivered on all key guidance metrics
Achieved record free cash flow of more than $1.3 billion and repaid $800 million of debt
Strong three-year outlook of 2.0 million Au eq. oz. per year
Kinross Gold Corporation (TSX: K) (NYSE: KGC) announced its results for the fourth quarter and year ended December 31, 20241.
This news release contains forward-looking information about expected future events and financial and operating performance of the Company. We refer to the risks and assumptions set out in our Cautionary Statement on Forward-Looking Information located on pages 41 and 42 of this release. All dollar amounts are expressed in U.S. dollars, unless otherwise noted.
2024 full-year results and 2025 guidance:
| 2024 guidance (+/- 5%) |
Q4 2024 results |
2024 full-year results |
2025 guidance (+/- 5%) |
|
| Gold equivalent production1 (ounces) |
2.1 million | 501,209 | 2.13 million | 2.0 million |
| Production cost of sales2 Attributable production cost of sales1 ($ per Au eq. oz.) |
– $1,020 |
$1,098 $1,096 |
$1,020 $1,021 |
– $1,120 |
| Attributable all-in sustaining cost1 ($ per Au eq. oz.) |
$1,360 | $1,510 | $1,388 | $1,500 |
| Capital expenditures3 Attributable capital expenditures1 (million) |
– $1,050 |
$281 $279 |
$1,076 $1,051 |
– $1,150 |
2024 Q4 and full-year highlights:
________________________
1 Unless otherwise stated, production figures in this news release are on an attributable basis. “Attributable” includes Kinross’ 70% share of Manh Choh production, costs and capital expenditures. Financial figures include 100% of Manh Choh results except when denoted as attributable. Attributable figures are non-GAAP financial measures and ratios. Refer to footnote 7.
2 “Production cost of sales per equivalent ounce sold” is defined as production cost of sales, as reported on the consolidated statements of operations, divided by total gold equivalent ounces sold.
3 Capital expenditures is reported as “Additions to property, plant and equipment” on the consolidated statements of cash flows.
4 “Margins” per equivalent ounce sold is defined as average realized gold price per ounce less production cost of sales per equivalent ounce sold.
5 Operating cash flow figures in this release represent “Net cash flow provided from operating activities,” as reported on the consolidated statements of cash flows.
6 Earnings, net earnings, and reported net earnings figures in this release represent “Net earnings attributable to common shareholders,” as reported on the consolidated statements of operations.
7 These figures are non-GAAP financial measures and ratios, as applicable. They are defined and actual results are reconciled on pages 25 to 31 of this news release. Non-GAAP financial measures and ratios have no standardized meaning under International Financial Reporting Standards “IFRS” and therefore, may not be comparable to similar measures presented by other issuers.
8 Adjusted net earnings figures in this news release represent “Adjusted net earnings attributable to common shareholders.”
9 “Total liquidity” is defined as the sum of cash and cash equivalents, as reported on the consolidated balance sheets, and available credit under the Company’s credit facilities (as calculated in Section 6 Liquidity and Capital Resources of Kinross’ MD&A for the year ended December 31, 2024).
Operational highlights:
Development project and exploration highlights:
CEO Commentary:
“2024 marked another excellent year for Kinross and we have, once again, met our production and cost guidance. We delivered record free cash flow7 of $1.3 billion, which more than doubled year-over-year, repaid $800 million of debt, and grew our margins by 37%, significantly outpacing the rise in gold price.
“Three years ago, in February 2022, we acquired Great Bear through a combination of cash and shares. I’m proud to say that, since then, we have fully repaid the debt associated with that acquisition and have fewer shares outstanding due to our share buyback program. We have also outlined a high-grade resource and published an attractive Preliminary Economic Assessment demonstrating top-tier, high-margin production potential.
“We converted nearly 1 million resource ounces to reserves at Bald Mountain, which, coupled with the receipt of our Juniper permit in 2024, resulted in the decision to proceed with mining at Redbird.
“In Sustainability, we advanced environmental, social and governance initiatives across our host countries and look forward to publishing our detailed 2024 Sustainability Report in May. Highlights from 2024 include:
“We are forecasting another strong year of production of approximately 2.0 million gold equivalent ounces while maintaining our consistent operational performance. Our operational focus in 2025 will be on cost control, capital discipline and delivering on planned grades. We are also anticipating additional returns of capital to shareholders later in 2025.”
Financial results
Summary of financial and operating results
| Three months ended | Years ended | |||||||||
| (in millions of U.S. dollars, except ounces, per share amounts, and per ounce amounts) | December 31, | December 31, | ||||||||
| 2024 | 2023 | 2024 | 2023 | |||||||
| Operating Highlights(a) | ||||||||||
| Total gold equivalent ounces(b) | ||||||||||
| Produced | 514,355 | 546,513 | 2,170,791 | 2,153,020 | ||||||
| Sold | 531,729 | 565,389 | 2,153,212 | 2,179,936 | ||||||
| Attributable gold equivalent ounces(b) | ||||||||||
| Produced | 501,209 | 546,513 | 2,128,052 | 2,153,020 | ||||||
| Sold | 517,980 | 565,389 | 2,111,688 | 2,179,936 | ||||||
| Earnings(a) | ||||||||||
| Metal sales | $ | 1,415.8 | $ | 1,115.7 | $ | 5,148.8 | $ | 4,239.7 | ||
| Production cost of sales | $ | 583.8 | $ | 552.0 | $ | 2,197.1 | $ | 2,054.4 | ||
| Depreciation, depletion and amortization | $ | 284.8 | $ | 271.7 | $ | 1,147.5 | $ | 986.8 | ||
| Impairment charge (reversal) | $ | – | $ | 38.9 | $ | (74.1 | ) | $ | 38.9 | |
| Operating earnings | $ | 501.1 | $ | 193.5 | $ | 1,540.3 | $ | 801.4 | ||
| Net earnings attributable to common shareholders | $ | 275.6 | $ | 65.4 | $ | 948.8 | $ | 416.3 | ||
| Basic and diluted earnings per share attributable to common shareholders | $ | 0.22 | $ | 0.06 | $ | 0.77 | $ | 0.34 | ||
| Adjusted net earnings attributable to common shareholders(c) | $ | 240.0 | $ | 140.0 | $ | 838.3 | $ | 539.8 | ||
| Adjusted net earnings per share(c) | $ | 0.20 | $ | 0.11 | $ | 0.68 | $ | 0.44 | ||
| Cash Flow(a) | ||||||||||
| Net cash flow provided from operating activities | $ | 734.5 | $ | 410.9 | $ | 2,446.4 | $ | 1,605.3 | ||
| Attributable adjusted operating cash flow(c) | $ | 614.1 | $ | 409.6 | $ | 2,143.1 | $ | 1,676.7 | ||
| Capital expenditures(d) | $ | 280.7 | $ | 311.3 | $ | 1,075.5 | $ | 1,098.3 | ||
| Attributable capital expenditures(c) | $ | 278.8 | $ | 297.7 | $ | 1,050.9 | $ | 1,055.0 | ||
| Attributable free cash flow(c) | $ | 434.4 | $ | 116.7 | $ | 1,340.2 | $ | 559.7 | ||
| Per Ounce Metrics(a) | ||||||||||
| Average realized gold price per ounce(e) | $ | 2,663 | $ | 1,974 | $ | 2,393 | $ | 1,945 | ||
| Attributable average realized gold price per ounce(c) | $ | 2,665 | $ | 1,974 | $ | 2,391 | $ | 1,945 | ||
| Production cost of sales per equivalent ounce(b) sold(f) | $ | 1,098 | $ | 976 | $ | 1,020 | $ | 942 | ||
| Attributable production cost of sales per equivalent ounce(b) sold(c) | $ | 1,096 | $ | 976 | $ | 1,021 | $ | 942 | ||
| Attributable production cost of sales per ounce sold on a by-product basis(c) | $ | 1,069 | $ | 936 | $ | 988 | $ | 892 | ||
| Attributable all-in sustaining cost per equivalent ounce(b) sold(c) | $ | 1,510 | $ | 1,353 | $ | 1,388 | $ | 1,316 | ||
| Attributable all-in sustaining cost per ounce sold on a by-product basis(c) | $ | 1,490 | $ | 1,328 | $ | 1,365 | $ | 1,284 | ||
| Attributable all-in cost per equivalent ounce(b) sold(c) | $ | 1,868 | $ | 1,709 | $ | 1,739 | $ | 1,634 | ||
| Attributable all-in cost per ounce sold on a by-product basis(c) | $ | 1,854 | $ | 1,699 | $ | 1,725 | $ | 1,619 | ||
(a) All measures and ratios include 100% of the results from Manh Choh, except measures and ratios denoted as “attributable.” “Attributable” measures and ratios include Kinross’ 70% share of Manh Choh production, sales, cash flow, capital expenditures and costs, as applicable.
(b) “Gold equivalent ounces” include silver ounces produced and sold converted to a gold equivalent based on a ratio of the average spot market prices for the commodities for each period. The ratio for the fourth quarter and full year 2024 was 84.67:1 and 84.43:1, respectively (fourth quarter and full year 2023 – 85.00:1 and 83.13:1, respectively).
(c) The definition and reconciliation of these non-GAAP financial measures and ratios is included on pages 25 to 31 of this news release. Non-GAAP financial measures and ratios have no standardized meaning under IFRS and therefore, may not be comparable to similar measures presented by other issuers.
(d) “Capital expenditures” is as reported as “Additions to property, plant and equipment” on the consolidated statements of cash flows.
(e) “Average realized gold price per ounce” is defined as gold revenue divided by total gold ounces sold.
(f) “Production cost of sales per equivalent ounce sold” is defined as production cost of sales divided by total gold equivalent ounces sold.
The following operating and financial results are based on fourth-quarter and year-end 2024 gold equivalent production:
Production: Kinross produced 501,209 Au eq. oz. in Q4 2024, compared with 546,513 Au eq. oz. in Q4 2023.
Over the full year, Kinross produced 2,128,052 Au eq. oz., largely in line with full-year 2023 production of 2,153,020 Au eq. oz.
Average realized gold price10: The average realized gold price in Q4 2024 was $2,663 per ounce, compared with $1,974 per ounce in Q4 2023. For full-year 2024, the average realized gold price per ounce was $2,393, compared with $1,945 per ounce for full-year 2023.
Revenue: During the fourth quarter, revenue increased to $1,415.8 million, compared with $1,115.7 million during Q4 2023. Revenue increased to $5,148.8 million for full-year 2024, compared with $4,239.7 million for full-year 2023. The 21% year-over-year increase is primarily due to the increase in the average realized gold price.
Production cost of sales: Production cost of sales per Au eq. oz.2 sold was $1,098 for Q4 2024, compared with $976 in Q4 2023. Production cost of sales per Au eq. oz.2 sold was $1,020 for full-year 2024, compared with $942 for full-year 2023.
Attributable production cost of sales per Au eq. oz. sold1 was $1,096 in Q4 2024, compared with $976 in Q4 2023, based on attributable gold sales of 517,980 ounces. Attributable production cost of sales per Au eq. oz. sold1 was $1,021 for full-year 2024, compared with $942 for full-year 2023, based on attributable gold sales of 2,111,688.
Margins4: Kinross’ margin per Au eq. oz. sold was $1,565 for Q4 2024, compared with the Q4 2023 margin of $998. Full-year 2024 margin per Au eq. oz. sold was $1,373, compared with $1,003 for full-year 2023.
Attributable all-in sustaining cost1: Attributable all-in sustaining cost per Au eq. oz. sold was $1,510 in Q4 2024, compared with $1,353 in Q4 2023. Full-year attributable all-in sustaining cost per Au eq. oz. sold was $1,388, compared with $1,316 for full-year 2023.
In Q4 2024, attributable all-in sustaining cost per Au oz. sold on a by-product basis1 was $1,490, compared with $1,328 in Q4 2023. Attributable all-in sustaining cost per Au oz. sold on a by-product basis1 was $1,365 for full-year 2024, compared with $1,284 in 2023.
Operating cash flow5: Operating cash flow was $734.5 million for Q4 2024, compared with $410.9 million for Q4 2023. Operating cash flow for full-year 2024 was $2,446.4 million, compared with $1,605.3 million for full-year 2023, primarily due to the increase in margins and favourable working capital movements.
Attributable adjusted operating cash flow1 for Q4 2024 was $614.1 million, compared with $409.6 million for Q4 2023. Attributable adjusted operating cash flow1 for full-year 2024 was $2,143.1 million, compared with $1,676.7 million in 2023.
Attributable free cash flow1: Record attributable free cash flow was $434.4 million in Q4 2024, compared with $116.7 million in Q4 2023. Record attributable free cash flow for full-year 2024 was $1,340.2 million compared with attributable free cash flow of $559.7 million in 2023.
Earnings6: Reported net earnings were $275.6 million for Q4 2024, or $0.22 per share, compared with reported net earnings of $65.4 million, or $0.06 per share, for Q4 2023. Full year reported net earnings in 2024 were $948.8 million, or $0.77 per share, compared with reported net earnings of $416.3 million, or $0.34 per share, in 2023.
Adjusted net earnings7, 8 were $240.0 million, or $0.20 per share, for Q4 2024, compared with $140.0 million, or $0.11 per share, for Q4 2023. Full-year adjusted net earnings7, 8 were $838.3 million, or $0.68 per share, compared with $539.8 million, or $0.44 per share, for full-year 2023.
Attributable capital expenditures1: Attributable capital expenditures were $278.8 million for Q4 2024, compared with $297.7 million for Q4 2023. Attributable capital expenditures for full-year 2024 were $1,050.9 million, compared with $1,055.0 million in 2023, which included the start of Phase S development at Round Mountain, continued work at Great Bear, and increased capital development at Tasiast for West Branch 5.
________________________
10 “Average realized gold price per ounce” is defined as gold revenue divided by total gold ounces sold.
Balance sheet
The Company continued to strengthen its balance sheet by repaying $250.0 million on its term loan in the quarter, totalling $800.0 million during 2024. The Company repaid the remaining $200.0 million on February 10, 2025, completing repayment of the $1.0 billion term loan.
Kinross had cash and cash equivalents of $611.5 million as of December 31, 2024, compared with $352.4 million at December 31, 2023.
The Company had additional available credit11 of $1.65 billion as of December 31, 2024, and total liquidity9 of approximately $2.3 billion.
________________________
11 “Available credit” is defined as available credit under the Company’s credit facilities and is calculated in Section 6 Liquidity and Capital Resources of Kinross’ MD&A for the year ended December 31, 2024.
Return of capital
Kinross is committed to enhancing shareholder returns through its continuing quarterly dividend. The dividend of $0.03 per common share is payable on March 20, 2025, to shareholders of record as of March 5, 2025.
Kinross is currently in the process of renewing its normal course issuer bid with the Toronto Stock Exchange, and at current gold prices, intends to reinstate a share buyback program later in 2025.
Operating results
Mine-by-mine summaries for 2024 fourth-quarter and full-year operating results may be found on pages 19 and 23 of this news release. Highlights include the following:
Tasiast had another excellent year in 2024, achieving record annual production and cash flow. The record annual production was mainly a result of record throughput following the completion of the Tasiast 24k project in the second half of 2023. Quarter-over-quarter, production was lower as a result of planned lower grades and mill maintenance, partially offset by improvements in recovery.
Tasiast’s full-year cost of sales per ounce sold was higher year-over-year primarily due to higher royalties as a result of the increase in gold prices and higher labour costs, largely offset by a higher proportion of costs allocated to capital development. Cost of sales per ounce sold increased quarter-over-quarter, mainly due to the decrease in production.
At Paracatu, full-year production decreased compared with 2023, mainly as a result of lower grades due to planned mine sequencing into harder material in the southwest area of the pit. Cost of sales per ounce sold was higher year-over-year due to lower production, higher drilling contractor and blasting supply costs, partially offset by favourable foreign exchange rates. Production decreased quarter-over-quarter mainly due to the lower throughput from the timing of mill maintenance and mine sequencing. Cost of sales per ounce sold was higher quarter-over-quarter due to the decrease in production, partially offset by favorable foreign exchange rates. In 2025, annual production is expected to increase as the site moves into higher-grade portions of the mine plan.
At La Coipa, full year production decreased compared with 2023 due to a decrease in silver grades and throughput, partially offset by an increase in gold grades. Production increased quarter-over-quarter due to higher throughput. Cost of sales per ounce sold was higher in both comparable periods primarily due to a lower proportion of mining activities related to capital development in 2024 and higher mill maintenance costs and optimization, partially offset by favourable foreign exchange rates. Kinross continues to progress permitting work for mine life extensions at La Coipa.
Full-year production at Fort Knox increased significantly compared with 2023, primarily due to first production from the higher-grade, higher-recovery ore from Manh Choh in the second half of 2024. Cost of sales per ounce sold was in line with 2023. Quarter-over-quarter production decreased and cost of sales per ounce sold increased due to the timing of processing Manh Choh ore, which was more heavily weighted to Q3 2024.
At Round Mountain, full-year production decreased compared with 2023 due to fewer ounces recovered from the heap leach pads, partially offset by higher mill production. Cost of sales per ounce sold was in line with 2023. Quarter-over-quarter, production was in line and cost of sales per ounce sold increased largely due to higher cost ounces produced from the heap leach pads.
At Bald Mountain, full-year production increased compared with 2023 due to higher grades. Full-year cost of sales per ounce sold decreased mainly due to lower supplies costs and higher production, partially offset by a lower proportion of mining activities related to capital development. Quarter-over-quarter, production was largely in line and cost of sales per ounce sold was lower mainly due to the timing of sales.
Development projects
Great Bear
At Great Bear, Kinross continues to progress its AEX program and Main Project permitting.
For the AEX program, early works, including tree clearing and earthworks, has commenced with the necessary permits received for all current activities. The two remaining permits required for full AEX completion and operation are under review by the regulatory authorities and are expected to be received later in the year, when they are required. Detailed engineering and procurement continue to advance.
The Company is focused on progressing AEX activities including construction of the exploration decline planned to commence in late 2025.
For the Main Project, Kinross is advancing detailed engineering and execution planning. The selection of design partners is well underway and work is planned to commence in Q1 2025. This work will provide key engineering information for permitting and construction.
The Company continues to work with the Impact Assessment Agency of Canada on advancing its Impact Statement, which is planned to be submitted later in 2025. Consultation continues with designated Indigenous communities, including discussions to finalize related agreements.
In 2025, Kinross has shifted from deep underground resource drilling to regional exploration work with the goal of identifying new open pit and underground deposits.
Kinross released its Preliminary Economic Assessment for Great Bear on September 10, 2024. The Project is expected to produce over 500,000 ounces per year at an all-in sustaining cost of approximately $800 per ounce during the first 8 years through a conventional, modest capital 10,000 tonne per day mill. In parallel, Kinross also released an updated mineral resource estimate increasing the inferred resource estimate by 568 koz. to 3.9 Moz. which was in addition to the M&I resource estimate of 2.7 Moz.
Bald Mountain Redbird
Kinross is pleased to announce plans to proceed with mining at the Redbird pit at Bald Mountain, which contains approximately 1 million oz. of gold reserve, following the receipt of the Juniper permit in the second half of 2024.
Kinross has approved mining of Phase 1 at Redbird, which contains 270 koz. and is expected to produce approximately 175 koz., extending production into 2028. Phase 2, unlocking another 680 koz. contained, could begin in 2026 and extend production from Bald Mountain through 2031.
Phase 1 lowers the initial capital risk by leveraging existing heap leach infrastructure, pulls forward production into 2027, and can progress in 2025 while work continues on optimizing the design and execution plan for Phase 2.
Phase 1 initial capex of $120 million is primarily pre-strip mining cost, and the project has an all-in sustaining cost of approximately $1,500/oz.
Lobo-Marte
Kinross is progressing baseline studies to support the Environmental Impact Assessment (EIA) for the Lobo-Marte project. Lobo-Marte continues to be a potential large, low-cost mine and Kinross is committed to progressing next steps to advance the project.
Company Guidance
The following section of the news release represents forward-looking information and users are cautioned that actual results may vary. We refer to the risks and assumptions contained in the Cautionary Statement on Forward-Looking Information on pages 41 and 42 of this news release.
This Company Guidance section below references attributable production cost of sales per equivalent ounce, attributable all-in sustaining cost per equivalent ounce sold, and sustaining, non-sustaining and attributable capital expenditures, which are non-GAAP ratios and financial measures, as applicable, with no standardized meaning under IFRS and therefore, may not be comparable to similar measures presented by other issuers. The definitions of these non-GAAP ratios and financial measures and comparable reconciliations are included on pages 25 to 31 of this news release.
Attributable1 production guidance
In 2025, Kinross expects to produce 2.0 million attributable Au eq. oz.12 (+/- 5%) from its operations. Production is expected to remain stable at 2.0 million attributable Au eq. oz.12 (+/- 5%) for each of 2026 and 2027. In 2024, Kinross produced 2.13 Au eq. oz.
| Annual attributable1 gold equivalent production guidance (+/- 5%) |
|
| 2025 | 2.0 million oz. |
| 2026 | 2.0 million oz. |
| 2027 | 2.0 million oz. |
________________________
12 Attributable gold equivalent ounce production guidance for 2025 includes approximately 4.3 million ounces of silver.
Attributable1 cost guidance
Attributable production cost of sales is expected to be $1,120 per Au eq. oz.1 (+/- 5%) for 2025. In 2024, production cost of sales2 and attributable production cost of sales1 were $1,020 per Au eq. oz. and $1,021 per Au eq. oz., respectively. The moderate year-over-year increase in 2025 is mainly due to lower overall production with a change in sales mix, including lower production at Tasiast, and inflationary impacts.
The Company expects its attributable all-in sustaining cost1 to be $1,500 per Au eq. oz. (+/- 5%) for 2025. In 2024, attributable all-in sustaining cost1 was $1,388 per Au eq. oz. sold. The expected increase in 2025 is largely a result of the increase in attributable production cost of sales.
2025 attributable1 production and cost guidance
| Q4 2024 results |
2024 full-year results |
2025 guidance (+/- 5%) |
|
| Gold equivalent basis | |||
| Production (Au eq. oz.) | 501,209 | 2.13 million | 2.0 million11 |
| Attributable production cost of sales per Au eq. oz. sold1 | $1,096 | $1,021 | $1,120 |
| Production cost of sales per Au eq. oz. sold2 | $1,098 | $1,020 | |
| Attributable all-in sustaining cost per Au eq. oz. sold1 | $1,510 | $1,388 | $1,500 |
2025 attributable1 production and cost guidance by country
| Country | 2025 attributable production guidance (Au eq. oz.)1, 12 (+/-5%) |
Percentage of total forecast production13 | 2025 attributable production cost of sales guidance (per Au eq. oz. sold)1,12 (+/-5%) |
2024 production cost of sales (per Au eq. oz. sold)2 |
2024 attributable production cost of sales (per Au eq. oz. sold)2 |
||||
| Mauritania | 500,000 | 25% | $860 | $681 | $681 | ||||
| Brazil | 585,000 | 29% | $1,025 | $1,039 | $1,039 | ||||
| Chile | 230,000 | 12% | $1,060 | $959 | $959 | ||||
| United States | 685,000 | 34% | $1,420 | $1,295 | $1,313 | ||||
| TOTAL | 2.0 million | 100% | $1,120 | $1,020 | $1,021 |
Material assumptions used to forecast 2025 guidance, most notably relating to production cost of sales, are as follows:
Taking into account existing currency and oil hedges:
________________________
13 The percentages are calculated based on the mid-point of country 2025 forecast production.
14 Refers to all of the currencies in the countries where the Company has mining operations, fluctuating simultaneously by 10% in the same direction, either appreciating or depreciating, taking into consideration the impact of hedging and the weighting of each currency within our consolidated cost structure.
Attributable capital expenditures15 guidance
Attributable capital expenditures for 2025 are forecast to be approximately $1,150 million (+/- 5%) and are summarized in the table below. In 2024, capital expenditures3 and attributable capital expenditures were $1,076 million and $1,051 million, respectively.
Kinross’ attributable capital expenditures outlook for 2026 and 2027 is approximately expected to be in line with 2025, subject to ongoing inflationary impacts.
| Country | Forecast 2025 sustaining capital15 (+/-5%) (attributable) (million) |
Forecast 2025 non-sustaining capital15 (+/-5%) (attributable) (million) |
Total 2025 forecast capital15 (+/-5%) (attributable) (million) |
2024 sustaining capital15 (million) |
2024 non-sustaining capital15 (million) |
2024 total capital15 (consolidated) (million) |
2024 total capital15 (attributable) (million) |
||||||
| Mauritania | $105 | $255 | $360 | $64 | $280 | $344 | $344 | ||||||
| Brazil | $195 | $0 | $195 | $141 | $0 | $141 | $141 | ||||||
| Chile | $50 | $10 | $60 | $66 | $15 | $81 | $81 | ||||||
| U.S. | $185 | $200 | $385 | $257 | $211 | $468 | $443 | ||||||
| Canada and other |
$0 | $150 | $150 | $(1) | $43 | $42 | $42 | ||||||
| TOTAL | $535 | $615 | $1,150 | $527 | $549 | $1,076 | $1,051 |
2025 sustaining capital15 includes the following forecast spending estimates:
| • | Mine development: | $55 million (United States), $10 million (Chile), $20 million (Mauritania) | |
| • | Mobile equipment: | $65 million (United States), $90 million (Brazil), $5 million (Chile), $35 million (Mauritania) | |
| • | Mill facilities: | $5 million (United States), $25 million (Brazil), $20 million (Chile), $10 million (Mauritania) | |
| • | Leach facilities: | $25 million (United States), $5 million (Chile) | |
| • | Tailings facilities: | $5 million (United States), $75 million (Brazil), $5 million (Chile), $10 million (Mauritania) | |
2025 non-sustaining capital15 includes the following forecast spending estimates:
| • | Tasiast West Branch stripping: | $255 million | |
| • | Great Bear AEX construction, detailed engineering and other: | $150 million | |
| • | Bald Mountain Redbird 1: | $75 million | |
| • | Round Mountain Phase S: | $75 million |
________________________
15 Forecast 2025 sustaining, non-sustaining and total forecast capital expenditures are on an attributable basis and include Kinross’ share of Manh Choh (70%) capital expenditures. Actual results as reported for the year ended December 31, 2024, for sustaining, non-sustaining and total capital expenditures (refer to footnote 3) are on a total basis and include 100% of Manh Choh capital expenditures. Sustaining, non-sustaining and attributable capital expenditures are non-GAAP financial measures (refer to footnote 7) and are defined and reconciled on pages 30 and 31 of this news release.
Other 2025 guidance
| Category | 2025 Guidance | Summary | |||
| Exploration and Business Development ($M) | $200 (+/- 5%) | 2025 guidance includes approximately $175 million of exploration spend on brownfields, minex and greenfields exploration targets (2024 – $166.4 million).
For details about the 2025 exploration program, see page 11. |
|||
| General and Administrative ($M) | $125 (+/- 5%) | In line with 2024 results. | |||
| Other Operating Costs ($M) | $125-$150 | Primarily relates to studies and permitting activities that do not meet the criteria for capitalization, as well as care and maintenance and reclamation activities at non-operating sites. | |||
| Effective Tax Rate (ETR)16 | 32% – 37% | ETR based on adjusted net earnings. | |||
| Taxes paid (cash) ($M) | $330 | Taxes paid is expected to increase by approximately $4 million for every $100/oz movement in the realized gold price. | |||
| DD&A ($/oz.)17 | $540 (+/- 5%) | In line with 2024 results. | |||
| Interest paid ($M) (incl. capitalized interest) | $75 | Includes approximately $20 million of capitalized interest and $55 million of interest expense. Interest expense excludes accretion of the Company’s reclamation and remediation obligations, as well as lease liabilities, which for 2024 totaled $42.3 million. (2024 – Total interest paid of $128.2 million, of which $92.6 million was capitalized. The 2025 decrease is due to the full repayment of the term loan on February 10th, 2025.) |
________________________
16 The forecast ETR range for 2025 assumes gold price, foreign exchange and tax rates in the jurisdictions in which the Company operates remain stable and within 2025 guidance assumptions. The ETR does not include the impact of items which the Company believes are not reflective of the Company’s underlying performance, such as the impact of net foreign currency translations on tax deductions and taxes related to prior periods. Management believes that the ETR range provides investors with the ability to better evaluate the Company’s underlying performance. However, the ETR range is not necessarily an indicator of tax expense recognized under IFRS. The rate is sensitive to the relative proportion of sales between the Company’s various tax jurisdictions and realized gold prices.
17 DD&A ($/oz) is defined as depreciation, depletion and amortization, as reported on the consolidated statements of operations, divided by total gold equivalent ounces sold.
Sustainability
Kinross continued to deliver strong sustainability performance throughout the year, reflected in strong Sustainability scores as measured by MSCI, LSEG, Moody’s, and Sustainalytics, and was named to the S&P 2025 Global Sustainability Yearbook for the 12th time since 2012.
Kinross’ robust approach to environmental performance includes advancing its climate change strategy. The Company is on track to achieve its greenhouse gas (GHG) target of reducing emissions intensity by 30% by 2030 from its 2021 baseline. In 2024, Kinross implemented more than 15 energy efficiency projects across sites, including haul route optimization, switching from diesel generators to electricity at fuel islands and lime silos, incorporation of electric buses, and other energy efficiency initiatives. The Company also advanced its estimation of Scope 3 GHG emissions and completed outreach with the suppliers representing the majority of total spend to understand their approaches to emissions reduction.
Kinross engages directly with local communities around its operations to understand their economic, social and development goals, working together to ensure that meaningful, long-term benefits are realized through job creation, training programs, procurement, tax payments, and targeted community programs. Flood relief aid was provided to communities in the south of both Mauritania and Brazil, including essential food supplies and emergency shelter. Paracatu worked with the World Gold Council to publish a video demonstrating the positive impact of community partnerships to support programs and projects that enhance the well-being of local people, with a particular focus on sustainability after mine closure. Kinross was also recognized with a 2024 award for Business Achievement in Sustainability by the Canadian Council for the Americas.
Kinross’ robust corporate governance standards for its Board of Directors continue to be driven by a focus on delivering value through a mix of skills and experience, diversity, director independence and succession planning. Kinross was the top scoring gold mining company in The Globe and Mail’s annual corporate governance ranking and increased its score by four points from 2023, ranking in the top 10% of companies overall.
Exploration update
In 2024, approximately 318,000 metres of drilling was completed for all exploration projects (brownfields, minex and greenfields).
Brownfields and minex exploration
The Company’s brownfields and minex exploration efforts – which accounted for approximately 85% of the Company’s exploration – continued to focus within the footprint of existing mines and projects during 2024.
Great Bear
Kinross’ exploration efforts at Great Bear in 2024 primarily focused on directional drilling beyond the 1,000-metre depth to show the underground potential of the asset, resulting in the addition of 568 koz. to the inferred resource, which was updated in September along with the release of a PEA.
The 2024 drilling intersected mineralization beyond the current resource and PEA inventory across multiple zones up to a vertical depth of 1,600 metres, demonstrating the system is still open with continuation of high-grade mineralization at depth and highlighting the potential for further resource additions.
Given the costs of drilling to this depth from surface and the significant resource already identified, late last year the exploration focus shifted to regional exploration work on the ~120 square kilometre land package to look for additional open pit and underground opportunities. In parallel, work on the AEX decline will be progressed to support future exploration at LP from underground.
Round Mountain
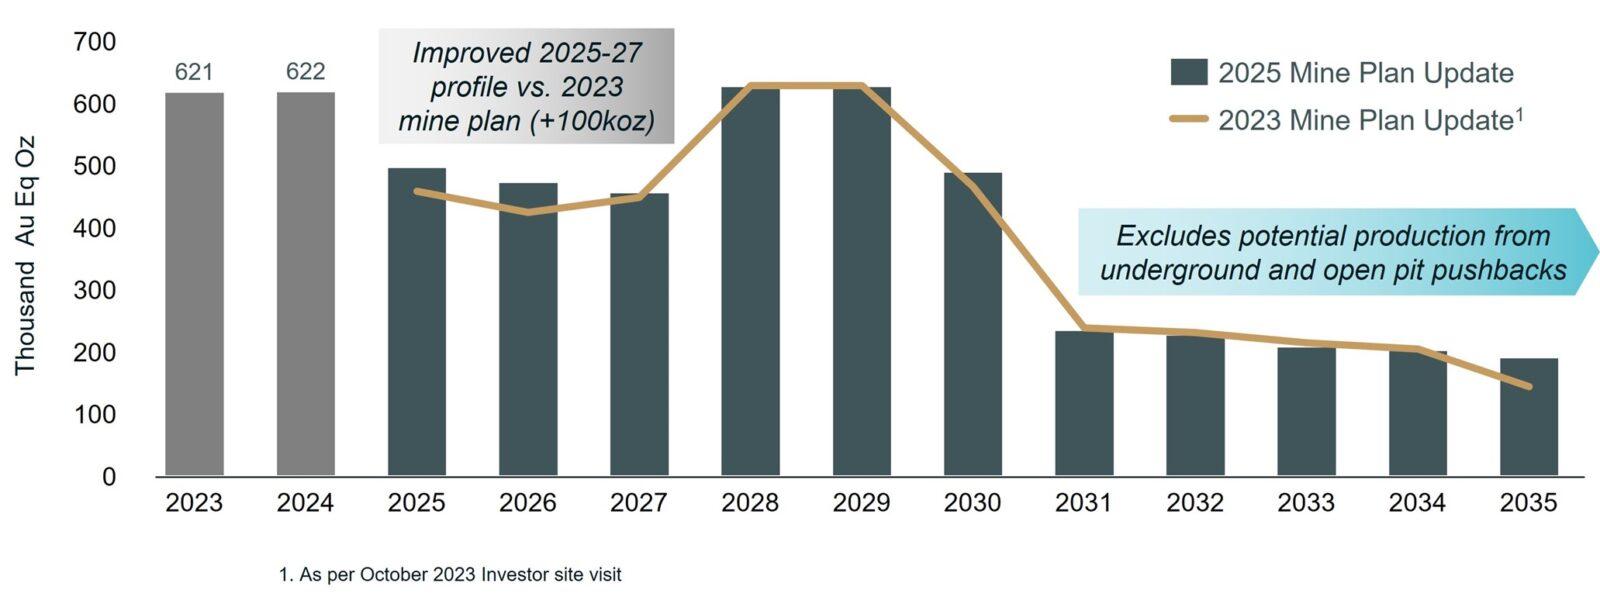
At Phase X, drilling in Q4 expanded infill drilling into the upper zone of the primary exploration target, with results showing numerous intercepts with strong widths and grades, supporting the thesis of potential for bulk mining at Phase X. Approximately 21,000 metres have been drilled at Phase X since starting the exploration decline in 2023. The program in 2024 successfully intersected both the upper and lower exploration targets, demonstrating continuous wide mineralization with strong grades, confirming our exploration thesis. Highlights from 2024 drilling include:
In 2025 Kinross will focus on completing infill drilling of the exploration target at Phase X to support further studies to progress the project.
At Gold Hill, approximately 5,000 metres of drilling were completed both from the bottom of the pit to better define the vein system and from surface, which extended one of the main targets 150 metres on strike.
Curlew Basin
The 30,400 metre 2024 drilling program at Curlew Basin successfully targeted higher grade extensions of mineralization and delivered the following successes:
In 2025, Kinross plans to continue this focus on higher-grade mineralization, targeting new discoveries and extensions of mineralization at North Stealth and Roadrunner.
Alaska
Drilling this year at Fort Knox focused on growth at two main targets: around the satellite Gil pit and around the Fort Knox pit. The growth highlights at Fort Knox have not been included in the current resource update and may offer potential to augment medium-term production plans at Fort Knox.
Gil highlights include:
Fort Knox highlights include:
An additional 2,466 metres of drilling occurred on the Fort Knox property, testing new target areas between the Fort Knox and Gil mines.
In 2025, drilling at Fort Knox will continue to focus on growth opportunities at Gil and around the Fort Knox pit, and will also target exploration along the structural trend between the Fort Knox and Gil deposits.
At Manh Choh, 4,760 metres of drilling was completed across six target areas identifying encouraging skarn alteration at three targets that will be followed up on in 2025. Surface sampling to identify new drill targets was completed along the mine road corridor and greater Tetlin lease in 2024.
Bald Mountain
Exploration drilling at Bald Mountain in 2024 focused on low-strip, near-pit extensions in the North and South area of operations and within the Bida trend, with roughly 21,000 metres drilled in the year on brownfields and minex programs.
2025 drilling will be focused on conversion of inferred resources at the Redbird pit and on generative projects looking for new deposits on the large, highly prospective land package at Bald Mountain.
Tasiast
At Tasiast, drill testing of the West Branch orebody at depth, to provide additional data for assessing future underground mining, commenced in the second half of the year. Wide zones of mineralization have been intersected down plunge of the current underground resource of 1.1 Moz. at 2.52 g/t, extending mineralization on strike and down plunge 700 metres to date.
At Fennec, which is a satellite deposit on the TMLSA license, work completed during the year resulted in the addition of 110 koz. to reserve.
On the SENISA licenses, two RC and two diamond drill rigs were actively drilling target areas. A total of 51,135 metres had been drilled by year end and drilling will continue throughout 2025.
Chile
The brownfields drilling program further delineated the gold porphyry mineralization potential at Cerros Bravos. The porphyry is located approximately 8 kilometres due north of Kinross’ mine facilities. Step out drilling and geophysics carried out in 2024 helped define new targets for further work in 2025 at Cerros Bravos.
2025 drilling in Chile will also focus on existing known trends on the La Coipa license looking for extensions of previously mined orebodies and for new mineralization.
Brazil
Brownfields exploration focused on systematically testing targets on the Company’s extensive land packages, which extend over 35 kilometres along the northwest corridor from the Paracatu mine, with results showing similar style and grade of mineralization to Paracatu. Along the south corridor from Paracatu, reconnaissance mapping, soil sampling, and ground IP and Lidar surveys were also completed in 2024, generating additional targets, which will be drill tested in 2025.
Greenfields exploration update
The greenfields exploration strategy is to identify and explore in areas that have the potential to host high-grade gold deposits. The Company looks for opportunities where it can stake its own claims or collaborate with high-quality junior exploration companies through either joint venture agreements or via equity investment. The primary focus is exploring for orogenic, epithermal, Carlin and intrusion related gold and gold-copper style deposits.
The greenfields exploration programs in 2024 were focused on targets located in Canada, the U.S.A. and Finland with approximately 45,000 metres of drilling completed on all projects.
Canada
Outside of Great Bear, the focus in Canada was primarily on the large land holdings in Snow Lake, Manitoba, where Kinross has 100% ownership of six exploration properties: Laguna, Laguna North, Puella Bay, Lucky Jack, DSN and SLG.
Drilling on the Laguna and the Laguna North properties has continued to define and extend high-grade mineralization on multiple gold rich, shear hosted vein systems. Kinross is focused on expanding identified veins and discovering additional vein systems on the property to increase the critical mass of mineralization to support further work.
Kinross is also progressing prospecting and mapping on the SLG property to find new veins after identifying a 200 metres long shear zone in 2023. The 2024 work identified two new shear zones 1.5 kilometres and 4 kilometres from the 2023 shear zone, with grab samples on the new zones showing strong grades including 78.9 g/t, 38.2 g/t, 30.8 g/t, 23.9 g/t, 14.2 g/t,13.75 g/t, 13.25 g/t, and 12.25 g/t within quartz veins.
Outside of Manitoba, Kinross has 100% ownership of four greenfield exploration properties in northwest Ontario, three of which are in the Red Lake district outside of the Great Bear property. Initial reconnaissance mapping and prospecting on one of those properties yielded grab samples of 12.35 g/t, 2.3 g/t, 3.55 g/t, 3.17 g/t and 5.16 g/t Au in newly identified quartz veins. Kinross plans to follow-up with detailed mapping and prospecting in 2025.
In October 2024, an option agreement was signed with Puma Exploration Inc. for a 65% interest in their Williams Brook property in New Brunswick. The Williams Brook project has seen early-stage work completed by Puma which has identified 5 anomalous zones including Lynx, Tiger, Cheetah, Jaguar, and Cougar. Highlights from each target include 5.55 g/t Au over 50.15m at Lynx and grab samples of values up to up to 34 g/t Au at Jaguar, 60.10 g/t Au at Cougar, 6.69 g/t Au at Cheetah and 19.9 g/t Au at Tiger.
U.S.A.
Kinross holds a number of projects in Nevada that are either 100% owned or are in joint venture with private individuals, or state agencies. Work on Kinross’ Nevada projects in 2024 included geophysics, prospecting, mapping, and RC and diamond drilling of early-stage targets.
In March 2024, a joint venture was established with Riley Gold Corporation on its PWC project, which is contiguous with the western boundary of Nevada Gold Mines’ Pipeline Complex. In September 2024, Kinross completed an initial diamond drill hole, designed to test for favourable lower plate carbonate Carlin-type host rocks. The initial 1,095 metre drill hole successfully intercepted the favourable lower plate carbonates starting at a depth of 715 metres, demonstrating that known Cortez District host lithologies exist at explorable drill depths over a large, untested area. Further drilling will begin in Q2 2025.
Work continues evaluating and advancing new pipeline projects through third party agreements and on opportunistic claim staking and drill testing of opportunities in the principal metallogenic belts throughout the U.S. Great Basin, including the Walker Lane and the primary trends of Carlin-type deposits.
Finland
Kinross is progressing exploration on its own land positions and with joint venture partners in Finland on the Central Lapland Greenstone Belt, along a greenstone belt of similar scale to the Abitibi that has had limited historical gold exploration and development. Kinross’ land positions are proximal to Agnico Eagle’s Kittilä Gold mine and Rupert Resource’s Ikkari gold deposit, which reported more than 4 million ounces at 2.2 g/t Au in indicated resources.
Work in 2024 included approximately 11,000 meters of base-of-till drilling which is used to test the surface of bedrock under cover for gold anomalies. Base-of-till drilling was used successfully in the discoveries of Rupert Resource’s Ikkari gold deposit and Agnico Eagle’s Kittilä gold mine, and the work on Kinross’ properties in 2024 identified numerous gold anomalies.
Kinross also completed approximately 4,800 metres of diamond drilling to follow up on identified gold anomalies in 2024, with results showing encouraging gold grades at Launi-East including 5.23 g/t over 3.65m and 10.05 g/t over 0.95m. Kinross will continue to follow up on identified targets in 2025.
2025 Focus
2025 exploration expenditure guidance (brownfields, minex and greenfields) is $175 million (+/-5%) compared with the $166.4 million spent in 2024. The 2025 programs are designed to follow-up on existing zones of mineralization and to make new discoveries in all of Kinross’ jurisdictions.
Priority exploration projects:
Appendix A: Refer to page 39 of this news release for supplementary illustrations.
Full drill results are available here: https://www.kinross.com/Exploration-Drill-Results-Appendix-A-Q4-YE-2024
2024 Mineral Reserves and Mineral Resources update
(See the Company’s detailed Annual Mineral Reserve and Mineral Resource Statement estimated as at December 31, 2024 and explanatory notes starting at page 33.)
Kinross increased its gold price assumptions from $1,400 per ounce to $1,600 per ounce for its mineral reserve estimates and from $1,700 per ounce to $2,000 per ounce for its mineral resource estimates, as of December 31, 202418.
The Company also increased its silver price assumptions to $20 per ounce and $25 per ounce for its mineral reserve and mineral resource estimates, respectively.
Kinross continues to prioritize quality, high-margin, low-cost ounces in its portfolio, and maintained its fully loaded costing methodology.
Kinross is focused on upgrading the quality of its resources through delineating high-grade gold ounces with the objective of converting to reserves. In 2024, Kinross added 1.7 million ounces to its inferred resource, which included high-grade additions at both Great Bear and Curlew.
| Kinross Gold Mineral Reserve and Mineral Resource estimates19 | ||||
| 2023 (Au koz.) |
Depletion (Au koz.) |
Geology & Engineering (Au koz.) |
2024 (Au koz.) |
|
| Proven and Probable Reserves | 22,757 | (2,360) | 1,461 | 21,857 |
| Measured and Indicated Resources | 25,968 | 11820 | (220) | 25,867 |
| Inferred Resources | 11,484 | (25) | 1,734 | 13,193 |
________________________
18 Please see pages 36 and 37 for Mineral Reserve and Mineral Resource Statement Notes.
19 Rounding of values to the 000s may result in apparent discrepancies.
20 M&I depletion is positive due to the addition of 221 koz. stockpile to resource at Tasiast in 2024.
Proven and Probable Mineral Reserves
Kinross’ total proven and probable mineral reserve estimates decreased by 4%, or 0.9 million Au oz., to 21.9 million Au oz. at year-end 2024 compared with 22.8 million Au oz. at year-end 2023. The net decrease was mostly due to depletion, with decreases offset by a net increase of 1.5 million ounces driven by increases at Bald Mountain, Tasiast, and Paracatu.
Bald Mountain reserves increased by 971 koz. before depletion driven by conversion of resources to reserves at Redbird after receiving permits for the Juniper land package.
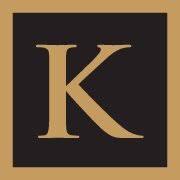
At Tasiast, a new life of mine plan has been completed following the 2024 reserve update. Production from Tasiast from 2025 through 2027 is decreasing compared to 2024 driven by mine plan sequencing and lower grades during the stripping phase of West Branch 5. The new life of mine plan has shown an increase of 100 koz. over that 3-year period as compared to the previous life of mine plan on the back of operational improvements, design optimizations, and the addition of the Fennec satellite pit.
The following graph illustrates Tasiast’s reserve and mine plan update:
Measured and Indicated Mineral Resources
Kinross’ total measured and indicated mineral resource estimate at year-end 2024 was 25.9 million Au oz. compared with 26.0 million Au oz. at year-end 2023. The slight decrease is the result of net growth on the higher gold price and new drilling less the conversion of resources to reserves.
Inferred Mineral Resources
Kinross’ total inferred mineral resource estimate increased by 15% or 1.7 million Au oz. to 13.2 million Au oz. at year-end 2024, compared with 11.5 million Au oz. at year-end 2023. The increase in net growth, with additions from most sites across the portfolio, was driven by new drilling at Great Bear and Curlew and growth on higher gold price.
Board update
As previously disclosed, Catherine McLeod-Seltzer, an independent Board member since 2005 and Chair of the Board since 2019, has announced that she will not be standing for election at the Company’s annual meeting of shareholders in May 2025. Following a robust succession process, Kelly Osborne has been approved as Chair of the Board, effective upon his re-election as an independent director at the Company’s annual meeting of shareholders on May 7, 2025.
Ms. McLeod-Seltzer has made numerous and significant contributions during her 20-year directorship at the Company. She has overseen the dramatic reshaping of Kinross’ portfolio as the Company exited and entered new operating jurisdictions, acquired the Great Bear development project, and lead the strong focus on debt reduction and returning capital to shareholders. During her tenure, she championed diversity at all levels of the organization, including at the Board level and Senior Leadership Team, drove a results-based focus on Sustainability performance, and also oversaw a number of key governance initiatives including an effective Board succession program that has added six new Directors during her tenure as Chair.
Ms. McLeod-Seltzer’s extensive leadership, having been a founder, Board member and Chief Executive Officer in numerous mineral companies, has been recognized with several awards: She was named “Mining Man of the Year” by The Northern Miner in 1999; given the “Award for Performance” in 1997 and the Peak Award for Significant Board Contribution in 2021 by the Association of Women in Finance; named on the Financial Post’s “Power 50”; has received the “Canada’s Most Powerful Women Top 100 Award”; and was named one of “100 Global Inspirational Women in Mining” in 2013 and 2016 by Women In Mining (UK).
Mr. Osborne, an independent Director of Kinross since 2015, has served on the Corporate Governance and Nominating Committee and Corporate Responsibility and Technical Committee during his tenure, and served as Chair of the Corporate Responsibility and Technical Committee from 2018 until 2024. In addition, Mr. Osborne had an extensive career in the mining industry as an operator and senior executive, most recently serving as the CEO of a U.S.-based, wholly owned subsidiary of Antofagasta plc., until his retirement in June 2022.
“We are pleased that Kelly Osborne will take on the role of Independent Chair and look forward to his guidance and stewardship as we continue to deliver value for our shareholders,” said J. Paul Rollinson, CEO. “On behalf of the Board and Kinross management, I would like to extend a sincere thank you to Catherine for her leadership and dedication to the Company over the last 20 years. Catherine has been a central part of our culture and values, and the strong position Kinross is in today is largely due to her support as we advanced and executed on our strategic priorities.”
The Board of Directors has appointed Dr. George Albino as a Director with an effective date of January 1, 2025. Dr. Albino is a geologist with over 45 years of experience in mining and finance, including 19 years as a sell-side mining analyst primarily focused on gold stocks. Dr. Albino was previously a Director with Eldorado Gold Corporation, including serving as Chair, and a Director with Orla Mining. He holds a Ph.D. in Economic Geology and Geochemistry from the University of Western Ontario, a M.Sc. in Economic Geology from Colorado State University, and a B.A.Sc. in Geological Engineering from Queen’s University.
This release should be read in conjunction with Kinross’ 2024 year-end Financial Statements and Management’s Discussion and Analysis report at www.kinross.com. Kinross’ 2024 year-end Financial Statements and Management’s Discussion and Analysis have been filed with Canadian securities regulators (available at www.sedarplus.ca) and furnished with the U.S. Securities and Exchange Commission (available at www.sec.gov). Kinross shareholders may obtain a copy of the financial statements free of charge upon request to the Company.
About Kinross Gold Corporation
Kinross is a Canadian-based global senior gold mining company with operations and projects in the United States, Brazil, Mauritania, Chile and Canada. Our focus is on delivering value based on the core principles of responsible mining, operational excellence, disciplined growth, and balance sheet strength. Kinross maintains listings on the Toronto Stock Exchange (symbol: K) and the New York Stock Exchange (symbol: KGC).
Review of operations
| Three months ended December 31, | Gold equivalent ounces | ||||||||||||||
| Produced | Sold | Production cost of sales ($millions) |
Production cost of sales/equivalent ounce sold |
||||||||||||
| 2024 | 2023 | 2024 | 2023 | 2024 | 2023 | 2024 | 2023 | ||||||||
| Tasiast | 139,411 | 160,764 | 144,041 | 171,199 | 104.4 | 110.4 | 725 | 645 | |||||||
| Paracatu | 123,899 | 127,940 | 124,690 | 132,886 | 131.6 | 144.2 | 1,055 | 1,085 | |||||||
| La Coipa | 58,533 | 73,823 | 57,852 | 73,477 | 68.2 | 52.9 | 1,179 | 720 | |||||||
| Fort Knox | 104,901 | 84,215 | 108,512 | 81,306 | 141.0 | 104.3 | 1,299 | 1,283 | |||||||
| Round Mountain | 42,969 | 55,764 | 45,342 | 56,495 | 80.0 | 82.6 | 1,764 | 1,462 | |||||||
| Bald Mountain | 44,642 | 44,007 | 51,291 | 49,375 | 58.7 | 57.1 | 1,144 | 1,156 | |||||||
| United States Total | 192,512 | 183,986 | 205,145 | 187,176 | 279.7 | 244.0 | 1,363 | 1,304 | |||||||
| Less: Manh Choh non-controlling interest (30%) | (13,146 | ) | – | (13,749 | ) | – | (15.9 | ) | – | ||||||
| United States Attributable Total | 179,366 | 183,986 | 191,396 | 187,176 | 263.8 | 244.0 | 1,378 | 1,304 | |||||||
| Operations Total(a) | 514,355 | 546,513 | 531,729 | 565,389 | 583.8 | 552.0 | 1,098 | 976 | |||||||
| Attributable Total(a) | 501,209 | 546,513 | 517,980 | 565,389 | 567.9 | 552.0 | 1,096 | 976 | |||||||
| Years ended December 31, | Gold equivalent ounces | ||||||||||||||
| Produced | Sold | Production cost of sales ($millions) |
Production cost of sales/equivalent ounce sold | ||||||||||||
| 2024 | 2023 | 2024 | 2023 | 2024 | 2023 | 2024 | 2023 | ||||||||
| Tasiast | 622,394 | 620,793 | 609,614 | 615,065 | 415.4 | 406.8 | 681 | 661 | |||||||
| Paracatu | 528,574 | 587,999 | 528,209 | 592,224 | 548.6 | 538.6 | 1,039 | 909 | |||||||
| La Coipa | 246,131 | 260,138 | 241,077 | 268,491 | 231.3 | 182.8 | 959 | 681 | |||||||
| Fort Knox | 377,258 | 290,651 | 375,402 | 287,532 | 452.5 | 343.5 | 1,205 | 1,195 | |||||||
| Round Mountain | 215,387 | 235,690 | 214,996 | 234,064 | 328.3 | 357.7 | 1,527 | 1,528 | |||||||
| Bald Mountain | 181,047 | 157,749 | 182,760 | 180,139 | 220.3 | 223.5 | 1,205 | 1,241 | |||||||
| United States Total | 773,692 | 684,090 | 773,158 | 701,735 | 1,001.1 | 924.7 | 1,295 | 1,318 | |||||||
| Less: Manh Choh non-controlling interest (30%) | (42,739 | ) | – | (41,524 | ) | – | (40.8 | ) | – | ||||||
| United States Attributable Total | 730,953 | 684,090 | 731,634 | 701,735 | 960.3 | 924.7 | 1,313 | 1,318 | |||||||
| Operations Total(a) | 2,170,791 | 2,153,020 | 2,153,212 | 2,179,936 | 2,197.1 | 2,054.4 | 1,020 | 942 | |||||||
| Attributable Total(a) | 2,128,052 | 2,153,020 | 2,111,688 | 2,179,936 | 2,156.3 | 2,054.4 | 1,021 | 942 | |||||||
(a) Totals include immaterial sales and related costs from Maricunga for each period presented.
Consolidated balance sheets
| (expressed in millions of U.S. dollars, except share amounts) | |||||||||
| As at | |||||||||
| December 31, | December 31, | ||||||||
| 2024 | 2023 | ||||||||
| Assets | |||||||||
| Current assets | |||||||||
| Cash and cash equivalents | $ | 611.5 | $ | 352.4 | |||||
| Restricted cash | 10.2 | 9.8 | |||||||
| Accounts receivable and prepaid assets | 257.3 | 268.7 | |||||||
| Current income tax recoverable | 0.9 | 3.4 | |||||||
| Inventories | 1,243.2 | 1,153.0 | |||||||
| Other current assets | 3.6 | 15.0 | |||||||
| 2,126.7 | 1,802.3 | ||||||||
| Non-current assets | |||||||||
| Property, plant and equipment | 7,968.6 | 7,963.2 | |||||||
| Long-term investments | 51.9 | 54.7 | |||||||
| Other long-term assets | 713.1 | 710.6 | |||||||
| Deferred tax assets | 5.3 | 12.5 | |||||||
| Total assets | $ | 10,865.6 | $ | 10,543.3 | |||||
| Liabilities | |||||||||
| Current liabilities | |||||||||
| Accounts payable and accrued liabilities | $ | 543.0 | $ | 531.5 | |||||
| Current income tax payable | 236.7 | 92.9 | |||||||
| Current portion of long-term debt | 199.9 | – | |||||||
| Current portion of provisions | 62.5 | 48.8 | |||||||
| Other current liabilities | 18.0 | 12.3 | |||||||
| 1,060.1 | 685.5 | ||||||||
| Non-current liabilities | |||||||||
| Long-term debt | 1,235.5 | 2,232.6 | |||||||
| Provisions | 941.5 | 889.9 | |||||||
| Other long-term liabilities | 78.9 | 99.9 | |||||||
| Deferred tax liabilities | 549.0 | 449.7 | |||||||
| Total liabilities | $ | 3,865.0 | $ | 4,357.6 | |||||
| Equity | |||||||||
| Common shareholders’ equity | |||||||||
| Common share capital | $ | 4,487.3 | $ | 4,481.6 | |||||
| Contributed surplus | 10,643.0 | 10,646.0 | |||||||
| Accumulated deficit | (8,181.3 | ) | (8,982.6 | ) | |||||
| Accumulated other comprehensive loss | (87.4 | ) | (61.3 | ) | |||||
| Total common shareholders’ equity | 6,861.6 | 6,083.7 | |||||||
| Non-controlling interests | 139.0 | 102.0 | |||||||
| Total equity | $ | 7,000.6 | $ | 6,185.7 | |||||
| Total liabilities and equity | $ | 10,865.6 | $ | 10,543.3 | |||||
| Common shares | |||||||||
| Authorized | Unlimited | Unlimited | |||||||
| Issued and outstanding | 1,229,125,606 | 1,227,837,974 | |||||||
Consolidated statements of operations
| (expressed in millions of U.S. dollars, except per share amounts) | |||||||||
| Years ended | |||||||||
| December 31, | December 31, | ||||||||
| 2024 | 2023 | ||||||||
| Revenue | |||||||||
| Metal sales | $ | 5,148.8 | $ | 4,239.7 | |||||
| Cost of sales | |||||||||
| Production cost of sales | 2,197.1 | 2,054.4 | |||||||
| Depreciation, depletion and amortization | 1,147.5 | 986.8 | |||||||
| Impairment (reversal) charge | (74.1 | ) | 38.9 | ||||||
| Total cost of sales | 3,270.5 | 3,080.1 | |||||||
| Gross profit | 1,878.3 | 1,159.6 | |||||||
| Other operating expense | 14.0 | 64.5 | |||||||
| Exploration and business development | 197.8 | 185.0 | |||||||
| General and administrative | 126.2 | 108.7 | |||||||
| Operating earnings | 1,540.3 | 801.4 | |||||||
| Other income (expense) – net | 14.3 | (27.3 | ) | ||||||
| Finance income | 18.2 | 40.5 | |||||||
| Finance expense | (91.4 | ) | (106.0 | ) | |||||
| Earnings before tax | 1,481.4 | 708.6 | |||||||
| Income tax expense – net | (487.4 | ) | (293.2 | ) | |||||
| Net earnings | $ | 994.0 | $ | 415.4 | |||||
| Net earnings (loss) attributable to: | |||||||||
| Non-controlling interests | $ | 45.2 | $ | (0.9 | ) | ||||
| Common shareholders | $ | 948.8 | $ | 416.3 | |||||
| Earnings per share attributable to common shareholders | |||||||||
| Basic | $ | 0.77 | $ | 0.34 | |||||
| Diluted | $ | 0.77 | $ | 0.34 | |||||
Consolidated statements of cash flows
| (expressed in millions of U.S. dollars) | |||||||||
| Years ended | |||||||||
| December 31, | December 31, | ||||||||
| 2024 | 2023 | ||||||||
| Net inflow (outflow) of cash related to the following activities: | |||||||||
| Operating: | |||||||||
| Net earnings | $ | 994.0 | $ | 415.4 | |||||
| Adjustments to reconcile net earnings to net cash provided from operating activities: | |||||||||
| Depreciation, depletion and amortization | 1,147.5 | 986.8 | |||||||
| Impairment (reversal) charge | (74.1 | ) | 38.9 | ||||||
| Share-based compensation expense | 9.0 | 6.7 | |||||||
| Finance expense | 91.4 | 106.0 | |||||||
| Deferred tax expense | 112.2 | 143.9 | |||||||
| Foreign exchange gains and other | (59.1 | ) | (8.6 | ) | |||||
| Reclamation expense (recovery) | 6.9 | (19.2 | ) | ||||||
| Changes in operating assets and liabilities: | |||||||||
| Accounts receivable and other assets | 11.7 | 68.7 | |||||||
| Inventories | 14.3 | (91.4 | ) | ||||||
| Accounts payable and accrued liabilities | 370.8 | 95.5 | |||||||
| Cash flow provided from operating activities | 2,624.6 | 1,742.7 | |||||||
| Income taxes paid | (178.2 | ) | (137.4 | ) | |||||
| Net cash flow provided from operating activities | 2,446.4 | 1,605.3 | |||||||
| Investing: | |||||||||
| Additions to property, plant and equipment | (1,075.5 | ) | (1,098.3 | ) | |||||
| Interest paid capitalized to property, plant and equipment | (92.6 | ) | (114.1 | ) | |||||
| Net (additions) disposals to long-term investments and other assets | (38.4 | ) | 1.7 | ||||||
| (Increase) decrease in restricted cash – net | (0.4 | ) | 25.3 | ||||||
| Interest received and other – net | 17.0 | 18.2 | |||||||
| Net cash flow of continuing operations used in investing activities | (1,189.9 | ) | (1,167.2 | ) | |||||
| Net cash flow of discontinued operations provided from investing activities | 10.0 | 45.0 | |||||||
| Financing: | |||||||||
| Repayment of debt | (800.0 | ) | (960.0 | ) | |||||
| Proceeds from issuance or drawdown of debt | – | 588.1 | |||||||
| Interest paid | (35.6 | ) | (53.2 | ) | |||||
| Payment of lease liabilities | (12.1 | ) | (30.2 | ) | |||||
| Funding from non-controlling interest | 31.3 | 46.2 | |||||||
| Distributions paid to non-controlling interest | (40.5 | ) | – | ||||||
| Dividends paid to common shareholders | (147.5 | ) | (147.3 | ) | |||||
| Other – net | (1.5 | ) | 7.4 | ||||||
| Net cash flow used in financing activities | (1,005.9 | ) | (549.0 | ) | |||||
| Effect of exchange rate changes on cash and cash equivalents | (1.5 | ) | 0.2 | ||||||
| Increase (decrease) in cash and cash equivalents | 259.1 | (65.7 | ) | ||||||
| Cash and cash equivalents, beginning of period | 352.4 | 418.1 | |||||||
| Cash and cash equivalents, end of period | $ | 611.5 | $ | 352.4 | |||||
| Operating Summary | |||||||||||||||||||
| Mine | Period | Tonnes Ore Mined | Ore Processed (Milled) | Ore Processed (Heap Leach) | Grade (Mill) | Grade (Heap Leach) | Recovery (a)(b) | Gold Eq Production(c) | Gold Eq Sales(c) | Production cost of sales | Production cost of sales/oz(d) | Cap Ex – sustaining(e) | Total Cap Ex (e) | ||||||
| (‘000 tonnes) | (‘000 tonnes) | (‘000 tonnes) | (g/t) | (g/t) | (%) | (ounces) | (ounces) | ($ millions) | ($/ounce) | ($ millions) | ($ millions) | ||||||||
| West Africa | Tasiast | Q4 2024 | 1,824 | 2,205 | – | 2.13 | – | 94 | % | 139,411 | 144,041 | $ | 104.4 | $ | 725 | $ | 33.7 | $ | 105.4 |
| Q3 2024 | 1,748 | 2,203 | – | 2.46 | – | 91 | % | 162,155 | 158,521 | $ | 109.0 | $ | 688 | $ | 13.5 | $ | 83.8 | ||
| Q2 2024 | 1,985 | 2,161 | – | 2.70 | – | 92 | % | 161,629 | 156,038 | $ | 102.3 | $ | 656 | $ | 7.0 | $ | 75.2 | ||
| Q1 2024 | 2,044 | 2,073 | – | 2.46 | – | 91 | % | 159,199 | 151,014 | $ | 99.7 | $ | 660 | $ | 10.1 | $ | 79.5 | ||
| Q4 2023 | 2,937 | 2,056 | – | 3.04 | – | 93 | % | 160,764 | 171,199 | $ | 110.4 | $ | 645 | $ | 9.7 | $ | 85.2 | ||
| Americas | Paracatu | Q4 2024 | 12,944 | 13,116 | – | 0.40 | – | 80 | % | 123,899 | 124,690 | $ | 131.6 | $ | 1,055 | $ | 35.1 | $ | 35.1 |
| Q3 2024 | 13,127 | 14,551 | – | 0.38 | – | 81 | % | 146,174 | 145,235 | $ | 146.1 | $ | 1,006 | $ | 41.2 | $ | 41.2 | ||
| Q2 2024 | 14,094 | 15,053 | – | 0.35 | – | 80 | % | 130,228 | 130,174 | $ | 135.2 | $ | 1,039 | $ | 44.6 | $ | 44.6 | ||
| Q1 2024 | 14,078 | 15,609 | – | 0.31 | – | 79 | % | 128,273 | 128,110 | $ | 135.7 | $ | 1,059 | $ | 19.6 | $ | 19.6 | ||
| Q4 2023 | 16,865 | 15,279 | – | 0.35 | – | 79 | % | 127,940 | 132,886 | $ | 144.2 | $ | 1,085 | $ | 41.6 | $ | 41.6 | ||
| La Coipa(f) | Q4 2024 | 1,385 | 1,017 | – | 1.98 | – | 79 | % | 58,533 | 57,852 | $ | 68.2 | $ | 1,179 | $ | 26.6 | $ | 26.6 | |
| Q3 2024 | 786 | 809 | – | 2.17 | – | 80 | % | 50,502 | 48,594 | $ | 52.2 | $ | 1,074 | $ | 21.3 | $ | 24.9 | ||
| Q2 2024 | 690 | 882 | – | 1.97 | – | 84 | % | 65,851 | 63,506 | $ | 58.8 | $ | 926 | $ | 10.7 | $ | 10.7 | ||
| Q1 2024 | 1,035 | 827 | – | 2.09 | – | 87 | % | 71,245 | 71,125 | $ | 52.1 | $ | 733 | $ | 7.2 | $ | 7.2 | ||
| Q4 2023 | 1,591 | 1,188 | – | 1.92 | – | 78 | % | 73,823 | 73,477 | $ | 52.9 | $ | 720 | $ | 7.0 | $ | 10.9 | ||
| Fort Knox (100%)(g) | Q4 2024 | 7,692 | 1,524 | 6,664 | 1.51 | 0.21 | 82 | % | 104,901 | 108,512 | $ | 141.0 | $ | 1,299 | $ | 53.3 | $ | 54.0 | |
| Q3 2024 | 7,612 | 1,105 | 5,822 | 4.03 | 0.19 | 91 | % | 149,093 | 140,121 | $ | 134.2 | $ | 958 | $ | 56.6 | $ | 70.4 | ||
| Q2 2024 | 8,331 | 2,003 | 6,385 | 0.85 | 0.22 | 81 | % | 69,914 | 70,477 | $ | 94.8 | $ | 1,345 | $ | 47.6 | $ | 89.2 | ||
| Q1 2024 | 10,037 | 1,850 | 8,778 | 0.67 | 0.24 | 76 | % | 53,350 | 56,292 | $ | 82.5 | $ | 1,466 | $ | 37.7 | $ | 78.6 | ||
| Q4 2023 | 11,018 | 2,173 | 9,930 | 0.69 | 0.22 | 78 | % | 84,215 | 81,306 | $ | 104.3 | $ | 1,283 | $ | 50.6 | $ | 114.3 | ||
| Fort Knox (attributable)(g) |
Q4 2024 | 7,619 | 1,483 | 6,664 | 1.28 | 0.21 | 81 | % | 91,755 | 94,763 | $ | 125.1 | $ | 1,320 | $ | 51.1 | $ | 52.1 | |
| Q3 2024 | 7,509 | 991 | 5,822 | 3.44 | 0.19 | 91 | % | 119,500 | 112,346 | $ | 109.3 | $ | 973 | $ | 55.4 | $ | 67.2 | ||
| Q2 2024 | 8,249 | 2,003 | 6,385 | 0.85 | 0.22 | 81 | % | 69,914 | 70,477 | $ | 94.8 | $ | 1,345 | $ | 47.6 | $ | 79.5 | ||
| Q1 2024 | 10,009 | 1,850 | 8,778 | 0.67 | 0.24 | 76 | % | 53,350 | 56,292 | $ | 82.5 | $ | 1,466 | $ | 37.7 | $ | 68.8 | ||
| Q4 2023 | 11,014 | 2,173 | 9,930 | 0.69 | 0.22 | 78 | % | 84,215 | 81,306 | $ | 104.3 | $ | 1,283 | $ | 50.6 | $ | 100.7 | ||
| Round Mountain | Q4 2024 | 3,111 | 768 | 1,736 | 1.05 | 0.22 | 82 | % | 42,969 | 45,342 | $ | 80.0 | $ | 1,764 | $ | 4.4 | $ | 33.9 | |
| Q3 2024 | 2,958 | 790 | 1,032 | 0.74 | 0.29 | 80 | % | 42,279 | 41,436 | $ | 63.8 | $ | 1,540 | $ | 5.2 | $ | 35.9 | ||
| Q2 2024 | 2,956 | 806 | 1,541 | 1.11 | 0.35 | 73 | % | 61,787 | 60,049 | $ | 93.9 | $ | 1,564 | $ | 2.1 | $ | 37.2 | ||
| Q1 2024 | 4,246 | 960 | 3,257 | 1.32 | 0.37 | 73 | % | 68,352 | 68,169 | $ | 90.6 | $ | 1,329 | $ | 3.7 | $ | 19.3 | ||
| Q4 2023 | 4,666 | 884 | 2,729 | 0.91 | 0.48 | 68 | % | 55,764 | 56,495 | $ | 82.6 | $ | 1,462 | $ | 4.6 | $ | 4.8 | ||
| Bald Mountain | Q4 2024 | 7,622 | – | 7,622 | – | 0.46 | nm | 44,642 | 51,291 | $ | 58.7 | $ | 1,144 | $ | 4.6 | $ | 6.4 | ||
| Q3 2024 | 6,384 | – | 6,384 | – | 0.53 | nm | 43,496 | 44,410 | $ | 58.9 | $ | 1,326 | $ | 5.0 | $ | 6.1 | |||
| Q2 2024 | 2,906 | – | 2,906 | – | 0.47 | nm | 45,929 | 39,818 | $ | 50.6 | $ | 1,271 | $ | 4.4 | $ | 4.6 | |||
| Q1 2024 | 1,480 | – | 1,480 | – | 0.42 | nm | 46,980 | 47,241 | $ | 52.1 | $ | 1,103 | $ | 32.4 | $ | 32.4 | |||
| Q4 2023 | 3,894 | – | 3,918 | – | 0.47 | nm | 44,007 | 49,375 | $ | 57.1 | $ | 1,156 | $ | 36.3 | $ | 38.8 | |||
(a) Due to the nature of heap leach operations, recovery rates at Bald Mountain cannot be accurately measured on a quarterly basis. Recovery rates at Fort Knox and Round Mountain represent mill recovery only.
(b) “nm” means not meaningful.
(c) Gold equivalent ounces include silver ounces produced and sold converted to a gold equivalent based on the ratio of the average spot market prices for the commodities for each period. The ratios for the quarters presented are as follows: Q4 2024: 84.67:1; Q3 2024: 84.06:1; Q2 2024: 81.06:1; Q1 2024: 88.70:1; Q4 2023: 85.00:1.
(d) “Production cost of sales per equivalent ounce sold” is defined as production cost of sales divided by total gold equivalent ounces sold.
(e) “Total Cap Ex” is as reported as “Additions to property, plant and equipment” on the consolidated statements of cash flows. “Cap Ex – sustaining” is a non-GAAP financial measure. The definition and reconciliation of this non-GAAP financial measure is included on pages 30 to 31 of this news release.
(f) La Coipa silver grade and recovery were as follows: Q4 2024: 42.57 g/t, 43%; Q3 2024: 49.13 g/t, 58%; Q2 2024: 65.02 g/t, 51%; Q1 2024: 87.20 g/t, 58%; Q4 2023: 96.24 g/t, 44%.
(g) The Fort Knox segment is composed of Fort Knox and Manh Choh, and comparative results shown are presented in accordance with the current year’s presentation. Manh Choh tonnes of ore processed and grade were as follows: Q4 2024: 138,937 tonnes, 9.58 g/t; Q3 2024: 379,786 tonnes, 9.13 g/t. Tonnes of ore processed and grade were nil for all other periods presented as production commenced in July 2024. The attributable results for Fort Knox include 100% of Fort Knox and 70% of Manh Choh.
APPENDIX A
Figure 1: At Round Mountain Phase X, drilling results for the upper zone continue to show good grades and strong widths.
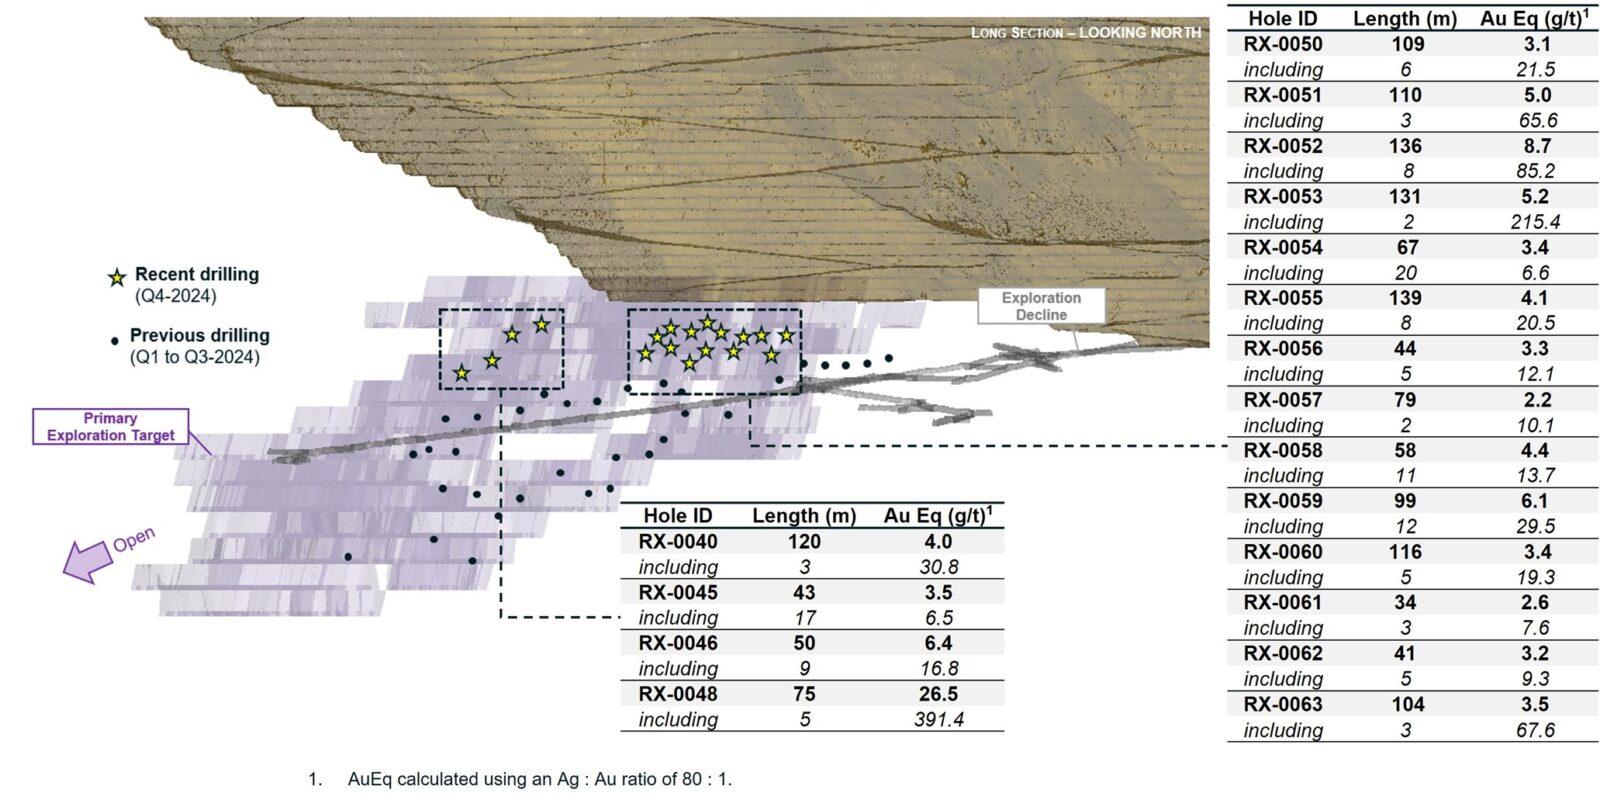
Figure 2: High-grade resource growth at Curlew Basin
Hudbay Minerals Inc. (TSX:HBM) (NYSE: HBM) today released its ann... READ MORE
Strategic acquisition of an established operating gold mine, loca... READ MORE
Cerro de Pasco Resources Inc. (TSX-V: CDPR) (OTCQB: GPPRF) (FRA: ... READ MORE
The Garneau Titanium Project Features Ilmenite-Rich Boulder with ... READ MORE
ValOre Metals Corp. (TSX‐V: VO) (OTCQB: KVLQF) (Frankfurt: KEQ0... READ MORE


