







It has been a heck of a last year for precious metals. A year ago, Gold broke out from its 13-year cup and handle pattern, and days ago, it reached its measured upside target of $3,000/oz. Quality miners and quality junior mining companies have surged higher.
Silver has moved higher alongside Gold but has not outperformed Gold yet. It has gained roughly the same amount as Gold in the past 13 months. However, since the May 2024 peak, Silver is up only 4% while Gold is up nearly 25%.
Part of the issue is that Gold, after clearing $2100/oz, has been able to enjoy blue sky territory (no overhead resistance) while Silver has had to chew through multiple resistance levels between $26 and $35/oz.
Silver’s underperformance relative to Gold in recent quarters seems unusual, but a review of history shows that it’s too soon to expect Silver to outperform Gold.
We plot Silver, Gold, and Silver/Gold in the chart below.
Silver is a leveraged bet on Gold, so we focus on Gold’s price action.
The vertical lines mark the start of strong legs higher in Silver against Gold and Silver in nominal terms.
The blue arrows mark points at which Gold tested its 200-day moving average after a breakout.
There are six notable periods of Silver outperformance. Five of the six periods of outperformance began after a breakout in Gold was followed by a correction to its 200-day moving average.
In 1978 and 2003, Silver’s outperformance began immediately after Gold’s retest of the 200-day moving average. In the other three cases (1973, 2010, and 2020), Silver’s outperformance began four months, two months, and two months after the first test of the 200-day moving average.
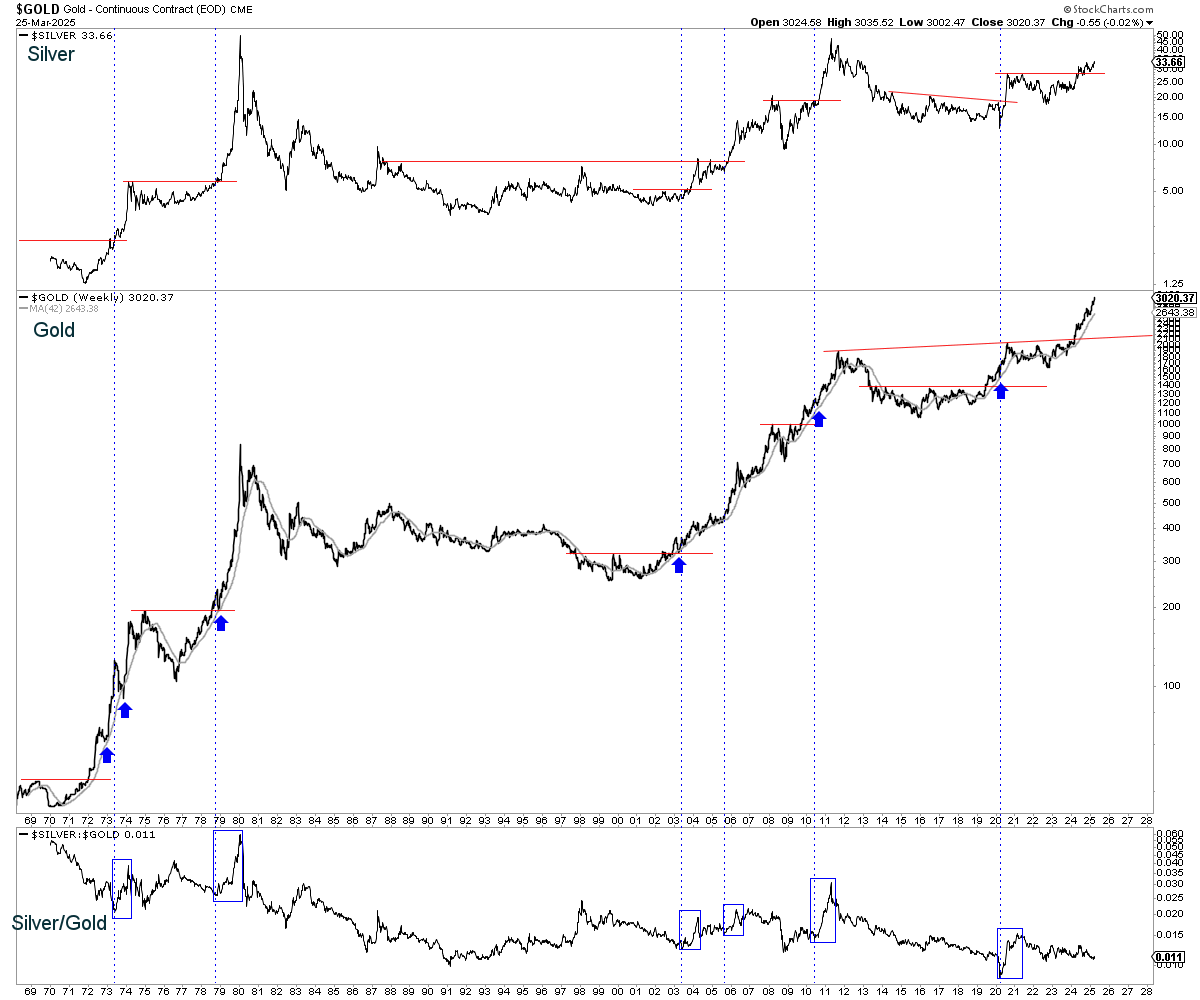
The start of each period of outperformance coincided with a major breakout in the Silver price.
Silver did outperform after it broke $28/oz in 2024, but only briefly.
History ultimately argues that Silver would be in a position to outperform Gold after the next sector correction, which entails Gold testing its 200-day moving average.
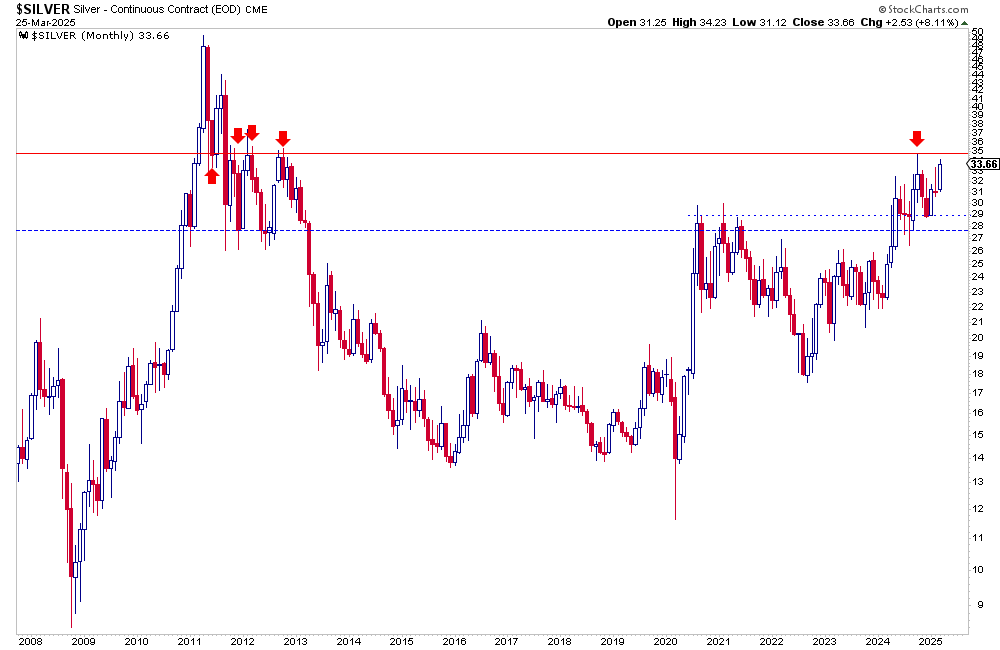
As for Silver in nominal terms, the significance of $50/oz is obvious.
In the meantime, mind the action around $35/oz, the stiffest resistance on the way to $50/oz. A monthly close above $35.52 would mark a 14-year high and exceed the monthly high from 1980.
A quarterly close above $32 would mark the 3rd highest quarterly close in history. The quarter ends on Monday.
Because Silver’s outperformance has not begun, investors have an opportunity.
We are already positioned in the leading junior silver companies but are actively prospecting for those companies that could be leaders in 2026.
Santacruz Silver Mining Ltd. (NASDAQ: SCZM) (TSX: SCZ) announces that total production in the third ... READ MORE
GreenLight Metals Inc. (TSX-V: GRL) (OTCQB: GRLMF) is pleased to announce assay results from ... READ MORE
White Gold Corp. (TSX-V: WGO) (OTCQX: WHGOF) (FSE: 29W) is pleased to announce that further to its p... READ MORE
Canagold Resources Ltd. (TSX: CCM) (OTCQB: CRCUF) (FSE: CANA) announces assay results from three add... READ MORE
Liberty Gold Corp. (TSX: LGD) (OTCQX: LGDTF) is pleased to report initial drill assays results, comp... READ MORE


