


Integra Resources Corp. (TSX-V: ITR; NYSE American: ITRG) is pleased to announce results for the maiden Preliminary Economic Assessment and updated resource estimate for each of the Wildcat Project and Mountain View Project located in western Nevada. The PEA demonstrates the potential for a low-cost, high-margin, heap leach gold-silver operation with a phased development and production strategy and robust economics. The average annual production of Wildcat & Mountain View and the DeLamar Project on a combined basis is expected to exceed 200kozs of gold equivalent, demonstrating one of the largest heap leach production profiles among precious metal developers in the Great Basin.
Wildcat & Mountain View PEA Highlights:
(1) CAD:USD FX rate of 1.32
(2) See NI 43-101 technical report titled: “Technical Report and Preliminary Feasibility Study for the DeLamar and Florida Mountain Gold – Silver project, Owyhee County, Idaho, USA”, dated March 22, 2022 with an effective date of January 24, 2022 available under Integra Resources’ SEDAR profile at www.sedar.com and EDGAR profile at www.sec.gov; Gold price assumption: US$1,700/oz Au; Silver price assumption is US$21.50/oz Ag
Integra’s President, CEO & Director, Jason Kosec commented: “the updated resource estimate and PEA for Wildcat & Mountain View demonstrate two high-margin, low-cost, heap leachable gold and silver deposits with a strong combined production profile, low pre-production capex and robust economics. The PEA strengthens Integra’s position in the Great Basin as a multi-asset developer with a pathway to become a 200,000 ounce per year gold-silver producer. To date, the Company has successfully defined a large resource base at Wildcat & Mountain View despite being constrained to 5-acres of surface disturbance. The Company has submitted an Exploration Plan of Operations for both Wildcat & Mountain View to the Bureau of Land Management which, when received, will allow for significantly increased resource expansion drilling through planned step-out drill holes. Resource growth at Wildcat & Mountain View has the potential to further enhance the economics and mine life demonstrated in the PEA results announced today.”
George Salamis, Executive Chairman of Integra, added: “the PEA is the first major milestone following the successful merger of Integra and Millennial Precious Metals. The next major catalysts for the Company includes an updated resource estimate for the DeLamar Project that will incorporate gold-silver mineralized stockpile material drilled during the 2022-2023 winter field season, as well as the filing of the DeLamar Mine Plan of Operations in Q4 of this year. The Mine Plan of Operations represents a major milestone for the project and a significant step towards permitting and de-risking the DeLamar Project.”
The PEA is preliminary in nature and includes inferred mineral resources that are too speculative geologically to have economic considerations applied to them that would enable them to be categorized as mineral reserves. There is no certainty that PEA results will be realized. Mineral resources are not mineral reserves and do not have demonstrated economic viability.
Project Economics – Sensitivity to Gold and Silver Prices
Table 1 illustrates a range of metal price scenarios to evaluate the after-tax economics of Wildcat & Mountain View. As shown, Wildcat & Mountain View operations remain viable in the downside commodity price scenario and also show robust economics in the upside case.
Table 1: After-Tax NPV, IRR and Payback Sensitivity Table (US$M)
| $/oz Au | $/oz Ag | NPV (5%) | NPV (7.5%) | NPV (10%) | IRR | Payback |
| $1,450 | $18.34 | $155.0 | $114.4 | $82.4 | 21.2% | 3.7 |
| $1,500 | $18.97 | $186.0 | $141.4 | $106.3 | 24.4% | 3.5 |
| $1,550 | $19.60 | $216.9 | $168.4 | $130.0 | 27.6% | 3.3 |
| $1,600 | $20.24 | $247.6 | $195.2 | $153.6 | 30.7% | 3.2 |
| $1,650 | $20.87 | $278.4 | $222.0 | $177.3 | 33.7% | 3.1 |
| $1,700 | $21.50 | $309.6 | $249.3 | $201.2 | 36.9% | 3.0 |
| $1,750 | $22.13 | $340.5 | $276.3 | $225.0 | 39.9% | 2.8 |
| $1,800 | $22.76 | $371.4 | $303.2 | $248.7 | 42.9% | 2.6 |
| $1,850 | $23.40 | $401.9 | $329.8 | $272.2 | 45.9% | 2.5 |
| $1,900 | $24.03 | $432.5 | $356.4 | $295.6 | 48.8% | 2.4 |
| $1,950 | $24.66 | $463.1 | $383.1 | $319.1 | 51.7% | 2.3 |
Production and Cash Flow Profile
The PEA outlines a profitable heap leach operation with a phased development approach that sees production beginning at Wildcat and expanding to Mountain View in year 8. A phased development approach allows the Company to utilize one fleet for mining and processing equipment resulting in significantly reduced total capital requirements. In total, the approximately 30,000 tonnes per day heap leach operation at Wildcat and 16,000 tpd heap leach operation at Mountain View is expected to process 99.5 million tonnes of mineralized material and produce 1,043koz AuEq (1,018koz Au and 1,933koz Ag) over the 13-year LOM.
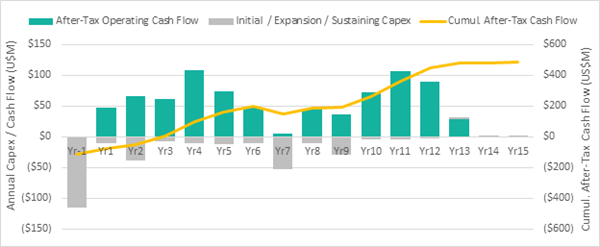
The average annual LOM production at Wildcat & Mountain View is expected to be 80koz AuEq per year which, assuming base case metal prices of US$1,700/oz Au and US$21.50/oz Ag will generate total net free cash flow LOM of US$485M and average annual free cash flow of US$46M from year 1-13.
Figure 1: Wildcat & Mountain View Production Profile
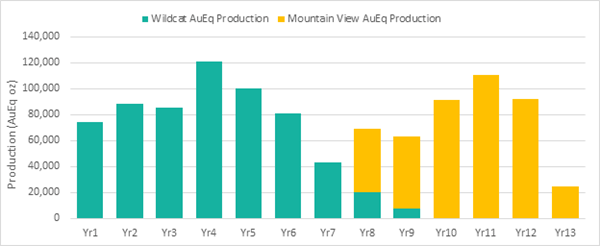
Figure 2: Wildcat & Mountain View Cash Flow Profile
Technical Inputs and Assumptions
Each of Wildcat & Mountain View will have its own heap leach pad and waste rock facility. The mining equipment and fleet will be moved between the two projects to provide efficient operations and value optimization. Wildcat & Mountain View will share an Adsorption/Desorption/Recovery plant located first at Wildcat and then moved to Mountain View in year 8, at which point the loaded carbon from production years 8 and 9 at Wildcat will be trucked to Mountain View for processing. Mining will be done using 90 tonne (“t”) haul trucks and 200t and 250t shovels. Material will be crushed to 9 millimeters (“mm”) at Wildcat and 19mm at Mountain View using a three-stage crushing circuit. No agglomeration is expected to be required at either project.
Table 2: Standalone Project Inputs
| Mining | Wildcat | Mountain View |
| Total Tonnage Mined (kt) | 89,909 | 130,279 |
| Total Mineralized Material (kt) | 69,974 | 29,548 |
| Strip Ratio (Waste: Mineralized) | 0.28 | 3.41 |
| Contained | ||
| Contained Gold (koz Au) | 823.1 | 521.8 |
| Contained Silver (koz Ag) | 7,065.8 | 3,037.2 |
| Contained Gold Equivalent (koz AuEq) | 912.4 | 560.2 |
| Processing & Grade | ||
| Processing Throughput (ktpd) | 30.0 | 16.0 |
| Average Gold Grade (g/t Au) | 0.38 | 0.57 |
| Average Silver Grade (g/t Ag) | 3.25 | 3.30 |
| Production | ||
| Heap Leach Recovery | ||
| LOM Average Gold Recovery (%) | 71.4% | 77.1% |
| LOM Average Silver Recovery (%) | 18.0% | 20.0% |
| Payable Metals | ||
| LOM Gold Payable (koz Au) | 604.2 | 414.0 |
| LOM Silver Payable (koz Ag) | 1,308.1 | 624.8 |
| LOM Gold Equivalent Payable (koz AuEq) | 620.8 | 421.9 |
Table 3: Technical Inputs and Financial Assumptions for Combined Operation
| Mining | Wildcat & Mountain View |
| Total Tonnage Mined (kt) | 220,187 |
| Total Mineralized Material (kt) | 99,522 |
| Strip Ratio (Waste: Mineralized) | 1.21 |
| Mine Life | 13.0 |
| Contained | |
| Contained Gold (koz Au) | 1,344.9 |
| Contained Silver (koz Ag) | 10,103.0 |
| Contained Gold Equivalent (koz AuEq) | 1,472.7 |
| Production | |
| Heap Leach Recovery | |
| LOM Average Gold Recovery (%) | 73.7% |
| LOM Average Silver Recovery (%) | 18.6% |
| Payable Metals | |
| LOM Gold Payable (koz Au) | 1,018.2 |
| LOM Silver Payable (koz Ag) | 1,932.8 |
| LOM Gold Equivalent Payable (koz AuEq) | 1,042.6 |
| Average Annual Gold Payable (koz Au) | 78.3 |
| Average Annual Silver Payable (koz Ag) | 148.7 |
| Average Annual Gold Equivalent Payable (koz AuEq) | 80.2 |
| Costs per Tonne | Wildcat & Mountain View |
| Mining Costs (US$/t mined) | $1.82 |
| Mining Costs (US$/t processed) | $4.02 |
| Processing Costs (US$/t processed) | $3.59 |
| G&A Costs (US$/t processed) | $0.58 |
| Total Site Operating Cost (US$/t processed) | $8.19 |
| Cash Costs | |
| LOM Cash Cost, net-of-silver by-product ($/oz Au) | $862 |
| LOM Cash Cost, co-product ($/oz AuEq) | $882 |
| LOM AISC, net-of-silver by-product ($/oz Au) | $956 |
| LOM AISC, co-product ($/oz AuEq) | $973 |
| LOM AIC, net-of-silver by-product ($/oz Au) | $1,162 |
| LOM AIC, co-product ($/oz AuEq) | $1,175 |
| Capital Expenditure | |
| Wildcat Initial Capex (US$M) (1) | $115.1 |
| Mountain View Initial Capex (US$M) | $49.2 |
| Expansion Capex (US$M) (2) | $49.2 |
| Sustaining Capex / Equipment Financing (US$M) | $84.4 |
| Reclamation Cost (US$M) | $21.7 |
| Salvage Value (US$M) | ($12.1) |
| Bonding Cash Collateral Return (US$M) | ($2.2) |
| Total Capital (US$M) | $305.3 |
| Economic Assumptions | |
| Gold Price (US$/oz) | $1,700 |
| Silver Price (US$/oz) | $21.50 |
| FX Rate (CAD/USD) | 1.3 |
| Project Economics | |
| After-Tax IRR (%) | 36.9% |
| After-Tax NPV5% (US$M) | $309.6 |
| After-Tax NPV5% (C$M) | $408.6 |
| Payback Period (years) | 3.0 |
| Yr1-13 Average Annual Net Free Cash Flow (US$M) | $45.9 |
| Yr1-13 Total Net Free Cash Flow (US$M) | $596.7 |
| LOM Total Net Free Cash Flow (US$M) | $485.1 |
(1) Includes initial working capital and reclamation bonding
(2) Includes Wildcat and Mountain View heap leach expansion capex
Capital & Operating Costs
The total site costs including mining, processing and G&A for Wildcat & Mountain View are US$8.19/t processed over the LOM. The LOM site level cash costs net-of-silver by-product for Wildcat & Mountain View are US$862/oz Au and US$882/oz AuEq on a co-product basis. The site level AISC, which includes heap leach expansion capital for Wildcat in year 2 and Mountain View in year 9, is US$956/oz Au on a by-product basis and US$973/oz AuEq on a co-product basis. The all-in cost for Wildcat & Mountain View is US$1,162/oz Au on a by-product basis and US$1,175/oz AuEq on a co-product basis and includes Wildcat & Mountain View initial capital expenditure, heap leach expansion capital, sustaining capital, reclamation and closure costs.
Table 4: Operating Cost, AISC and AIC Breakdown
| Per Tonne | ||
| LOM Operating Costs (US$) | Mined | Processed |
| Mining | $1.82 | $4.02 |
| Processing | $3.59 | |
| G&A | $0.58 | |
| Total Site Costs | $8.19 | |
| US$/oz Au | US$/oz AuEq | |
| LOM Cash Costs, AISC & AIC Breakdown | By-Product | Co-Product |
| Mining | $393 | $384 |
| Processing | $351 | $343 |
| G&A | $56 | $55 |
| Total Site Costs | $801 | $782 |
| Transport & Refining | $6 | $6 |
| Royalties & Production Taxes (1) | $97 | $94 |
| Total Cash Costs | $903 | $882 |
| Silver By-Product Credits | ($41) | – |
| Total Cash Costs Net of Silver by-Product | $862 | $882 |
| Expansion Capital (2) | $48 | $47 |
| Sustaining Capital | $35 | $35 |
| Closure Costs Net of Residual Value | $10 | $9 |
| Site Level All-in Sustaining Costs | $956 | $973 |
| Non-Sustaining Capital (3) | $207 | $202 |
| Site Level All-in Costs | $1,162 | $1,175 |
(1) Includes private royalties and state-level cash taxes
(2) Expansion capital includes heap leach expansion at Wildcat in year 2 and Mountain View in year 9
(3) Non-Sustaining Capital includes initial capital at Wildcat and Mountain View and equipment leases
Note: Costs may not reconcile exactly due to rounding
The total pre-production capex for Wildcat is estimated at US$115M. A phased development approach results in expansion capital of US$31M in year 2 at Wildcat to expand the heap leach pad. In year 7, initial capital for Mountain View of US$49M is required for the heap leach pad and processing facility. Expansion capital of US$18M to increase the heap leach capacity at Mountain View is required in year 9. Other capital required throughout the LOM of US$92M includes financed mining equipment, sustaining capital, reclamation (net of residual value) and bonding.
Table 5: Wildcat & Mountain View Project Capital Cost Breakdown
| Capital Cost Breakdown (US$M) | Wildcat | Mountain View | Combined |
| Wildcat Initial Capital (Y-1) | |||
| Heap Leach Pad | $26.7 | $0.0 | $26.7 |
| Processing | $65.5 | $0.0 | $65.5 |
| Initial Cash Bonding | $2.2 | $0.0 | $2.2 |
| Contingency | $20.6 | $0.0 | $20.6 |
| Total Wildcat Initial Capital | $115.1 | $0.0 | $115.1 |
| Mountain View Initial Capital (Y7) | |||
| Heap Leach Pad | $0.0 | $12.5 | $12.5 |
| Processing | $0.0 | $27.0 | $27.0 |
| Contingency | $0.0 | $9.7 | $9.7 |
| Total Mountain View Initial Capital | $0.0 | $49.2 | $49.2 |
| Expansion Capital (Y2-13) | |||
| Heap Leach Pad | $24.6 | $14.8 | $39.4 |
| Contingency | $6.4 | $3.4 | $9.8 |
| Total Expansion Capital | $31.0 | $18.2 | $49.2 |
| Other Capital (Y1-13) | |||
| Mining Equipment | $34.7 | $13.8 | $48.4 |
| Sustaining Capital | $21.0 | $15.0 | $36.0 |
| Reclamation | $11.1 | $10.7 | $21.7 |
| Bonding Cash Collateral Return | ($2.2) | $0.0 | ($2.2) |
| Residual Value | $0.0 | $0.0 | ($12.1) |
| Total Other Capital | $64.5 | $39.4 | $91.9 |
| TOTAL CAPITAL | $210.6 | $106.8 | $305.3 |
Note: Figures in the table include a ~25% contingency on processing facilities and heap leach pads (excluding working capital)
Additional Information
Mining
As contemplated in the PEA study, approximately 200 mining, processing, maintenance, and general administrative workers are expected to be employed directly by Wildcat & Mountain View in peak years. In addition, Wildcat & Mountain View will contribute to the state and federal governments through taxation.
The PEA utilizes a phased development and mining approach with open pit mining beginning at Wildcat and moving to Mountain View in year 8. The Wildcat Project will produce over a 7-year period at a rate of approximately 30,000 tpd. Starting in year 5, pre-stripping as well as a mineralized material stockpiling program will commence at Mountain View. In year 7 and 8, all fixed and mobile infrastructure will move from Wildcat to Mountain View. In year 8, the majority of fixed and mobile equipment will be allocated for mining at Mountain View in conjunction with heap leaching only at Wildcat. Mountain View will process an average of 16,000 tpd over a 6-year period, followed by one year of remnant heap leaching.
The average waste to mineralization strip ratio at Wildcat is 0.28 and is 3.41 at Mountain View. The LOM strip ratio for Wildcat & Mountain View is 1.21 with approximately 220Mt of total material moved. At Mountain View, most of the waste material is quaternary alluvium that does not require drilling or blasting. The alluviums can be moved with surface equipment and represent approximately 72Mt of the 101Mt of waste material at Mountain View. A cut-off grade of 0.15 g/t Au will be used at Wildcat & Mountain View.
Integra contemplates conducting open pit mining at Wildcat & Mountain View using an owner-operated, conventional mine fleet that includes production drill rigs for mineralization definition and blasting. The operation will share mining equipment and a fleet that includes ~28 to ~33 cubic meter hydraulic shovels (200t and 250t shovels) and ~12 cubic meter front end loaders with 90t haul trucks. The Company intends to optimize equipment use by moving equipment, after a rebuild program, from Wildcat to Mountain View as production declines at Wildcat and ramps up at Mountain View in years 7 and 8.
Heap Leach Metallurgy
The PEA includes conventional heap leaching for the processing and recovery of gold and silver. A heap leach pad will be located at both Wildcat and Mountain View with a shared ADR plant located first at Wildcat and then moved to Mountain View. Mineralized material will be crushed to 9mm at Wildcat and 19mm at Mountain View using three stage crushing and will be placed on the pad using traditional conveyor and grasshopper stacking systems. At both projects, gold and silver will be leached using a low concentration sodium cyanide solution and recovered using an ADR plant to produce doré on site.
At Wildcat, 70Mt of mineralized material will be placed on the heap leach pad. The average gold and silver recoveries are 71.4% Au and 18.0% Ag resulting in total payable sales of 604koz Au and 1.3Moz Ag. At Mountain View, 30Mt of mineralized material will be placed on the heap leach pad. The average gold and silver recoveries are 77.1% Au and 20.0% Ag, resulting in total payable ounces of 414koz Au and 625koz Ag.
Wildcat & Mountain View Project Resource Estimates
The following table highlights the updated resource estimates for Wildcat & Mountain View that were used in the PEA study. The updated resource estimates were completed by William Lewis of Micon International Limited.
Table 6: Wildcat & Mountain View Mineral Resources
| Wildcat | ||||||||
| Tonnes | g/t Au | oz Au | g/t Ag | oz Ag | g/t AuEq | oz AuEq | ||
| Oxide | Indicated | 59,872,806 | 0.39 | 746,297 | 3.34 | 6,437,869 | 0.43 | 829,152 |
| Inferred | 22,455,848 | 0.29 | 209,662 | 2.74 | 1,980,129 | 0.33 | 235,146 | |
| Mountain View | ||||||||
| Tonnes | g/t Au | oz Au | g/t Ag | oz Ag | g/t AuEq | oz AuEq | ||
| Oxide | Indicated | 22,007,778 | 0.57 | 401,398 | 2.46 | 1,738,448 | 0.60 | 423,772 |
| Inferred | 3,579,490 | 0.44 | 50,716 | 1.43 | 165,049 | 0.46 | 52,840 | |
| Transition | Indicated | 2,804,723 | 0.66 | 59,676 | 6.56 | 591,868 | 0.75 | 67,293 |
| Inferred | 215,815 | 0.40 | 2,750 | 3.77 | 26,184 | 0.44 | 3,087 | |
| Non-Oxide | Indicated | 3,938,017 | 0.92 | 116,970 | 8.46 | 1,071,521 | 1.03 | 130,760 |
| Inferred | 360,198 | 0.58 | 6,679 | 4.57 | 52,955 | 0.64 | 7,361 | |
| Total | Indicated | 28,750,517 | 0.63 | 578,044 | 3.68 | 3,401,836 | 0.67 | 621,826 |
| Inferred | 4,155,502 | 0.45 | 60,145 | 1.83 | 244,188 | 0.47 | 63,288 | |
Mineral Resource
As part of the PEA, Integra completed an updated resource estimate for Wildcat & Mountain View. This resource update incorporates drilling from the 2021-2022 drill programs and is based on a new geological interpretation for both the lithological and oxidation models. In addition to new drilling, which included twinning of historical drill holes, the relogging and re-assaying of the available historical data provided enough information to upgrade most of the resources into the Indicated category. Classification of the resources was interpreted manually considering various information such as geology, grade and recovery continuity as well as interpolation parameters and drilling spacing. The Company utilized a general guideline of 50m by 50m spacing for the Indicated resource and 100m by 100m for the Inferred resource. The resources were then constrained using Lerchs-Grossmann pit optimization to respect the definition of reasonable prospects for economic extraction. The updated resource estimate saw an increase in total in-pit AuEq ounces driven primarily by the drilling that took place in 2021-2022 which allowed for the re-interpretation of the oxidation profile at Wildcat and a better constraint of the high-grade breccia body at Mountain View, new geotechnical parameters and metallurgical recoveries, and a higher Au price assumption. As a result of this geological and modeling work, approximately 80% of the resources for Wildcat & Mountain View are now classified as Indicated.
The Company utilized the resource estimate block model described above as a basis for the PEA study, however, additional ‘modifying factors’ were considered for the PEA. These factors included Au prices and pit designs, among others. The modifying factors in the PEA led to a substantial difference between the mineral resource estimate and the PEA production plan.
Wildcat & Mountain View: Future Opportunities and Value Enhancements
Through the course of conducting exploration and various studies related to the PEA work, the Company has identified several prospective measures to grow the mineral resource estimate at Wildcat & Mountain View and enhance future economics:
In November 2022, a surface sampling and mapping program identified several new mineralized targets outside the proposed PEA pit area at Wildcat. This increased the mineralized footprint from ~1.5 kilometres (“km”) by 1.5 km to ~3.0 km by 2.0 km and identified multiple high-priority drill ready targets that have the potential to increase the resource at Wildcat.
Next Steps
Based on the positive results of the PEA, Integra will continue to de-risk Wildcat & Mountain View through baseline and technical studies in the areas of hydrology, geotechnical and metallurgy. Once the EPO is received, the Company is expected to undertake an exploration drill program to grow the resource at the Wildcat & Mountain View which could increase the mine life and further enhance the robust economics outlined in the PEA.
The PEA was prepared by Micon International Limited of Toronto, Canada and included contributions from Forte Dynamics, NewFields and Convergent Mining. The PEA is preliminary in nature and includes inferred mineral resources that are too speculative geologically to have economic considerations applied to them that would enable them to be categorized as mineral reserves. There is no certainty that PEA results will be realized. Mineral resources are not mineral reserves and do not have demonstrated economic viability.
Qualified Persons
The scientific and technical information contained in this news release has been reviewed and approved by Raphael Dutaut, Ph.D (P.Geo), Integra’s Vice President, Exploration and Tim Arnold (PE, SME), Integra’s Chief Operating Officer. Both individuals are “Qualified Persons” as defined in NI 43- 101 – Standards of Disclosure for Mineral Projects.
The scientific and technical information contained in this news release has also been verified and approved by the following “Qualified Persons” within the meaning of NI 43-101 – Standards of Disclosure for Mineral Projects: Richard Gowans, P.Eng, Micon International Limited (metallurgy and mineral processing, environmental, permitting and social considerations), Andrew Hanson, P.E., NewFields Project & Construction Management (heap leach infrastructure), Chris Jacobs, CEng, MIMMM, Micon International Limited (economic analysis), William Lewis, P.Geo, Micon International Limited (mineral resource estimation), Deepak Malhotra, Director of Metallurgy, Forte Dynamics (infrastructure), and Ralston Pedersen, P.E., Convergent Mining, LLC (mining).
About Integra Resources
Integra is one of the largest precious metals exploration and development companies in the Great Basin of the Western USA. Integra is currently focused on advancing its three-flagship oxide heap leach projects: the past producing DeLamar Project located in southwestern Idaho and the Wildcat Project and Mountain View Project located in western Nevada. The Company also holds a portfolio of highly prospective early-stage exploration projects in Idaho, Nevada, and Arizona. Integra’s long-term vision is to become a leading USA-focused mid-tier gold and silver producer.
Hudbay Minerals Inc. (TSX:HBM) (NYSE: HBM) today released its ann... READ MORE
Strategic acquisition of an established operating gold mine, loca... READ MORE
Cerro de Pasco Resources Inc. (TSX-V: CDPR) (OTCQB: GPPRF) (FRA: ... READ MORE
The Garneau Titanium Project Features Ilmenite-Rich Boulder with ... READ MORE
ValOre Metals Corp. (TSX‐V: VO) (OTCQB: KVLQF) (Frankfurt: KEQ0... READ MORE


