








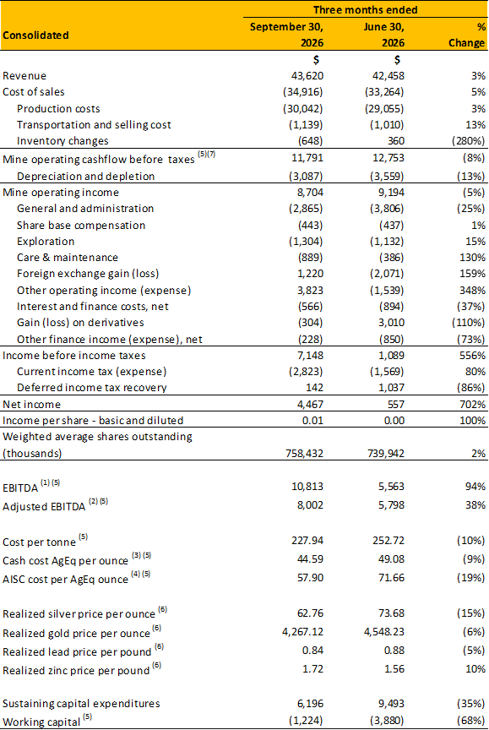
Revenue, Production and Net Income were all higher than Q2.
Guanajuato Silver Company Ltd. (TSX-V:GSVR) (OTCQX:GSVRF) is pleased to announce financial information and production results for the three and nine months ended September 30, 2026. The Company’s condensed consolidated interim financial statements for the three and nine months ended September 30, 2026 and Management’s Discussion and Analysis thereon can be viewed under the Company’s profile at www.sedarplus.ca. All dollar amounts are in US dollars and prepared in accordance with IFRS Accounting Standards (IFRS) as issued by the International Accounting Standards Board.. Production results are from the Company’s wholly owned Bolanitos Mine, El Cubo Mines Complex, San Ignacio Mine and Valenciana Mines Complex, located in Guanajuato, Mexico, and the Topia Mine located in Durango, Mexico.
Selected Q3 2026 Highlights
James Anderson, CEO & Chairman, said, “Substantive capital investments made in the first half of this year have begun to deliver improved operational and economic performance; during the quarter precious metals production increased, which helped to drive down both operating costs and AISC. We expect both of these trends to continue in the ensuing quarters.”
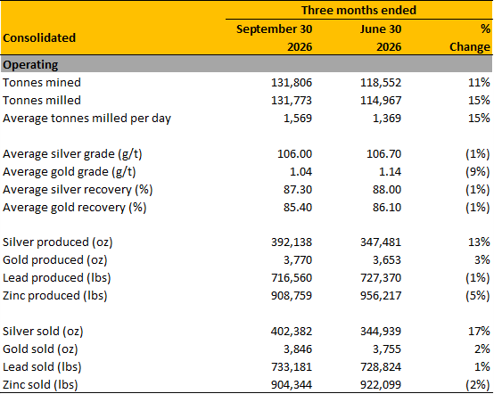
Production for the quarter totaled 392,138 ounces of silver, 3,770 ounces of gold, 716,560 pounds of lead and 908,759 pounds of zinc. All base metal production for Guanajuato Silver occurs at the Topia Mine.
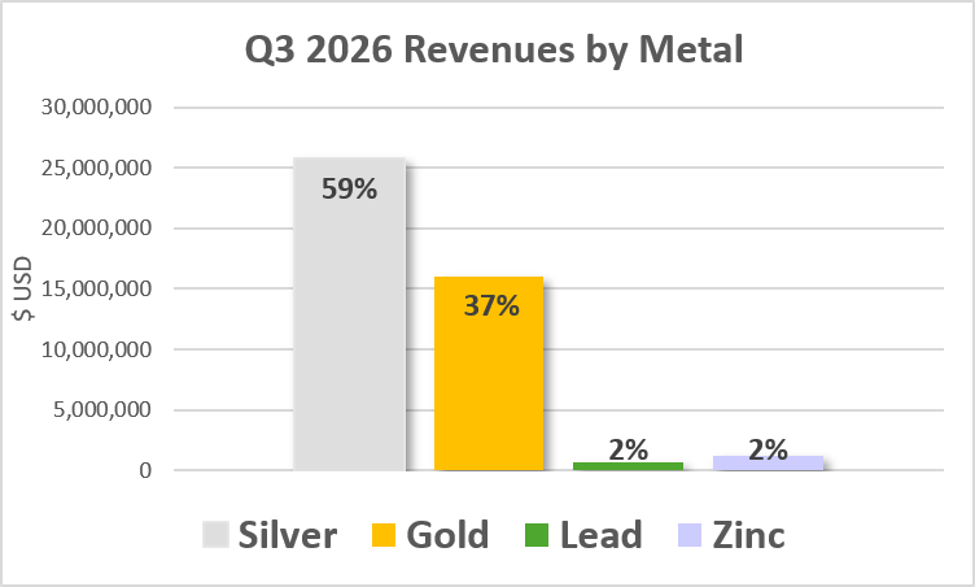
*EBITDA and Adjusted EBITDA are a non-IFRS financial measures with no standardized meaning under IFRS, and therefore may not be comparable to similar measures presented by other issuers. For further information and detailed reconciliations of non-IFRS financial measures to the most directly comparable IFRS measures see “Non-IFRS Financial Measures”.
**AgEq in this news release is calculated using 68.08:1 (Ag/Au), 0.01:1 (Ag/Pb) and 0.03:1 (Ag/Zn) ratio for Q3 2026, a 61.48:1 (Ag/Au), 0.01:1 (Ag/Pb) and 0.02:1 (Ag/Zn) ratio for Q2 2026; and a 87.88:1 (Ag/Au), 0.02:1 (Ag/Pb) and 0.03:1 (Ag/Zn) ratio for Q3 2025, respectively. Silver equivalents produced are based on all metals produced on a gross payable basis at average realized silver, gold, lead and zinc prices during each respective period, except as otherwise noted.
Q3 2026 OPERATING AND FINANCIAL HIGHLIGHTS
The following tables summarize the Company’s consolidated operating and financial results for the three months ended September 30, 2026, as compared to the three months ended June 30, 2026. All amounts are expressed in thousands of US$ except per share amounts, realized prices, tonnes and ounces or unless otherwise stated.
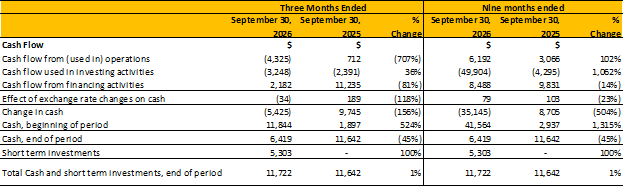
The table below presents a summary of the Company’s consolidated cash flow for the three-month and the nine-month periods ended September 30, 2026, and 2025.
NON-IFRS FINANCIAL MEASURES
The Company has disclosed certain non-IFRS financial measures and ratios in this news release, as discussed below. These non-IFRS financial measures and non-IFRS ratios are widely reported in the mining industry as benchmarks for performance and are used by Management to monitor and evaluate the Company’s operating performance and ability to generate cash. The Company believes that, in addition to financial measures and ratios prepared in accordance with IFRS, certain investors use these non-IFRS financial measures and ratios to evaluate the Company’s performance. However, the measures do not have a standardized meaning under IFRS and may not be comparable to similar financial measures disclosed by other companies. Accordingly, non-IFRS financial measures and non-IFRS ratios should not be considered in isolation or as a substitute for measures and ratios of the Company’s performance prepared in accordance with IFRS.
Non-IFRS financial measures are defined in National Instrument 52-112 – Non-GAAP and Other Financial Measures Disclosure (“NI 52-112”) as a financial measure disclosed that (a) depicts the historical or expected future financial performance, financial position or cash flow of an entity, (b) with respect to its composition, excludes an amount that is included in, or includes an amount that is excluded from, the composition of the most directly comparable financial measure disclosed in the primary financial statements of the entity, (c) is not disclosed in the financial statements of the entity, and (d) is not a ratio, fraction, percentage or similar representation.
A non-IFRS ratio is defined by NI 52-112 as a financial measure disclosed that (a) is in the form of a ratio, fraction, percentage, or similar representation, (b) has a non-IFRS financial measure as one or more of its components, and (c) is not disclosed in the financial statements.
WORKING CAPITAL
Working capital is a non-IFRS measure that is a common measure of liquidity but does not have any standardized meaning. The most directly comparable measure prepared in accordance with IFRS is current assets net of current liabilities. Working capital is calculated by deducting current liabilities from current assets. Working capital should not be considered in isolation or as a substitute for measures prepared in accordance with IFRS. The measure is intended to assist readers in evaluating the Company’s liquidity.

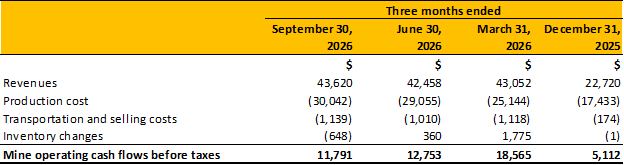
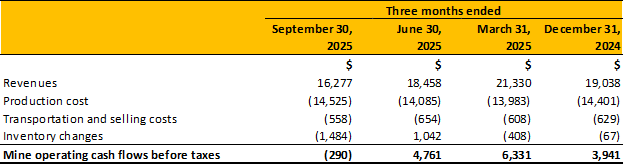
MINE OPERATING CASH FLOW BEFORE TAXES
Mine operating cash flow before taxes is a non-IFRS measure that does not have a standardized meaning prescribed by IFRS and therefore may not be comparable to similar measures presented by other issuers. Mine operating cash flow is calculated as revenue minus production costs, transportation and selling costs and inventory changes. Mine operating cash flow is used by management to assess the performance of the mine operations, excluding corporate and exploration activities, and is provided to investors as a measure of the Company’s operating performance.
EBITDA
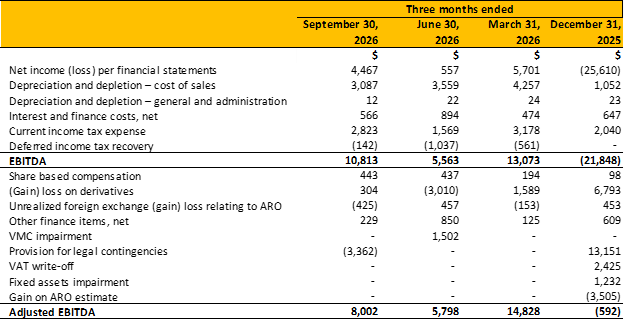
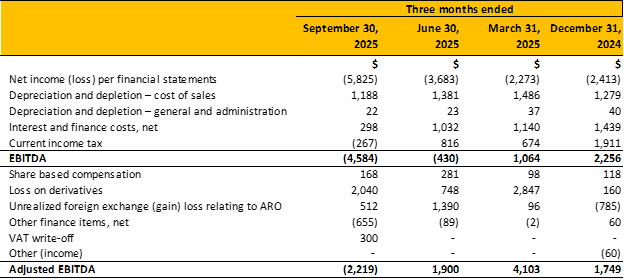
EBITDA is a non-IFRS financial measure, which excludes the following from net earnings:
Adjusted EBITDA excludes the following additional items from EBITDA:
Adjusted EBITDA per share is calculated by dividing Adjusted EBITDA by the basic weighted average number of shares outstanding for the period.
Management believes EBITDA is a valuable indicator of the Company’s ability to generate liquidity by producing operating cash flow to fund working capital needs, service debt obligations, and fund capital expenditures. Management uses EBITDA for this purpose. EBITDA is also frequently used by investors and analysts for valuation purposes whereby EBITDA is multiplied by a factor or “EBITDA multiple” based on an observed or inferred relationship between EBITDA and market values to determine the approximate total enterprise value of a Company. Management believes that Adjusted EBITDA provides useful information to investors and others in understanding and evaluating our operating results because it is consistent with the indicators management uses internally to measure the Company’s performance and is an indicator of the performance of the Company’s mining operations.
EBITDA is intended to provide additional information to investors and analysts. It does not have any standardized definition under IFRS and should not be considered in isolation or as a substitute for measures of operating performance prepared in accordance with IFRS. EBITDA excludes the impact of cash costs of financing activities and taxes, and the effects of changes in operating working capital balances and therefore is not necessarily indicative of operating profit or cash flow from operations as determined by IFRS. Other companies may calculate EBITDA and Adjusted EBITDA differently.
Cash Cost per AgEq Ounce, All-In Sustaining Cost per AgEq Ounce and Production Cost per Tonne
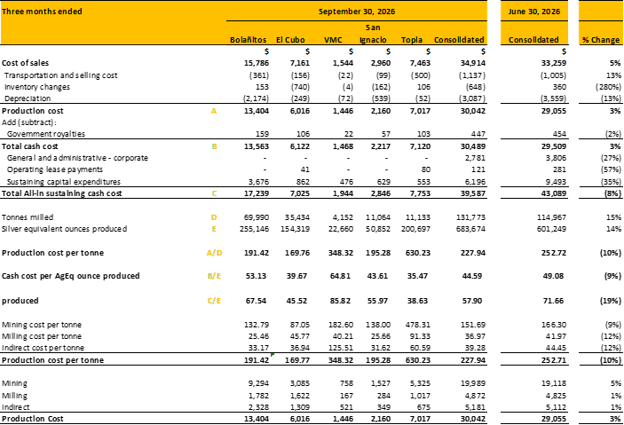
Cash costs per silver equivalent ounce and production costs per tonne are measures developed by precious metals companies in an effort to provide a comparable standard; however, there can be no assurance that the Company’s reporting of these non-IFRS measures and ratios are similar to those reported by other mining companies. Cash costs per silver equivalent ounce and total production cost per tonne are non-IFRS performance measures used by the Company to manage and evaluate operating performance at its operating mining unit, in conjunction with the related IFRS amounts. They are widely reported in the silver mining industry as a benchmark for performance, but do not have a standardized meaning and are disclosed in addition to IFRS measures. Production costs include mining, milling, and direct overhead at the operation sites. Cash costs include all direct costs plus royalties. Total production costs include all cash costs plus amortization and depletion, changes in amortization and depletion in finished goods inventory and site share-based compensation. Cash costs per silver equivalent ounce is calculated by dividing cash costs and total production costs by the payable silver ounces produced. Production costs per tonne are calculated by dividing production costs by the number of processed tonnes. The following tables provide a detailed reconciliation of these measures to the Company’s direct production costs, as reported in its consolidated financial statements.
AISC is a non-IFRS performance measure and was calculated based on guidance provided by the World Gold Council. WGC is not a regulatory industry organization and does not have the authority to develop accounting standards for disclosure requirements. Other mining companies may calculate AISC differently as a result of differences in underlying accounting principles and policies applied, as well as differences in definitions of sustaining capital expenditures. AISC is a more comprehensive measure than cash cost per ounce and is useful for investors and management to assess the Company’s operating performance by providing greater visibility, comparability and representation of the total costs associated with producing silver from its current operations, in conjunction with related IFRS amounts. AISC helps investors to assess costs against peers in the industry and help management assess the performance of its mine.
AISC includes total production costs (IFRS measure) incurred at the Company’s mining operation, which forms the basis of the Company’s total cash costs. Additionally, the Company includes sustaining capital expenditures, corporate general and administrative expense, operating lease payments and reclamation cost accretion. The Company believes this measure represents the total sustainable costs of producing silver and gold concentrate from current operations and provides additional information of the Company’s operational performance and ability to generate cash flows. As the measure seeks to reflect the full cost of silver and gold concentrate production from current operations, new project capital is not included. Certain other cash and non-cash expenditures, including share-based payments, tax payments, dividends and financing costs are also not included.
The following tables provide detailed reconciliations of these measures to cost of sales, as reported in notes to the Company’s consolidated financial statements.
About Guanajuato Silver
GSilver is a precious metals producer engaged in reactivating past producing silver and gold mines in central Mexico. The Company produces silver and gold concentrates from the El Cubo Mine, the Bolanitos Mine, and the San Ignacio mine; all three mines are located within the state of Guanajuato, which has an established 480-year mining history. Additionally, the Company produces silver, gold, lead, and zinc concentrates from the Topia mine in northwestern Durango.
Qualified Person
William Gehlen, a Director of Guanajuato Silver, is a Certified Professional Geologist with the American Institute of Professional Geologists (No. 10626), and a Qualified Person as defined by National Instrument 43-101, Standards of Disclosure for Mineral Projects.
Mr. Gehlen has reviewed and approved the scientific and technical data disclosed in this news release and detected no significant QA/QC issues during review of the data and is not aware of any sampling, recovery or other factors that could materially affect the accuracy or reliability of the data referred to herein. The verification of data underlying the disclosed information includes reviewing production reports from each of the Company’s mining operations.
Legacy Gold Mines Ltd. (TSX-V: LEGY) is pleased to report assay r... READ MORE
Exceptional Gold Intercepts Across Multiple Vein Systems at the B... READ MORE
Standard Uranium Ltd. (TSX-V: STND) (OTCQB: STTDF) (FSE: 9SU0) ... READ MORE
PE-26-042 INTERSECTS 2.92 g/t over 7.30 m (70.00 m to 77.30 m) In... READ MORE