


Goldshore Resources Inc. (TSX-V: GSHR) (OTCQB: GSHRF) (FSE: 8X00) is pleased to announce gold assay results from the holes MMD-21-004 and MMD-21-005 drilled to validate gold mineralization at the Moss Lake gold deposit in Northwest Ontario, Canada.
Highlights:
Brett Richards, President and Chief Executive Officer of Goldshore commented: “The drilling intercept of 117.12m @ 1.26 g/t Au, essentially from surface, reaffirms our view that the Moss Lake gold project contains a significant volume of +1 g/t Au mineralization that can underpin a meaningful, economic gold deposit. The fact that we are continuing to intersect gold mineralization outside of the volume modelled in 2013 also affirms our belief that the deposit is wider and larger than previously interpreted.”
Technical Overview
Figure 1 shows the location of the project in Northwest Ontario. Figures 2 and 3 and Table 1 summarize the intercepts in MMD-21-004 to 005. Figure 4 and Table 2 show the drill hole location.
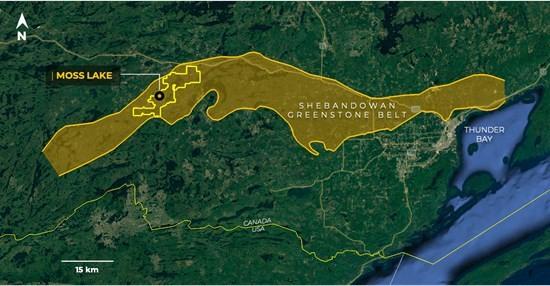
Figure 1: Location map showing Goldshore’s Moss Lake Project relative to the Shebandowan Greenstone Belt
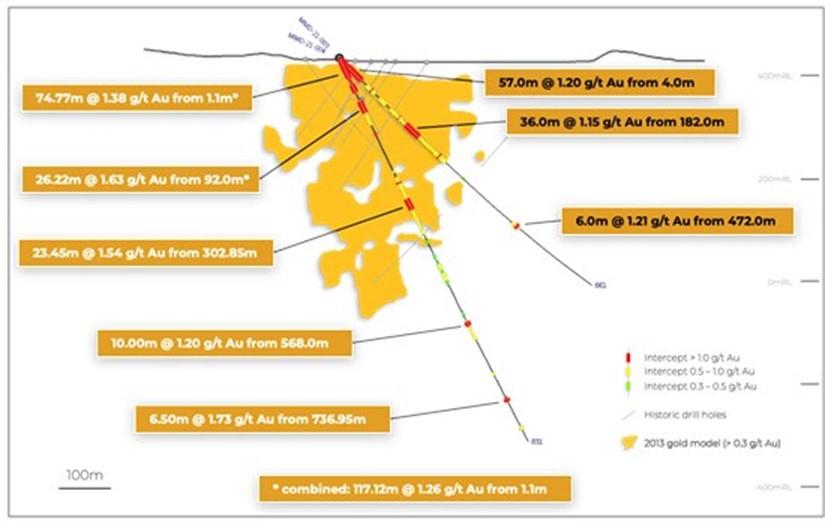
Figure 2: Drill section through MMD-21-003 (in black; reported on October 21, 2021) and MMD-21-004 showing mineralized intercepts relative to the 2013 grade model
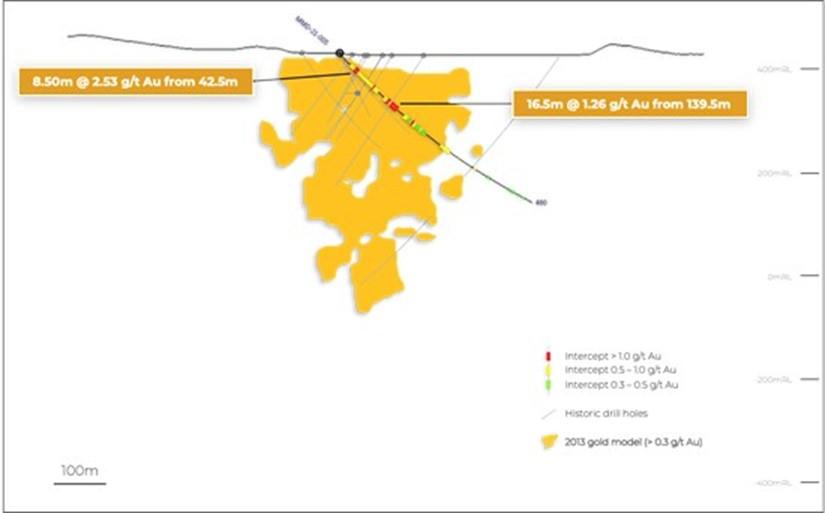
Figure 3: Drill section through MMD-21-005 showing mineralized intercepts relative to the 2013 grade model
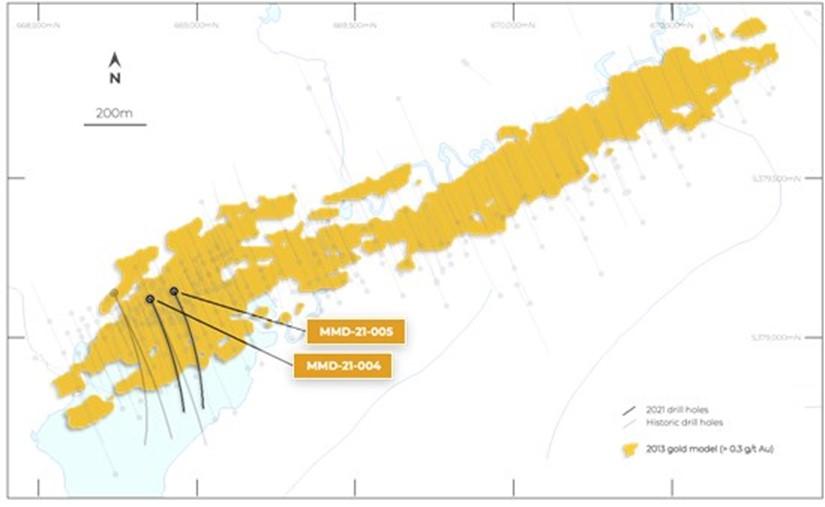
Figure 4: Drill plan showing the 2021 drill holes relative to the 2013 resource model and historic drill hole location
Table 1: Significant downhole gold intercepts in MMD-21-004 to 005
| HOLE ID | FROM (m) |
TO (m) |
HOLE LENGTH (m) |
TRUE WIDTH (m) |
GRADE (g/t Au) |
| MMD-21-004 | 1.10 | 75.87 | 74.77 | 32 | 1.38 |
| including | 1.10 | 43.63 | 42.53 | 18 | 1.37 |
| and | 57.00 | 74.00 | 17.00 | 7 | 2.40 |
| 91.05 | 144.40 | 53.35 | 23 | 0.96 | |
| including | 92.00 | 118.22 | 26.22 | 11 | 1.63 |
| 159.00 | 167.45 | 8.45 | 4 | 1.09 | |
| 242.90 | 247.10 | 4.20 | 2 | 0.51 | |
| 256.45 | 380.00 | 123.55 | 54 | 0.57 | |
| including | 266.80 | 269.85 | 3.05 | 1 | 1.63 |
| and | 302.85 | 326.30 | 23.45 | 10 | 1.54 |
| 393.00 | 400.00 | 7.00 | 3 | 0.40 | |
| 423.00 | 434.00 | 11.00 | 5 | 0.31 | |
| 440.00 | 490.35 | 50.35 | 22 | 0.41 | |
| 546.40 | 555.60 | 9.20 | 4 | 0.45 | |
| 565.55 | 608.45 | 42.90 | 19 | 0.56 | |
| including | 568.00 | 578.00 | 10.00 | 5 | 1.20 |
| 679.85 | 686.00 | 6.15 | 3 | 0.55 | |
| 732.90 | 743.45 | 10.55 | 5 | 1.21 | |
| including | 736.95 | 743.45 | 6.50 | 3 | 1.73 |
| 798.00 | 805.45 | 7.45 | 3 | 0.66 | |
| MMD-21-005 | 31.00 | 105.50 | 74.50 | 54 | 0.57 |
| including | 42.50 | 51.00 | 8.50 | 6 | 2.53 |
| and | 91.30 | 94.85 | 3.55 | 3 | 2.25 |
| 122.00 | 156.55 | 34.55 | 26 | 0.97 | |
| including | 129.50 | 135.50 | 6.00 | 4 | 1.21 |
| and | 139.50 | 156.00 | 16.50 | 12 | 1.26 |
| 174.00 | 229.00 | 55.00 | 42 | 0.38 | |
| including | 193.50 | 197.00 | 3.50 | 3 | 1.31 |
| 265.50 | 288.00 | 22.50 | 18 | 0.51 | |
| 345.00 | 349.55 | 4.55 | 4 | 0.52 | |
| 376.00 | 381.00 | 5.00 | 4 | 0.42 | |
| 425.00 | 427.00 | 2.00 | 2 | 0.35 | |
| 433.00 | 437.45 | 4.45 | 4 | 0.36 | |
| 449.00 | 451.50 | 2.50 | 2 | 0.34 | |
| 459.00 | 461.00 | 2.00 | 2 | 0.33 | |
| Intersections calculated above a 0.3 g/t Au cut off with a top cut of 30 g/t Au and a maximum internal waste interval of 10 metres. Shaded intervals are intersections calculated above a 1.0 g/t Au cut off with a top cut of 30 g/t Au. Intervals in bold are those with a grade thickness factor exceeding 20 gram x metres / tonne gold. True widths are approximate and assume a subvertical body. | |||||
Table 2: Location of drill holes in this press release
| HOLE | EAST | NORTH | RL | AZIMUTH | DIP | EOH |
| MMD-21-004 | 668855.11 | 5379119.55 | 433.84 | 155° | -45° | 831.0m |
| MMD-21-005 | 668928.28 | 5379142.99 | 429.70 | 155° | -65° | 480.2m |
| Approximate collar coordinates in NAD 83, Zone 15N | ||||||
MMD-21-004 and MMD-21-005 drilled through a massive diorite intrusion emplaced within a NE-striking and steeply SE-dipping sequence of intermediate to mafic lavas and felsic to intermediate volcaniclastic rocks. The wall rock sequence is strongly foliated and metamorphosed to greenschist facies. Later porphyritic and fine grained intermediate and mafic dikes cut the preceding rocks. These are variably foliated to massive, suggesting that the later intrusions post-date metamorphism.
All, but the later intrusive phases, are variably altered with quartz-sericite, albite-sericite and chlorite-epidote assemblages. Quartz-calcite±chlorite±tourmaline veinlets occur as a weak stockwork in the more brittle-deformed rocks. Disseminated and veinlet pyrite is common throughout and there is occasional chalcopyrite and molybdenite mineralization.
It is too soon to develop conceptual models for the deposit, though the Company is working with leading researchers in the field of orogenic gold deposits to develop its understanding of the deposit.
MMD-21-004 drilled at -60° beneath MMD-21-003, which was reported on October 21, 2021. As the hole collared in +1 g/t Au mineralization, there is an expectation of continued mineralization behind the drill hole to the north. The hole intersected 117.12m @ 1.26 g/t Au from 1.1m as part of a longer intercept of +0.3 g/t Au mineralization that extends the mineralized volume from 380 to 804 meters down hole. This represents an approximate true width lateral extension of 150 meters and vertical depth extension of 250 meters to the 2013 model, or 38% and 56%, respectively.
MMD-21-005 was drilled to twin ML-08-14, but difficulties in overburden led to an exercise in drilling a shallow angled hole that ended up at -27°. This meant that the hole tested a lower grade part of the 2013 model, which was confirmed by the drill intercept of 154.50m @ 0.57 g/t Au.
Peter Flindell, VP Exploration commented: “These drilling results confirm the caliber of results received since the start of the drilling program and confirm the significant widths of higher grade, +1 g/t Au mineralization. Our plan to expand the drilling fleet over winter will allow us to reach our targeted monthly meterage of 10,000m and allow us to test extensions to Moss Lake suggested by our airborne geophysical survey, as well as infill the gold deposit to support next year’s Preliminary Economic Analysis.”
Analytical and QA/QC Procedures
All samples were sent to ALS Geochemistry in Thunder Bay for preparation and analysis was performed in the ALS Vancouver analytical facility. ALS is accredited by the Standards Council of Canada (SCC) for the Accreditation of Mineral Analysis Testing Laboratories and CAN-P-4E ISO/IEC 17025. Samples were analyzed for gold via fire assay with an AA finish (“Au-AA23”) and 48 pathfinder elements via ICP-MS after four-acid digestion (“ME-MS61”). Samples that assayed over 10 ppm Au were re-run via fire assay with a gravimetric finish (“Au-GRA21”).
In addition to ALS quality assurance / quality control (“QA/QC”) protocols, Goldshore has implemented a quality control program for all samples collected through the drilling program. The quality control program was designed by a qualified and independent third party, with a focus on the quality of analytical results for gold. Analytical results are received, imported to our secure on-line database and evaluated to meet our established guidelines to ensure that all sample batches pass industry best practice for analytical quality control. Certified reference materials are considered acceptable if values returned are within three standard deviations of the certified value reported by the manufacture of the material. In addition to the certified reference material, certified blank material is included in the sample stream to monitor contamination during sample preparation. Blank material results are assessed based on the returned gold result being less than ten times the quoted lower detection limit of the analytical method. The results of the on-going analytical quality control program are evaluated and reported to Goldshore by Orix Geoscience Inc.
Grant of Stock Options
On November 23, 2021, certain directors, officers, employees and consultants of the Company were granted options to purchase up to an aggregate of 1,037,500 Common Shares. Each Option is exercisable into one Common Share at an exercise price of $0.65. The Options will expire five years from the date of grant. All Options were granted in accordance with Company’s stock option plan. A copy of the Plan is available under the Company’s SEDAR profile at www.sedar.com.
About Goldshore
Goldshore is an emerging junior gold development company, and owns the Moss Lake Gold Project located in Ontario. Wesdome Gold Mines Ltd. is currently a strategic shareholder of Goldshore with an approximate 30% equity position in the Company. Well-financed and supported by an industry-leading management group, board of directors and advisory board, Goldshore is positioned to advance the Moss Lake Gold Project through the next stages of exploration and development.
About the Moss Lake Gold Project
The Moss Lake Gold Project is located approximately 100 km west of the city of Thunder Bay, Ontario. It is accessed via Highway 11 which passes within 1 km of the property boundary to the north. The Moss Lake Gold Project covers 14,292 hectares and consists of 282 unpatented and patented mining claims.
Moss Lake hosts a number of gold and base metal rich deposits including the Moss Lake Deposit, the East Coldstream Deposit (Table 3), the historically producing North Coldstream Mine (Table 4), and the Hamlin Zone, all of which occur over a mineralized trend exceeding 20 km in length. A historical preliminary economic assessment was completed on Moss Lake in 2013 and published by Moss Lake Gold1. A historical mineral resource estimate was completed on the East Coldstream Deposit in 2011 by Foundation Resources Inc2,3. In addition to these zones, the Moss Lake Gold Project also hosts a number of under-explored mineral occurrences which are reported to exist both at surface and in historically drilled holes. The Moss Lake Deposit is a shear-hosted disseminated-style gold deposit which outcrops at surface. It has been drilled over a 2.5 km length and to depths of 300 m with 376 holes completed between 1983 and 2017. The last drilling program conducted in 2016 and 2017 by Wesdome Gold Mines Ltd. (“Wesdome“), which consisted of widely spaced holes along the strike extension of the deposit was successful in expanding the mineralized footprint and hydrothermal system 1.6 km to the northeast. Additionally, the deposit remains largely open to depth. In 2017, Wesdome completed an induced polarization survey which traced the potential extensions of pyrite mineralization associated with the Moss Lake Deposit over a total strike length of 8 km and spanning the entire extent of the survey grids.
The East Coldstream Deposit is a shear-hosted disseminated-style gold deposit which locally outcrops at surface. It has been drilled over a 1.3 km length and to depths of 200 m with 138 holes completed between 1988 and 2017. The deposit remains largely open at depth and may have the potential for expansion along strike. Historic drill hole highlights from the East Coldstream Deposit include 4.86 g/t Au over 27.3 m in C-10-15.
The historically producing North Coldstream Mine is reported to have produced significant amounts of copper, gold and silver4 from mineralization with potential iron-oxide-copper-gold deposit style affinity. The exploration potential immediately surrounding the historic mining area is not currently well understood and historic data compilation is required.
The Hamlin Zone is a significant occurrence of copper and gold mineralization, and also of potential iron-oxide-copper-gold deposit style affinity. Between 2008 and 2011, Glencore tested Hamlin with 24 drill holes which successfully outlined a broad and intermittently mineralized zone over a strike length of 900 m. Historic drill hole highlights from the Hamlin Zone include 0.9 g/t Au and 0.35% Cu over 150.7 m in HAM-11-75.
The Moss Lake, East Coldstream and North Coldstream deposits sit on a mineral trend marked by a regionally significant deformation zone locally referred to as the Wawiag Fault Zone in the area of the Moss Lake Deposit. This deformation zone occurs over a length of approximately 20 km on the Moss Lake Gold Project and there is an area spanning approximately 7 km between the Moss Lake and East Coldstream deposits that is significantly underexplored.
Table 3: Historical Mineral Resources1,2,3
| INDICATED | INFERRED | |||||
| Deposit | Tonnes | Au g/t | Au oz | Tonnes | Au g/t | Au oz |
| Moss Lake Deposit1 (2013 resource estimate) | ||||||
| Open Pit Potential | 39,795,000 | 1.1 | 1,377,300 | 48,904,000 | 1.0 | 1,616,300 |
| Underground Potential | – | – | – | 1,461,100 | 2.9 | 135,400 |
| Moss Lake Total | 39,795,000 | 1.1 | 1,377,300 | 50,364,000 | 1.1 | 1,751,600 |
| East Coldstream Deposit2 (2011 resource estimate) | ||||||
| East Coldstream Total | 3,516,700 | 0.85 | 96,400 | 30,533,000 | 0.78 | 763,276 |
| Combined Total | 43,311,700 | 1.08 | 1,473,700 | 80,897,000 | 0.98 | 2,514,876 |
Notes:
(1) Source: Poirier, S., Patrick, G.A., Richard, P.L., and Palich, J., 2013. Technical Report and Preliminary Economic Assessment for the Moss Lake Project, 43-101 technical report prepared for Moss Lake Gold Mines Ltd. Moss Lake Deposit resource estimate is based on 0.5 g/t Au cut-off grade for open pit and 2.0 g/t Au cut-off grade for underground resources.
(2) Source: McCracken, T., 2011. Technical Report and Resource Estimate on the Osmani Gold Deposit, Coldstream Property, Northwestern Ontario, 43-101 technical report prepared for Foundation Resources Inc. and Alto Ventures Ltd. East Coldstream Deposit resource estimate is based on a 0.4 g/t Au cut-off grade.
(3) The reader is cautioned that the above referenced “historical mineral resource” estimates are considered historical in nature and as such is based on prior data and reports prepared by previous property owners. A qualified person has not done sufficient work to classify the historical estimates as current resources and Goldshore is not treating the historical estimates as current resources. Significant data compilation, re-drilling, re-sampling and data verification may be required by a qualified person before the historical estimate on the Moss Lake Gold Project can be classified as a current resource. There can be no assurance that any of the historical mineral resources, in whole or in part, will ever become economically viable. In addition, mineral resources are not mineral reserves and do not have demonstrated economic viability. Even if classified as a current resource, there is no certainty as to whether further exploration will result in any inferred mineral resources being upgraded to an indicated or measured mineral resource category.
Table 4: Reported Historical Production from the North Coldstream Deposit4
| Deposit | Tonnes | Cu % | Au g/t | Ag | Cu lbs | Au oz | Ag oz |
| Historical Production | 2,700,0000 | 1.89 | 0.56 | 5.59 | 102,000,000 | 44,000 | 440,000 |
Note::
(4) Source: Schlanka, R., 1969. Copper, Nickel, Lead and Zinc Deposits of Ontario, Mineral Resources Circular No. 12, Ontario Geological Survey, pp. 314-316.
Peter Flindell, MAusIMM, MAIG, Vice President – Exploration of the Company, a qualified person under NI 43-101 has approved the scientific and technical information contained in this news release.
PPX Mining Corp. is pleased to announce that it has closed its fu... READ MORE
Elevation Gold Mining Corporation (TSX-V: ELVT) (OTCQB: EVGDF) i... READ MORE
Reunion Gold Corporation (TSX-V: RGD; OTCQX: RGDFF) is pleased to announ... READ MORE
Puma Exploration Inc. (TSX-V: PUMA) (OTCQB: PUMXF) is thrilled to... READ MORE
Grid Metals Corp. (TSX-V:GRDM) (OTCQB:MSMGF) is pleased to announ... READ MORE


