


PEA Highlights:
G2 Goldfields Inc. (TSX: GTWO; OTCQX: GUYGF) is pleased to announce the key findings from the Company’s Preliminary Economic Assessment for the high-grade Oko Gold Project in Guyana, South America.
Daniel Noone, CEO of G2, stated, “This PEA places the Oko Project firmly within one of the most attractive development projects globally. The PEA demonstrates the Project has the potential to generate very significant annual production at an average AISC cost of US$1,137/oz and is hosted in mining-friendly Guyana which actively promotes the development of large-scale gold mining. Moreover, the Project tenements host significant exploration potential, with multiple drill programs active across various adjacent and near-mine targets. We will be aggressively moving the Oko Project to feasibility and construction as we continue to explore this emerging gold mining district.”
Overview
The PEA outlines a combined open pit and underground operation with a 14-year life of mine, based on drilling completed up to August 31, 2025, incorporating 1.6 million ounces of gold in the Indicated category and 1.9 million ounces of gold in the Inferred category, with production averaging 281,000 ounces per year from years 2 through 11. Total production over the entire 14-year mine life is estimated at 3.2 million ounces gold with an industry leading all-in sustaining cost¹ of $1,191 per ounce ($1,137 per ounce from years 2-11). Oko is envisaged as a mix of conventional OP mining and mechanized long hole open stoping UG mining, with on-site treatment of the mined material processed through a conventional circuit consisting of comminution, gravity concentration, cyanide leach and adsorption via carbon- in-leach, carbon elution and gold recovery circuits. The OP mine is anticipated to have a LOM of six years, including 2 years of pre-stripping, while the UG mine is anticipated to have a LOM of 14 years, including 18 months of development. The PEA is based upon the Company’s updated Mineral Resource Estimate with an effective date of November 20, 2025. A technical report prepared in accordance with National Instrument 43-101 will be filed on the Company’s website and under its SEDAR+ profile within 45 days of this news release.
Click here to view a 3D model of the Oko Gold Project, Guyana
Table 1: Oko Preliminary Economic Assessment Highlights
| Key LOM Metrics (US$3,000/oz Au) | Values |
| Mine Life | 14 years |
| Total Recovered Production | 3.2 Moz Au |
| Plant Throughout | 10,000 tpd |
| Average Annual Gold Production | 228 koz (281 koz Yrs 2-11; 298 koz Yrs 3-10) |
| Strip Ratio (OP; waste : ore) | 5.4 : 1 |
| Gold Head Grade | 2.39 g/t Au |
| Gold Recovery | 94% |
| Average Operating Cash Cost¹ | $1,067/oz² |
| Average All-In Sustaining Cost (“AISC”)1 | $1,191/oz² ($1,137/oz2 Yrs 2-11) |
| Initial Capital (Includes 20% Contingency) | $664M |
| Sustaining Capital³ | $366M |
| Reclamation Costs (Net of Salvage Value) | $29M |
| Total Capital | $1,059M |
| Pre-Tax NPV5% | $3,471M |
| Pre-Tax IRR | 46% |
| After-Tax NPV5% | $2,561M |
| After-Tax IRR | 39% |
| Payback | 2.6 years |
Notes to Table 1: Total cash costs include mining, processing, surface infrastructures, transport, G&A and royalty costs. AISC includes total cash costs, sustaining capital expenditures to support the on-going operations, and closure/reclamation. Non-GAAP financial performance measures with no standardized definition under IFRS®. Refer to “Non-GAAP Financial Measures” at the end of this press release. The PEA is preliminary in nature and includes Inferred mineral resources that are considered too speculative geologically to have the economic considerations applied to them that would enable them to be categorized as mineral reserves. There is no certainty that the PEA will be realized.
Table 2: LOM Sensitivity Analysis
| Key Financial Metrics | Units | Gold Price per Ounce (US$) | ||||||||
| $2,000 | $2,500 | $3,000 (Base Case) |
$3,500 | $4,000 | ||||||
| Average Operating Cash Cost ¹(LOM) | US$/oz | 1,026 | 1,046 | 1,067 | 1,088 | 1,108 | ||||
| Average AISC¹ (LOM) | US$/oz | 1,150 | 1,170 | 1,191 | 1,211 | 1,232 | ||||
| Pre-Tax NPV5% | US$M | 1,257 | 2,364 | 3,471 | 4,578 | 5,685 | ||||
| Pre-Tax IRR | % | 24 | 36 | 46 | 55 | 63 | ||||
| After-Tax NPV5% | US$M | 897 | 1,730 | 2,561 | 3,392 | 4,223 | ||||
| After-Tax IRR | % | 20 | 31 | 39 | 47 | 54 | ||||
| Payback | Years | 4.4 | 3.2 | 2.6 | 2.3 | 2.1 | ||||
| Average Annual EBITDA¹ (LOM) | US$M | 222 | 331 | 441 | 550 | 659 | ||||
| Peak Annual EBITDA¹ (Year 6) | US$M | 337 | 481 | 634 | 788 | 942 | ||||
| Free Cash Flow¹ (LOM) | US$M | 1,520 | 2,670 | 3,819 | 4,968 | 6,117 | ||||
Notes to Table 2: Total cash costs include mining, processing, surface infrastructures, transport, G&A and royalty costs. AISC includes total cash costs, sustaining capital expenses to support the on-going operations, and closure/reclamation. EBITDA reflects net income excluding interest, taxes, depreciation and amortization expenses. Free cash flow reflects cash from operations, [less initial and sustaining capital expenditures and reclamation costs]. Non-GAAP financial performance measures with no standardized definition under IFRS®. Refer to the note at the end of this press release.
Location, Access and Infrastructure
Oko is located in the Cuyuni-Mazaruni Region (Region 7) of north-central Guyana. The Project lies approximately 120 km west-southwest of Georgetown, the capital city, and 60 km west of the town of Bartica, the capital city of Region 7 and is easily reached by an existing road network.
Mining and processing infrastructure will be located at the Project’s site. The Project will require construction of the following infrastructure: 10,000 tonnes per day (“tpd”) process plant, offices, truck shop and warehouse, new camp accommodation, surface water management facility, service and haulage roads and an initial tailings management facility. An existing airstrip will be upgraded and used for emergencies and time sensitive transport.
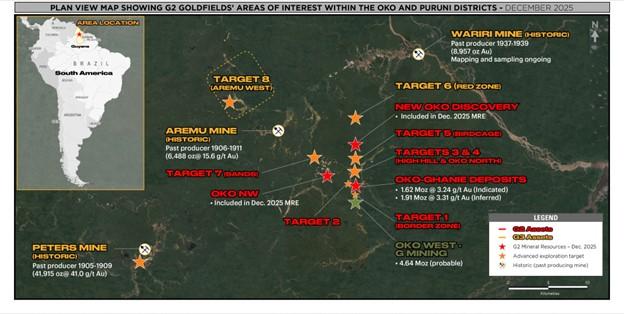
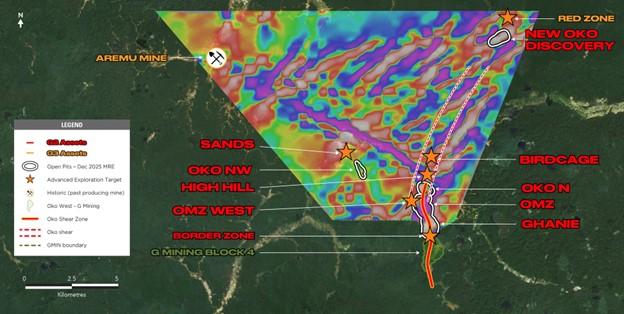
Figure 1 – Oko District Plan View
Mineral Resource Estimate
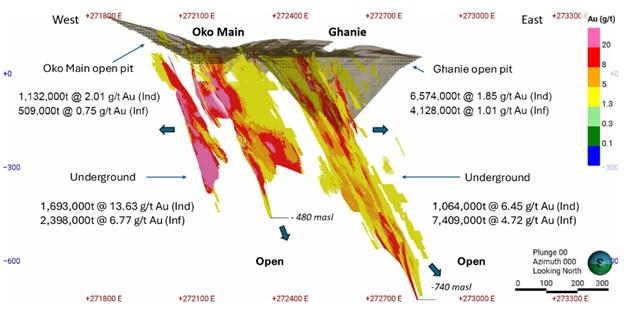
The PEA is based on the updated MRE presented in Table 3 below, totalling 1.6 million ounces gold (Indicated) and 1.9 million ounces gold (Inferred) from five deposits: Oko Main Zone, Ghanie, Northwest Oko, North Oko and the New Oko Discovery. The bulk of the gold mineralization lies along a prominent 2.5 km long north-south structure comprised of the high-grade OMZ deposit and a bulk mineable, disseminated mineral resource at Ghanie. Importantly, OMZ includes high-grade UG Indicated mineral resources of 741,600 ounces at 13.63 grams per tonne gold and 522,100 ounces at 6.77 g/t Au. The New Oko Discovery lies approximately 8.5 km to the north of these deposits and was only discovered in March 2025.
The MRE includes all drilling data obtained up to the end of August 2025 with a total inventory of 666 drill holes across 170,329 metres. The estimate was prepared by Micon International Limited (“Micon”) in accordance with NI 43-101 with an effective date of November 20, 2025.
Table 3 – Oko Project Mineral Resource Estimate Summary
| Deposit | Mining Method | Category | Tonnage (t) | Gold Avg. Grade (g/t) | Contained Gold (oz) |
| Oko Main Zone (OMZ) | OP | Total Indicated | 1,132,000 | 2.01 | 73,000 |
| Total Inferred | 509,000 | 0.75 | 12,300 | ||
| UG | Total Indicated | 1,693,000 | 13.63 | 741,600 | |
| Total Inferred | 2,398,000 | 6.77 | 522,100 | ||
| OP + UG | Total Indicated | 2,825,000 | 8.97 | 814,600 | |
| Total Inferred | 2,907,000 | 5.72 | 534,400 | ||
| Ghanie | OP | Total Indicated | 6,574,000 | 1.85 | 390,300 |
| Total Inferred | 4,128,000 | 1.01 | 133,800 | ||
| UG | Total Indicated | 1,064,000 | 6.45 | 220,800 | |
| Total Inferred | 7,409,000 | 4.72 | 1,123,300 | ||
| OP + UG | Total Indicated | 7,638,000 | 2.49 | 611,100 | |
| Total Inferred | 11,537,000 | 3.39 | 1,257,100 | ||
| New Oko Discovery | OP | Total Indicated | 5,090,000 | 1.18 | 193,800 |
| Total Inferred | 1,269,400 | 0.88 | 36,100 | ||
| UG | Total Indicated | 18,000 | 1.90 | 1,100 | |
| Total Inferred | 590,000 | 2.05 | 38,900 | ||
| OP + UG | Total Indicated | 5,108,000 | 1.19 | 194,900 | |
| Total Inferred | 1,859,000 | 1.25 | 75,000 | ||
| Oko N | OP | Total Inferred | 1,293,000 | 0.78 | 32,500 |
| Oko NW | OP | Total Inferred | 374,000 | 0.94 | 11,300 |
| Entire Oko Project | OP + UG | Total Indicated | 15,571,000 | 3.24 | 1,620,600 |
| Total Inferred | 17,970,000 | 3.31 | 1,910,300 | ||
Notes to Table 3:
Figure 2 – Oko Project Plan View of All Deposits
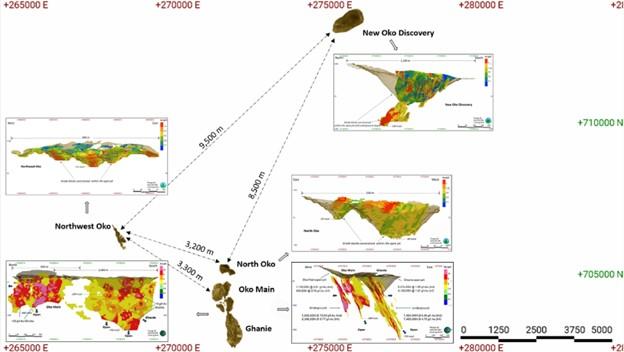
Figure 3 – OMZ & Ghanie Deposits Long Section Looking East: HG Blocks with OP and UG Mining Constraints
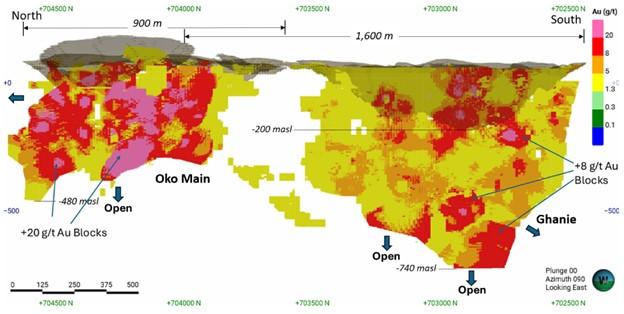
Figure 4 – OMZ & Ghanie Deposits Vertical Section Looking North: HG Blocks with OP and UG Mining Constraints
Mining and Production
Mining at the Project is planned to integrate both conventional open pit mining methods and mechanized long hole open stoping underground mining. The OP mine will have a LOM of six years, including 2 years of pre-stripping, while the UG mine will have a LOM of 14 years, including 18 months of development.
The open pit mine is expected to have a production rate that averages 4,500 tpd over a 14-year LOM. A total of 124.1 Mt of waste rock is planned to be mined, with 5.4 Mt of mineralization in saprolite and 17.4 Mt of mineralization in fresh rock, for a total strip ratio of 5.4:1, at an average grade of 1.03 g/t Au containing 0.75 Moz Au. OP mine designs and production scheduling were developed using optimized pit shells generated at a gold price of US$2,500/oz, with pit shell selection informed by appropriate revenue factor analysis to balance near-term economics and LOM value. The resulting open pit mine plan supports conventional drill-and-blast mining using an owner-operated fleet, with material movement planned to utilize 13 haul trucks and 2 hydraulic excavators.
The UG operation will take place in three areas: OMZ, Ghanie and the New Oko Discovery and will employ a long hole open stoping mining method via ramps, including transverse stoping and longitudinal stoping variations. The average UG production rate is expected to be 1,900 tpd of mineralized material, comprising approximately 1,600 tpd from stope production and 300 tpd from lateral development, from each zone. A total of 21.3 Mt of mineralized material is expected to be mined at an average diluted gold grade of 3.9 g/t Au. UG mine designs were based on the following parameters: a gold price of US$2,500/oz, a minimum mining width of 1.5 meters, and area-specific cut-off grades ranging from 1.215 g/t Au (Oko) to 1.31 g/t Au (Ghanie). The plan incorporates an effective minimum mining width of 3.0 meters (post-dilution) and accounts for mining recovery factors of 95% for longitudinal stoping.
Figure 5 – Production Profile
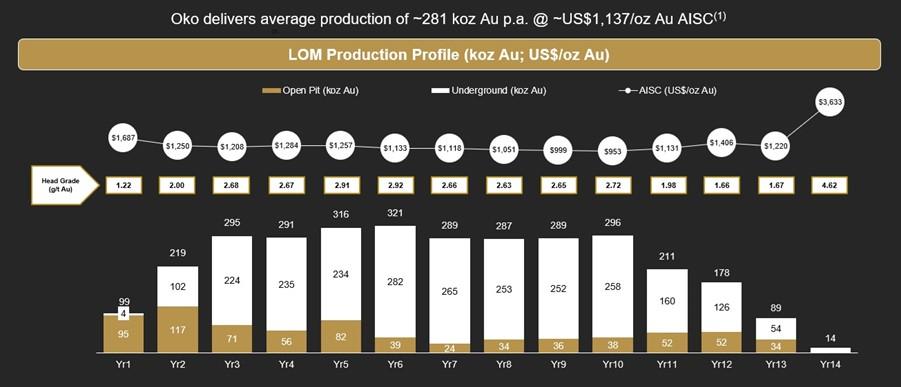
Notes to Figure 5:
Processing and Recovery
The proposed process plant design for Oko is based on a standard metallurgical flowsheet to treat gold bearing material and produce doré. The process plant is designed to nominally treat 3.6 Mt per year and will consist of comminution, gravity concentration, cyanide leach and adsorption via CIL, carbon elution and gold recovery circuits. CIL tailings will be treated in a cyanide destruction circuit and pumped to a tailings storage facility. During the open pit operational period, the ramp-up period is 6 months.
Table 4: Metallurgical Recoveries
| Feed | Grade (g/t) | Recovery (%) | Mill Feed (%) |
| Saprolite | 0.87 | 93.3 | 12.0 |
| Fresh Rock | 2.60 | 94.1 | 88.0 |
| Total (LOM) | 2.39 | 94.0 | 100.0 |
Operating Costs
LOM total site costs are estimated at approximately $947 per ounce of gold produced, excluding royalty costs, as summarized below. The PEA incorporates two federal royalties: a 3.0% net smelter return royalty for underground production and an 8.0% NSR royalty for open pit production. Precedence for these royalty rates is achieved from multiple large scale existing mining agreements in Guyana. The LOM AISC¹ is estimated to be $1,191 per ounce of gold produced based on average annual gold production of 228,000 ounces over the 14-year LOM. Average annual production from years 2 through 11 is 281,000 ounces at an AISC¹ of $1,137 per ounce.
Table 5: LOM Operating Costs Summary
| Costs | Unit Cost (USD/t milled) |
Unit Cost (USD/oz) |
| Mining Costs – OP | 9.26 | 128.14 |
| Mining Costs – UG | 34.21 | 473.23 |
| Processing Costs | 16.75 | 231.78 |
| G&A Costs | 7.53 | 104.22 |
| Transport & Refining | 0.66 | 9.17 |
| Total Site Cost | 68.42 | 946.54 |
| Royalty Costs | 8.71 | 120.49 |
| Total Operating Cash Costs¹ | 77.13 | 1067.03² |
| Sustaining Capex³ | 8.29 | 114.70 |
| Closure Costs | 0.65 | 9.04 |
| AISC1 | 86.07 | 1190.77² |
Note to Table 5: “AISC” and “Total Operating Cash Costs” are non-GAAP financial performance measures with no standardized definition under IFRS®. Refer to “Non-GAAP Financial Measures” at the end of this press release.
Capital Costs
Initial capital costs are estimated at $664 million, including contingencies of $108 million (20%) with LOM sustaining costs estimated at $366 million. These estimates are based on current costs and quotes received from potential local vendors and references and experience from similar operations.
The main components of the $664 million initial capital costs (including contingencies) include: $278 million for the processing plant equipment and buildings plus $56 million indirect costs to construct the process plant, $96 million for mining equipment and surface preparation, $72 million for surface civil and infrastructure, $46 million for capitalized pre-stripping, and $116 million for owner’s costs. The main components of the $366 million sustaining capital expenditures include: $182 million for mining equipment, $74 million for tailings and water treatment, $62 million for process plant equipment, and $48 million contingency.
Table 6: Capital Cost Summary
| Capital Costs | US$M |
| Initial Capital Expenditures (Includes 20% Contingency of $108 M) | $664 |
| Sustaining Capital Expenditures³ | $366 |
| Reclamation Costs (Net of Salvage Value) | $29 |
| Total Capital Expenditures – LOM | $1,059 |
| Total Capital Expenditure (per Ounce Sold) – LOM | $332/oz |
Note to Table 6: Sustaining capital expenditures is a non-GAAP financial performance measure and supplementary financial measure with no standardized definition under IFRS®. Refer to “Non-GAAP Financial Measures” at the end of this press release.
Environmental and Permitting
With the completion of the PEA, the Company is now able to submit its preliminary mine design to the Environmental Protection Agency to apply for the environmental permit for the Oko Project. The permitting process involves obtaining environmental authorization from the EPA following the submission and approval of an Environmental Social Impact Assessment, which the Company expects to file in Q1 2026.
As part of this process, and over the last two years, G2 has completed comprehensive environmental baseline studies via third party consultants. These studies were designed to recommend actions for effective Project design, regulatory compliance and to support the preparation of an ESIA as part of its environmental license submission. Importantly, the Project area is not designated as a priority conservation site and does not overlap with any protected or Indigenous lands.
The Company anticipates that, based on recent precedents in Guyana, the period from ESIA submission to receiving a temporary environmental permit to begin early works on the Project would be 24 months or less. The Company’s permitting activities will be guided by ongoing stakeholder engagement and government consultations, ensuring compliance with environmental and social international standards.
Workforce
During mine construction, the workforce assumed in the PEA is projected to peak at approximately 1,250 personnel over an estimated 18-month period, in addition to the team required to undertake open-pit pre-stripping activities during the 6 months preceding commercial production. Once in operation, the mine and processing plant are expected to sustain an average workforce of approximately 800 employees. Operations are anticipated to run on a continuous schedule consisting of two 12-hour shifts per day, seven days a week.
Near-Mine Resource Growth Opportunities
Drilling continues to target open extensions of high-grade mineralization found immediately outside mineral resources where assays are pending on drilling with visible gold mineralization confirming the potential to add additional gold ounces (refer to press release dated October 27, 2025). Figure 7 highlights targets that collectively represent a robust pipeline of near-mine growth opportunities. Together they aim to extend known high-grade systems, test new mineralized structures, and build on the strong resource base already established.
Figure 6 – Oko Project Plan View and Near-Mine resource Growth Targets
Endnotes
Data Validation
The drilling database used to estimate the MRE reported in this press release was reviewed by Micon. A site visit was conducted by William J. Lewis B.Sc. P.Geo., to inspect mineralized intervals, alteration assemblages and QA/QC protocols and to conduct field checks of trenches and to validate drill collars. Database verifications consisted of drill logs (including lithology, alteration, weathering), assay certificates, sample intervals, drill hole collars, downhole survey information and quality control/quality assurance (QA/QC) results validations.
QA/QC
Drill core is logged and sampled in a secure core storage facility located on the Project site, Guyana. Core samples from the program are cut in half, using a diamond cutting saw, and are sent to MSALABS Guyana, in Georgetown, Guyana, which is an accredited mineral analysis laboratory, for analysis. Samples from sections of core with obvious gold mineralisation are analysed for total gold using an industry-standard 500g metallic screen fire assay (MSALABS method MSC 550). All other samples are analysed for gold using standard Fire Assay-AA with atomic absorption finish (MSALABS method; FAS-121). Samples returning over 10.0 g/t gold are analysed utilizing standard fire assay gravimetric methods (MSALABS method; FAS-425). Certified gold reference standards, blanks, and field duplicates are routinely inserted into the sample stream, as part of G2 Goldfield’s QA/QC program. No QA/QC issues were noted with the results reported herein.
Technical Report and Qualified Person
The PEA is derived using the Company’s updated MRE effective as of November 20, 2025. The effective date of the PEA is December 8, 2025, and the Technical Report prepared in accordance with NI 43-101 will be filed on the Company’s website and under its SEDAR+ profile within 45 days of this news release.
Richard Gowans, P.Eng is responsible for metallurgy, recovery methods and process plant operating costs. William Lewis, P.Geo. is responsible for property description, geology, drilling, sampling and the mineral resource estimate. Peter Szkilnyk, P.Eng. and Moe Hashmi, P.Eng. are responsible for the mining methods and capital and operating costs related to the open pit and underground mining. Chris Jacobs, C.Eng, MIMMM, MBA is responsible for the economic analysis. William Lewis, P.Geo., is responsible for the environment and permitting aspects. All of the aforementioned persons are considered “Qualified Persons” for the purposes of NI 43-101) and have reviewed and approved the scientific and technical disclosure contained in this news release.
Mineral Resources are estimated by William J. Lewis, P.Geo., from Micon with more than 35 years’ experience in mineral exploration, resource estimation and mining, worldwide. Mr. Lewis is considered a “Qualified Person” for the purposes of NI 43-101 and has reviewed and approved the scientific and technical disclosure contained in this news release. The Qualified Person has verified the data underlying the MRE contained in this news release. There were no limitations imposed on the Qualified Person for verification of the data.
In addition, all scientific and technical information in this news release has been reviewed and approved by Dan Noone (CEO of G2 Goldfields Inc.), a “Qualified Person” within the meaning of NI 43-101. Mr. Noone (B.Sc. Geology, MBA) is a Fellow of the Australian Institute of Geoscientists.
About Micon
Micon International Limited is a firm of senior geological, mining, metallurgical and environmental consultants headquartered in Toronto, Canada with an office in the United Kingdom. The professionals of Micon have extensive experience in mineral resource estimation. Micon’s practice is worldwide and covers all base and precious metals as well as rare earths and speciality minerals. The firm’s clients include major and junior mining companies, all the major Canadian banks and investment houses and a large number of financial institutions in other parts of the world, including developmental financial institutions and export credit agencies. Micon’s technical, due diligence and valuation reports are accepted by regulatory agencies such as the US Securities and Exchange Commission, the Ontario Securities Commission, the Australian Stock Exchange, and the London Stock Exchange.
About G2 Goldfields Inc.
G2 Goldfields finds and develops gold deposits in Guyana. The founders and principals of the Company have been directly responsible for the discovery of more than 11 million ounces of gold in the prolific and underexplored Guiana Shield. G2 continues this legacy of exploration excellence and success. Total combined open pit and underground resources across all 5 discoveries to date include:
The MRE was prepared by Micon International Limited with an effective date of November 20, 2025. The Oko district has been a prolific alluvial goldfield since its initial discovery in the 1870s, and modern exploration techniques continue to reveal the considerable potential of the district.
Hudbay Minerals Inc. (TSX:HBM) (NYSE: HBM) today released its ann... READ MORE
Strategic acquisition of an established operating gold mine, loca... READ MORE
Cerro de Pasco Resources Inc. (TSX-V: CDPR) (OTCQB: GPPRF) (FRA: ... READ MORE
The Garneau Titanium Project Features Ilmenite-Rich Boulder with ... READ MORE
ValOre Metals Corp. (TSX‐V: VO) (OTCQB: KVLQF) (Frankfurt: KEQ0... READ MORE


