


G Mining Ventures Corp. (TSX:GMIN) (OTCQX:GMINF) reported its financial and operating results for the fourth quarter and full year ended December 31, 2025. Unless otherwise indicated, all dollar amounts are in U.S. dollars.
“Tocantinzinho completed its first full year of commercial production in 2025, delivering consistent operating performance with production, recoveries and costs in line with expectations,” said Louis-Pierre Gignac, President and Chief Executive Officer. Production, costs and recoveries largely met or exceeded guidance, underscoring the asset’s reliability and operational discipline. The operation generated $255 million in free cash flow, strengthening our balance sheet while fundi ng the advancement of Oko West. Fourth quarter performance was the strongest of the year across key metrics, including production, grade and margins, demonstrating solid steady-state operations. We enter 2026 with Tocantinzinho performing to plan, Oko West fully funded and under construction, and Gurupi continuing to advance through exploration and permitting.”
Fourth quarter and full year 2025 highlights and the Corporation’s short to medium-term outlook are set out below.
Fourth Quarter and Full-Year 2025 Production and Costs Summary
| Q4 2025 | Q4 2024 | FY 2025 | FY 2024 | ||
| In thousands of $, except as otherwise noted | |||||
| Operating Results | |||||
| Gold Produced | oz | 47,346 | 40,147 | 171,871 | 63,566 |
| Gold Sold | oz | 47,457 | 39,938 | 172,093 | 57,082 |
| Total Cash Costs (1) | $/oz | 808 | 577 | 748 | 668 |
| All-in Sustaining Cost (1) | $/oz | 1,245 | 862 | 1,155 | 972 |
| Average Realized Gold Price (1) (2) | $/oz | 4,032 | 2,560 | 3,374 | 2,545 |
Production
Gold production for the fourth quarter of 2025 increased by 2% compared to the third quarter, primarily driven by higher processed grades. Mill throughput during the quarter was impacted by unplanned downtime in November following a failure of the ball mill motor bearings. For the full year 2025, gold production was 2% below the lower end of the Corporation’s guidance range. This variance was mainly attributable to a slower-than-expected operational ramp-up at the beginning of the year and lower head grades processed, partially offset by improved recovery rates. TZ continues to demonstrate stable performance at or near nameplate capacity, supporting im proved operating consistency heading into 2026.
Plant throughput was stable throughout the fourth quarter at 91% of nameplate capacity during the fourth quarter. TZ achieved a plant throughput of 87% for the full year which illustrates the continued improvements in plant availability throughout the year. Recovery rates have also improved, achieving 91.8% during the fourth quarter and 90.6% for full year 2025, supported by increased plant stability and reduced variability in the flotation circuit’s operating parameters, largely due to the implementation of the expert control system.
Cost Performance
Total cash costs (1) for the fourth quarter were $808 per ounce, representing an increase of $87 per ounce compared to the third quarter. The increase was primarily driven by higher royalty expenses, the new State of Para’s production tax and lower gold sales volumes during the period. For the full year 20 25, total cash costs (1) averaged $748 per ounce, exceeding the upper end of guidance by 9%. This was mainly due to elevated royalty costs, new State of Para’s production tax and lower than expected production levels.
All-in Sustaining Costs(1)
AISC(1) for the fourth quarter was $1,245 per ounce, an increase of $199 per ounce compared to the third quarter. The increase reflects higher total cash costs (1) and increased sustaining capital expenditures as well as higher general and administrative expenses. For the full year 2025, AISC(1) averaged $1,155 per ounce, remaining within the Corporation’s guidance range. Higher royalty costs and lower sales were offset by reduced sustaining capital spending.
Financial Review
| Q4 2025 | Q4 2024 | FY 2025 | FY 2024 | ||
| In thous ands of $, except as otherwise noted | |||||
| Financial Results | |||||
| Revenue | $ | 191,335 | 102,254 | 580,665 | 145,251 |
| Cash generated from operating activities before net change in working capital items | $ | 122,103 | 73,181 | 340,446 | 91,313 |
| Cash generated from operating activities before net change in working capital items | $/share | 0.54 | 0.33 | 1.50 | 0.56 |
| Cash generated from operating activities | $ | 95,984 | 43,401 | 307,558 | 28,492 |
| Cash generated from operating activities | $/share | 0.42 | 0.19 | 1.36 | 0.17< /td> |
| Free Cash Flow (1) | $ | 79,682 | 36,033(3) | 254,813 | 17,996(3) |
| Free Cash Flow (1)< /td> | $/share | 0.35 | 0.16 | 1.12 | 0.11 |
| Net Income | $ | 91,019 | 15,238 | 287,863 | 29,646 |
| Net Income | $/share | 0.40< /td> | 0.07 | 1.27 | 0.18 |
| Adj. net income (1) | $ | 97,741 | 36,926 | 283,342 | 50,034 |
| Adj. net income (1) | $/share | 0.43 | 0.17 | 1.25 | 0.31 |
| EBITDA (1) | $ | 126,500 | 66,623 | 421,949 | 82,684 |
| Adj. EBITDA (1) | $ | 135,592 | 77,910 | 419,144 | 99,645 |
| Capital Expenditures (sustaining) | $ | 16,302 | 7,368 | 52,745 | 10,496 |
| Capital Expenditures (growth) | $ | 97,357 | – | 219,323 | – |
| Financial Position | |||||
| Cash and Cash Equivalents | $ | 134,548 | 141,215 | ||
| Total Debt | $ | 141,440 | 113,754 | ||
| Net Debt (Cash) | $ | 6,892 | (27,461) | ||
Net Income
The Corporation reported net income of $91 million or net income of $0.40 and $0.39 per share on a basic and diluted basis respectively for the three months ended December 31, 2025. Adjusted net income was $98 million or $0.43 and $0.42 per share on a basic and diluted basis respectively for the three months en ded December 31, 2025. For the year ended December 31, 2025, reported net income was $288 million or net income of $1.27 and $1.25 per share on a basic and diluted basis respectively. Adjusted net income was $283 million or $1.25 and $1.23 per share on a basic and diluted basis respectively.
Cash Provided by Operating Activities
Cash provided by operating activities in the fourth quarter was $96 million, a decrease of $6 million over the third quarter 2025 primarily due to net change in non-cash working capital items and lower gold sold partially compensated by higher gold price received during the quarter. Cash provided by operating activities before net change in non-cash working capital increased by $15 million over the third quarter. For the full year 2025, cash provided by operating activities amounted to $308 million and cash provided by operating activities before net change in working capital amounted to $340 million.
Free Cash Flow(1)
Free cash flow(1) decreased over the third quarter for the reasons described above related to cash provided by operating activities. For the full year, TZ generated free cash flow(1) of $255 million ($1,484 per ounce produced) or $1.12 per share, highlighting the asset’s strong margin profile and ability to fund growth internally.
Capital Expenditures
The table below sets out a summary of capital expenditures, in each case broken down between sustaining capital expenditures and non-sustaining capital expenditures.
| Q4 2025 | FY 2025 | |
| In millions of $, except as otherwise noted | ||
| Sustaining | 8,106 | 32,230 |
| Capitalized Waste Stripping | 7,324 | 18,209 |
| Near-Mine Exploration | 872 | 2,306 |
| TZ Sustaining Capital Expenditures | 16,302 | 52,745 |
| TZ Exploration | 808 | 3,676 |
| Oko West Exploration | 2,269 | 8,772 |
| Gurupi Exploration | 1,434 | 3,363 |
| Total Exploration | 4,511 | 15,811 |
| Oko West Project Development | 92,846 | 203,512 |
| Non-Sustaining Capital | 97,357 | 219,323 |
Strong free cash flo w drives further balance sheet strength
As of December 31, 2025, the Corporation’s total long-term debt was $141 million. $81 million was outstanding on the Corporation’s revolving credit facility as of December 31, 2025, and available liquidity under the facility was $269 million, not including the uncommitted $150 million accordion feature. Total equipment financing outstanding was $60 million as of December 31, 2025. Cash and cash equivalents increased $40 million from the prior quarter to $135 million.
Reconciliation of Cash Costs (1) and AISC (1)
| Q4 2025 | Q4 2024 | FY 2025 | FY 2024 | ||
| In thousands of $, except as otherwise noted | |||||
| Operating Expenses | $ | 32,363 | 19,327 | 110,632 | 33,698 |
| Royalties | $ | 5,999 | 3,732 | 18,166 | 4,439 |
| Total Cash Costs (1) | $ | 38,362 | 23,059 | 128,798 | 38,137 |
| Sustaining Capital and others* | $ | 16,440 | 7,517 | 53,233 | 10,768 |
| Site Level AISC (1) | $ | 54,802 | 30,576 | 182,031 | 48,905 |
| G&A Expenses ** | $ | 4,271 | 3,865 | 16,806 | 6,561 |
| Total AISC (1) | $ | 59,073 | 34,441 | 198,837 | 55,466 |
| Costs per oz: | |||||
| Cash Costs (1) | $/oz | 808 | 577 | 748 | 668 |
| Site Level AISC (1) | $/oz | 1,155 | 765 | 1,057 | 857 |
| AISC (1) | $/oz | 1,245 | 862 | 1,155 | 972 |
*Comprised of Sustaining capital expenditures, capitalized stripping (sustaining), exploration (sustaining) and accretion to rehabilitation provision (ARO).
**This amount excludes corporate depreciation and amortization expenses totaling $118,000 and $489,000 for the three months and the year ended December 31, 2025, respectively ($265,000 and $498,000 for the three months and the year ended December 31, 2024, respectively). This amount also excludes non-sustaining allocation of G&A Expenses totaling $90,000 and $643,000 for the three months and the year ended December 31, 2025, respectively ($195,000 for the three months and the year ended December 31, 2024).
Q4 2025 Development Activities
Oko West Gold Project Update
The early works program completed last year enabled key infrastructure milestones, including construction of the access road, expansion of capacity at the permanent camp, and substantial completion of the barge landing—an important component of the project’s logistics network. Main construction activities are now underway in the process plant area, with the grinding circuit representing the project’s critical path. Progress remains on schedule, with rebar and formwork in place and one of the largest concrete pours for the Semi-Autogenous Grinding mill now complete. Both mills are expected to arrive in Guyana in July 2026, with commissioning and first gold production targeted for the fourth quarter of 2027.
Procurement of major packages is largely complete resulting in total project commitments of $424 million, or 43% of project total. Project remains on budget and is fully fun ded through completion and ramp-up to commercial production.
Construction Progress:
Total capital expenditures for 2026 are projected to range between $514 million and $568 million as project activity ramps up, including the commencement of major construction at the process plant, supporting i nfrastructure, and the initiation of mine pre-production activities. Substantially all major equipment is expected to be delivered during 2026. Capital expenditures in 2027 represent the remaining balance and include commissioning activities and pre-production revenue.
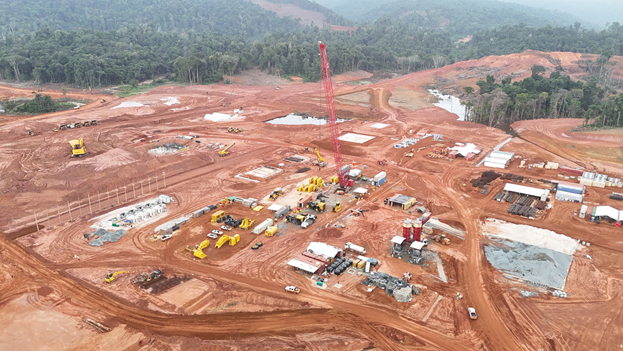
A Closer Look at our Processing Plant: With mass excavation nearing completion, focus has shifted to a significant ramp-up in concrete pouring activities, marking continued cons truction progress.
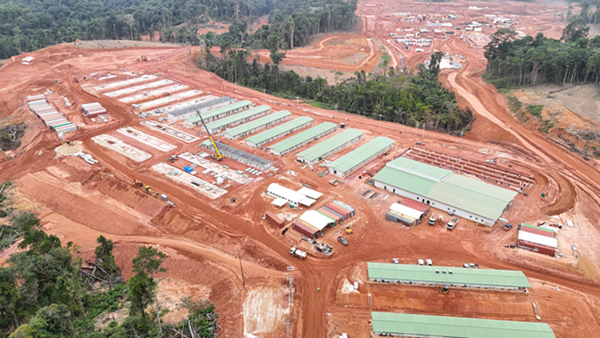
Dormitories & Camp Kitchen: The centre of the image highlights progress on the camp dormitories, with more than 700 beds alre ady installed and additional capacity forthcoming. To the right, construction of the camp kitchen is underway, while the completed foundation of the Welcome Centre is visible in the background.
Gurupi Gold Project
The 2026 exploration budget for Gurupi totals $21 million, supporting the resumption of regional exploration programs and resource delineation drilling, and the advancement of the ESIA, which is expected to be filed in H2 2026. An updated Mineral Resource Estimate along a PEA are targeted by year end 2026.
Q4 2025 Exploration Activities
Total exploration expenditures during the fourth quarter of 2025 were $5 million and $16 million for the full year.
TZ: The drilling programs continued to test exploration targets within 5km radius around the existing infrastructure of the TZ gold mine, including testing the extension of the TZ d eposit at depth and along strike. A total of 3,285 m of diamond drilling and 1,893 m of reverse circulation drilling were executed during this quarter. Within the TZ pit, 1,715 m were drilled to explore extension of the deposit at depth. For regional exploration, the focus was to test the main structural trend within 5 km to the infrastructure. Some of the results from drillholes returned 27.0 m at 0.85 g/t Au and 23.0 m at 0.91 g/t Au (BRZ-25-089A) south of the TZ pit, demonstrating the presence of gold, however continuity and volume were not reached. Building on insights gained from the southern exploration results, the team redirected its efforts to the northwest of TZ pit, where the geological trend shows strong potential and 1,016 m of diamond drilling were completed at Toca‑Toca during the last quarter.
Oko West: The main exploration focus was to test the NW Extensi on target. This target was generated from geological mapping, geophysics completed in 2025, gold anomalies in soil sampling, anomalous gold samples in trenches with multiple gold intercepts including 10.0 m at 0.72 g/t Au and 12.0 m at 0.29 g/t Au (OKWT24-105), highlighting approximatively +50m of anomalous gold grade. A total of 2,507 m of diamond drilling, 4,944 m of reverse circulation drilling, and 52 m of trenching were executed during this quarter in the NW Extension target.
Gurupi: Exploration drilling activities restarted at Gurupi in the fourth quarter, with two diamond drill rigs and one reverse circulation drill rig. Field activities continued to test the continuity of the Chega Tudo deposit to the north within the Maranhão State. Trenching and soil sampling were also collected. Exploration focused on Grodiacol targets with a total of 1,085 m of diamond drillin g and 1,046 m of reverse circulation drilled since November 2025 following trench intercepts of 7.0 m at 2.76 g/t Au (GSUBT-25-005), 19.0 m at 0.96 g/t Au (GJIBT-25-001) and 13.4 m at 1.02 g/t Au (GUD-26-007). At a regional scale, 571 additional soil samples were collected, with most assays still pending.
2026 & 2027 Operational Guidance(4)
TZ gold production is expected to total 160,000 to 190,000 ounces in 2026 and 200,000 to 235,000 ounces in 2027. The increase in 2027 reflects mine sequencing that provides access to higher-grade areas.
Total cash costs(1) in 2026 are expected to range from $736 to $865/oz, with AISC(1) of $1,230 to $1,444/oz. At the midpoint of guidance, total cash costs(1) and AISC(1) are expected to decline by approximately 14% and 21%, respectively, in 2 027.
As TZ moves into steady-state operations, the Corporation expects to focus on productivity improvements, cost management and targeted debottlenecking initiatives, including tailings pumping capacity and broader throughput optimization.
| 2025 Guidance | 2025 Actuals | 2026 | 2027 | ||
| In millions of $, except as otherwise noted |
|
||||
| Gold Production | k oz | 175 – 200 | 172 | 160 – 190 | 200 – 235 (6) |
| Total Cash Costs (1) | $/oz Au | 620 – 685 | 749 | 736 – 865 | 633 – 743 |
| Mine-Site AISC (1) | $/oz Au | – | 1,058 | 1,133 – 1,330 | 898 – 1,054 |
| AISC (1) | $/oz Au | 1,025 – 1,155 | 1,156 | 1,230 – 1,444 | 977 – 1,146 |
| Sustaining Capital Expenditures | |||||
| Sustaining | $ | 35 – 45 | 32 | 38 – 45 | 19 – 23 |
| Capitalized Stripping | $ | 23 | 18 | 31 – 36 | 43 – 51 |
| Exploration (Sustaining) | $ | 2 | 2 | – | – |
| Total Sustaining Capital Expenditures | $ | 60 – 70 | 52 | 69 – 81 | 62 – 74 |
| Non-Sustaining Capital Expenditures (5) | |||||
| TZ Exploration | $ | 9 | 4 | 8 – 10 | 8 – 10 |
| Oko West Exploration | $ | 8 | 9 | 15 – 17 | 14 – 18 |
| Gurupi Exploration | $ | 6 -8 | 3 | 19 – 23 | 18 – 22 |
| Total Exploration | $ | 23 – 25 | 16 | 42 – 50 | 40 – 50 |
| Oko West Project Development | $ | 200 – 240 | 203 | 514 – 568 | 217 – 240 |
| Total No n-Sustaining Capital Expenditures | $ | 223 – 265 | 219 | 556 – 618 | 257 – 290 |
Environmental, Social & Governance Highlights
Health & Safety
TZ maintained a strong safety record throughout the year, recording a Total Recordable Injury Frequency Rate of 0.23 in 2025, with 2 Lost-Time Incidents across approximately 2.6 million person-hours worked.
At Oko West, the project recorded 990,811 person-hours worked for the year with zero Lost-Time Incidents and a TRIFR of 0.40. Safety culture and leadership remain foundational commitments as the workforce grows toward peak construction.
Workforce & Local Relations
At TZ, approximately 82.6% of the year-end workforce of employees and contractors was from the state of Pará, Brazil. Women represented 14% of the total workforce.
At Oko West, 83% of the workforce of 977 employees and contractors was Guyanese, reflecting the Corporation’s commitments to local hiring and alignment with the expectations under the Mining License issued on December 8, 2025.
Environment & Compliance
The TZ tailings storage facility advanced to elevation 153 metres in 2025 in accordance with the approved mine plan and applicable Brazilian environmental regulations. The operation-maintained compliance with applicable effluent, water quality and air quality standards throughout the year.
At Gurupi, the Corporation continued to advance the ESIA process, with submission targeted for H2 2026.
Governance & Regulatory Milestones
The issuance of the Oko West Mining License by the Guyana Geology and Mines Commission on December 8, 2025 marked a major regulatory milestone for the project.
The Corporation intends to publish its 2025 Sustainability Report in H2 2026, covering the Task Force on Climate-related Financial Disclosures (TCFD) -aligned climate disclosures, biodiversity impact assessments and updated community investment data across its operating jurisdictions.
Supplemental Information – Previously Released
This news release should be read in conjunction with the following previously disseminated announcements regarding recent developments:
Qualified Person
Louis-Pierre Gignac, President & Chi ef Executive Officer of GMIN, a QP as defined in NI 43-101, has reviewed the press release on behalf of the Corporation and has approved the technical disclosure contained in this press release.
About G Mining Ventures Corp.
G Mining Ventures Corp. is a mining company engaged in the acquisition, exploration and development of precious metal projects to capitalize on the value uplift from successful mine development. GMIN is well-positioned to grow into the next mid-tier precious metals producer by leveraging strong access to capital and proven development expertise. GMIN is currently anchored by the Tocantinzinho Mine in Brazil, supported by the Gurupi Project in Brazil and the Oko West Project in Guyana — all with significant exploration upside and located in mining-friendly jurisdictions.
Cerro de Pasco Resources Inc. (TSX-V: CDPR) (OTCQB: GPPRF) (FRA: ... READ MORE
The Garneau Titanium Project Features Ilmenite-Rich Boulder with ... READ MORE
ValOre Metals Corp. (TSX‐V: VO) (OTCQB: KVLQF) (Frankfurt: KEQ0... READ MORE
Updated binding long-form term sheet with the Government of Canad... READ MORE


