


G Mining Ventures Corp. (TSX: GMIN) (OTCQX: GMINF) is pleased to report its production and financial results1 for the fourth quarter and full year ended December 31, 2024.
Fourth Quarter 2024 Highlights First Full Quarter of Commercial Production
“2024 marked a transformational year for GMIN as we executed all phases of our ‘Buy. Build. Operate.’ Strategy,” commented Louis-Pierre Gignac, President & Chief Executive Officer. “With just four months of commercial production, TZ is already generating significant free cash flow, giving us the financial flexibility to fund our next phase of growth. The acquisition of Oko West, recognized as one of the top undeveloped gold projects globally, positions us to surpass 500,000 ounces of annual production. Combined with the high-potential Gurupi project acquired from BHP, GMIN is firmly established as a low-cost, high-growth gold producer with a clear path to long-term value creation.”
Louis-Pierre Gignac continued, “With a full year of production coming out of TZ in 2025, we expect strong cash flow to support disciplined investment in Oko West and strategic exploration across our portfolio. Key milestones—Oko West’s Feasibility Study, permitting, and funding—are on track to unlock our next phase of growth. GMIN remains focused on low-cost production, project execution, and advancing our multi-asset platform.”
| _________________________________ |
| 1 Additional details are available in the Corporation’s Consolidated Financial Statements and Management’s Discussion and Analysis (“MD&A”), filed on SEDAR+ at www.sedarplus.com under the Corporation’s profile. |
| 2 These measures are non-IFRS financial measures. Refer to section “Non-IFRS Financial Performance Measures” in the associated MD&A for further information and a detailed reconciliation to comparable IFRS measures. |
Operational Results1,3:
| Q4 2024 | FY 2024 | ||
| In thousands of $, except as otherwise noted | |||
| Mining Activities | |||
| Ore Tonnes Mined | kt | 2,164 | 6,406 |
| Waste Tonnes Mined | kt | 2,105 | 7,887 |
| Total Tonnes Mined | kt | 4,269 | 14,293 |
| Strip Ratio | Waste/ore | 0.97 | 1.23 |
| Processing Activities | |||
| Total Tonnes Processed | kt | 968 | 1,713 |
| Average Plant Throughput | tpd | 10,523 | 8,697 |
| Average Gold Recovery | % | 89.2 % | 87.2 % |
| Average Gold Processed | g/t Au | 1.45 | 1.32 |
| Gold Produced | oz | 40,147 | 63,566 |
| Gold Sold | oz | 39,938 | 57,082 |
| Per Ounce Metrics | |||
| Average Realized Gold Price2,4 | $/oz | 2,560 | 2,545 |
| Average Gold Price Received2,4 | $/oz | 2,380 | 2,385 |
| Total Cash Costs2 | $/oz | 577 | 668 |
| Site-Level AISC2 | $/oz | 765 | 857 |
| AISC2 | $/oz | 862 | 972 |
Financial Results:
| Q4 2024 | FY 2024 | ||
| In thousands of $, except as otherwise noted | |||
| Revenue | $ | 102,254 | 145,251 |
| Cost of Goods Sold | $ | (39,470) | (57,820) |
| Income from Mining Operations | $ | 62,784 | 87,431 |
| Net Income (Loss) | $ | 47,597 | 62,005 |
| Per Share – Basic | $/share | 0.21 | 0.38 |
| Adjusted Net Income (Loss)2 | $ | 57,976 | 71,084 |
| Per share – Basic | $/share | 0.26 | 0.44 |
| EBITDA2 | $ | 77,932 | 93,993 |
| Adjusted EBITDA2 | $ | 77,910 | 99,645 |
| Cash Flow from Operating Activities
before the Net Change in Working Capital Items |
$ | 73,181 | 91,313 |
| Cash Flow from Operating Activities | $ | 43,401 | 28,492 |
| Free Cash Flows2 | $ | 52,986 | 34,949 |
| Per share – Basic | $/share | 0.24 | 0.22 |
| Financial Position | FY 2024 | FY 2023 | |
| In thousands of $, except as otherwise noted | |||
| Cash and Cash Equivalents | $ | 141,215 | 52,398 |
| __________________________________ | |||
| 3 Full-year 2024 production numbers are based on the third and fourth quarters of 2024, including the two months of commissioning (July and August) and four months of commercial production (through December). | |||
| 4 The Average Gold Price Received excludes the non-cash portion of the Average Realized Gold Price. | |||
Liquidity and Capital Resources
The Corporation ended 2024 with a cash and cash equivalents balance of $141.2 million.
The $36.6 million increase quarter over quarter is attributed to the following:
Free Cash Flow generated by TZ will be the primary source of capital to fund future disciplined growth at GMIN’s development projects and is defined by the Corporation as:
| __________________________________ |
| 5 Exclusion adjustment is done due to its long-term nature (expected towards the end of mine life). |
Tocantinzinho Mine Highlights
After two months of successful commissioning, GMIN declared commercial production at TZ on September 1st, 2024, delivered on schedule and within budget. Q4 marked TZ’s first full quarter of commercial production, contributing 40,147 ounces to an annual production total of 63,566 ounces.
Mining operations performed ahead of expectations, with a total of 14.3 Mt mined in 2024, including 6.4 Mt of ore, resulting in a low annual strip ratio of 1.23x. Plant throughput in Q4 averaged 10,523 t/d (82% of nameplate capacity) despite unplanned downtime related to SAG mill liner replacements. Recoveries remained strong at over 89.2%, in line with Feasibility Study estimates, supporting the processing of higher-grade ore averaging 1.45 g/t Au in Q4. A full metallic liner system, scheduled for installation in early Q2 2025, is expected to improve plant availability and allow the process plant to reach nameplate capacity.
In its first full quarter of commercial production in Q4, cash costs at TZ were $577/oz and AISC was $862/oz. For the full year, cash costs were $668/oz and AISC was $972/oz.
Annual owner-operated mining costs averaged $2.31/t mined ($2.85/t in Q4), while processing costs were $10.02/t milled ($10.14/t in Q4). General and administrative expenses averaged $7.29/t milled for the year, and lowered to $6.62/t in Q4. As the operation continues to ramp up toward nameplate capacity, unit G&A costs are expected to decline due to the fixed nature of a significant portion of these expenses.
| Q4 2024 | FY 2024 | ||
| In thousands of $, except as otherwise noted | |||
| Operating Expenses | $ | 19,327 | 33,698 |
| Royalties | $ | 3,732 | 4,439 |
| Total Cash Costs | $ | 23,059 | 38,137 |
| Plus: Sustaining Capital and ARO (8) | $ | 7,517 | 10,768 |
| Site Level AISC | $ | 30,576 | 48,905 |
| Plus: General and Administrative Costs | $ | 3,865 | 6,561 |
| Total AISC2 | $ | 34,441 | 55,466 |
| Total Cash Costs | $/oz sold | 577 | 668 |
| Site Level AISC | $/oz sold | 765 | 857 |
| Total AISC2 | $/oz sold | 862 | 972 |
| Mining Costs | $/t mined | 2.85 | 2.31 |
| Processing Costs | $/t milled | 10.14 | 10.02 |
| G&A Costs | $/t milled | 6.62 | 7.29 |
TZ is a major employer of local workforce, with 67% of the ~1,000 employees and contractors coming from local communities, and 97% Brazilians.
Oko West Project Highlights
In July 2024, GMIN completed the business combination with Reunion Gold to acquire the high-quality Oko West gold project located in Guyana. In September 2024, GMIN reported results from a positive Preliminary Economic Assessment on Oko West, demonstrating after-tax Net Present Value (5%) of $1.4 billion, Internal Rate of Return of 21% and a payback period of 3.8 years using a $1,950/oz base case gold price. The average annual gold production is estimated to be 353,000 ounces at an AISC of $986/oz over a 12.7-year mine life. The initial capital cost is estimated to be $936 million, with sustaining capital costs of $537 million over the life of mine (see news release dated September 9, 2024).
During 2024, a 49,000m definition drilling program was completed at Oko West in support of the upcoming Feasibility Study. Additionally, a new regional exploration drilling program began at Oko West to investigate structures identified through geophysics and geochemical soil anomalies.
The Environmental Impact Assessment and Environmental Impact Statement submissions (jointly, for Oko West were made to the Guyana Environmental Protection Agency in November 2024.
After receiving an Interim Environmental Permit on Oko West from EPA in January 2025, GMIN announced the commencement of early works construction in March 2025. Site preparation activities are in progress for the barge landing on the Cuyuní River and the permanent camp area, which are key initial infrastructures to support future development.
Gurupi Project Highlights
GMIN closed the acquisition of tenements in the Gurupi Gold Belt from a wholly owned subsidiaries of BHP in December 2024. In February 2025, GMIN announced an updated National Instrument 43-101 compliant mineral resource estimate, totaling 1.83 Moz of indicated resources grading 1.31 g/t Au and 0.77 Moz of inferred resources grading 1.29 g/t Au (see news release dated February 20, 2025).
2025 Outlook
GMIN released 2025 guidance on January 21, 2025, including production, total cash costs, AISC, as well as sustaining and non-sustaining capital expenditures. The following table summarizes 2025 guidance:
| Operational & Cost Guidance | 2025 | |
| TZ Mine | ||
| Gold Production | k oz | 175 to 200 |
| Total Cash Costs | $/oz Au sold | $590 to $655 |
| AISC2 | $/oz Au sold | $995 to $1,125 |
| Sustaining Capital Expenditures | ||
| Sustaining | M$ | $35 to $45 |
| Near-mine exploration | M$ | $2 |
| Capitalized Waste Stripping | M$ | $23 |
| Total Sustaining | M$ | $60 to $70 |
| Non-Sustaining Capital Expenditures | ||
| TZ Regional Exploration | M$ | $9 |
| Oko West Exploration | M$ | $8 |
| Oko West Project | M$ | $200 to $240 |
| Gurupi | M$ | $2 to $4 |
| Total Non-Sustaining | M$ | $219 to $261 |
| Note: Guidance assumes a realized gold price of $2,350 and BRL/USD of 5.25 |
2025 Catalysts
Over 2025, the Corporation will focus on the following activities:
Qualified Person
Louis-Pierre Gignac, President & Chief Executive Officer of GMIN, a QP as defined in NI 43-101, has reviewed the press release on behalf of the Corporation and has approved the technical disclosure contained in this press release.
About G Mining Ventures Corp.
G Mining Ventures Corp. is a mining company engaged in the acquisition, exploration and development of precious metal projects to capitalize on the value uplift from successful mine development. GMIN is well-positioned to grow into the next mid-tier precious metals producer by leveraging strong access to capital and proven development expertise. GMIN is currently anchored by the Tocantinzinho Mine in Brazil, supported by the Gurupi Project in Brazil and the Oko West Project in Guyana — all with significant exploration upside and located in mining-friendly jurisdictions.
Consolidated Statements of Financial Position
(Tabular amounts expressed in Thousands of United States Dollars)
| December 31, 2024 | December 31, 2023 | ||
| Assets | $ | $ | |
| Current | |||
| Cash and Cash Equivalents | 141,215 | 52,398 | |
| Receivables and Other Current Assets | 5,155 | 1,788 | |
| Inventories | 37,588 | 7,967 | |
| Prepaid Expenses and Deposits | 2,640 | 1,270 | |
| 186,598 | 63,423 | ||
| Non-current | |||
| Deferred Financing Fees | 743 | 3,359 | |
| Inventories | 21,183 | – | |
| Long Term Deposits on Equipment | 876 | 10,402 | |
| Property, Plant & Equipment and Mineral Property | 498,105 | 503,663 | |
| Intangible Assets | 31,146 | – | |
| Exploration and Evaluation Assets | 702,336 | 4,537 | |
| Investment in Associate | 3,546 | – | |
| Other Non-current Assets | 28,976 | – | |
| 1,473,509 | 587,705 | ||
| Liabilities | |||
| Current | |||
| Accounts Payable and Accrued Liabilities | 25,065 | 27,030 | |
| Deferred Consideration Payable | 60,000 | – | |
| Current Portion of Contract Liability | 36,197 | 14,549 | |
| Current Portion of Lease Liability | 104 | 74 | |
| Current Portion of Long-term Debt | 24,572 | 7,515 | |
| Derivative Warrant Liability | – | 4,235 | |
| 145,938 | 53,403 | ||
| Non-current | |||
| Long-term Contract Liability | 220,426 | 240,783 | |
| Long-term Debt | 89,182 | 24,828 | |
| Long-term Liability | – | 1,298 | |
| Long-term Lease Liability | 902 | 241 | |
| Deferred Tax Liability | 3,407 | – | |
| Rehabilitation Provision | 2,976 | 4,113 | |
| 316,893 | 271,263 | ||
| Shareholders’ Equity | |||
| Share Capital | 1,082,691 | 247,870 | |
| Share-based Payments Reserve | 19,433 | 4,143 | |
| Accumulated Other Comprehensive Income (Loss) | (140,275) | 24,083 | |
| Retained Earnings (Deficit) | 48,829 | (13,057) | |
| 1,010,678 | 263,039 | ||
| 1,473,509 | 587,705 | ||
|
Refers to Q4 2024 Financial Statements for accompanying notes |
Consolidated Statements of Income (Loss)
(Tabular amounts expressed in Thousands of United States Dollars, except for number of shares)
| Years Ended December 31, | ||||
| 2024 | 2023 | |||
| $ | $ | |||
| Revenue | 145,251 | – | ||
| Cost of Goods Sold | (57,820) | – | ||
| Income From Mining Operations | 87,431 | – | ||
| Other Expenses | ||||
| General & Administration Expenses | 11,346 | 7,554 | ||
| Finance Expense | 8,379 | – | ||
| Change in Fair Value of Financial Instruments | 6,026 | 2,387 | ||
| Other Income | (3,752) | (2,761) | ||
| 21,999 | 7,180 | |||
| Income (Loss) Before Income Tax | 65,432 | (7,180) | ||
| Deferred Income Tax Expense | (3,427) | – | ||
| Net Income (Loss) for the Year | 62,005 | (7,180) | ||
| Net Income (Loss) per Share | ||||
| Basic | 0.38 | (0.06) | ||
| Diluted | 0.37 | (0.06) | ||
| Weighted Average Number of Common Share | ||||
| Basic | 162,476,725 | 111,888,901 | ||
| Diluted | 165,527,040 | 111,888,901 | ||
|
Refers to Q4 2024 Financial Statements for accompanying notes |
||||
Consolidated Statements of Cash Flows
(Tabular amounts expressed in Thousands of United States Dollars)
| Years Ended December 31, | |||||
| 2024 | 2023 | ||||
| Operating Activities | $ | $ | |||
| Net Income (Loss) for the Year | 62,005 | (7,180) | |||
| Items Not Involving Cash | |||||
| Depreciation | 20,182 | 90 | |||
| Share-based Compensation | 1,665 | 1,714 | |||
| Unrealized Foreign Exchange Loss (Gain) | (374) | 140 | |||
| Deferred Income Tax Expense | 3,427 | – | |||
| Standby Fees | 26 | 937 | |||
| Gain on Ownership Dilution | (1,462) | – | |||
| Share of Loss of Investment in Associate | 161 | – | |||
| Cumulative Catch-up Adjustment on Gold Streaming Agreement | 436 | – | |||
| Depletion of Gold Streaming Agreement Deposit | (9,524) | – | |||
| Finance Expense | 8,219 | – | |||
| Change in Fair Value of Financial Instruments | 6,033 | 2,403 | |||
| Accretion Expense of Rehabilitation Provision | 519 | 260 | |||
| 91,313 | (1,636) | ||||
| Proceeds from the Gold Streaming Agreement | – | 250,000 | |||
| Change in Non-Cash Working Capital | |||||
| Receivables and Other Current Assets | (1,966) | (406) | |||
| Inventories | (57,874) | (7,179) | |||
| Prepaid Expenses and Deposits | (1,519) | (837) | |||
| Accounts Payable and Accrued Liabilities | (1,864) | (923) | |||
| Lease liability | 402 | – | |||
| Cash Provided by Operating Activities | 28,492 | 239,019 | |||
| Investing Activities | |||||
| Acquisition of Reunion Gold, net of Cash Acquired | 21,067 | – | |||
| Acquisition of Gurupi, net of Cash Acquired | 366 | – | |||
| Other Non-Current Assets | (1,298) | – | |||
| Additions of PP&E and Mineral Property, net of Long-term Deposit | (110,561) | (300,515) | |||
| Proceeds on Disposal of PP&E and Mineral Property | – | 14 | |||
| Exploration and Evaluation Expenditures | (29,400) | (4,148) | |||
| Cash Used in Investing Activities | (119,826) | (304,649) | |||
| Financing Activities | |||||
| Shares Issued for Cash | 50,000 | – | |||
| Share Issue Cost | (249) | – | |||
| Replacement Options Exercised | 2,435 | – | |||
| Repayment of Lease Liability | (77) | (32) | |||
| Repayment of Long-term Debt | (12,464) | (3,920) | |||
| Deferred Financing Fees | 163 | (210) | |||
| Net Proceeds from the Drawdowns of Long-term Debt | 84,111 | 35,191 | |||
| Proceeds From the Exercise of Warrants | 66,311 | 20 | |||
| Proceeds From the Exercise of Options | 78 | – | |||
| Cash Provided by Financing Activities | 190,308 | 31,049 | |||
| Effect on Foreign Exchange Rate Differences on Cash and Cash Equivalents | (10,157) | 5,087 | |||
| Increase (Decrease) in Cash and Cash Equivalents | 88,817 | (29,494) | |||
| Cash and Cash Equivalents, Beginning of the Year | 52,398 | 81,892 | |||
| Cash and Cash Equivalents, End of the Year | 141,215 | 52,398 | |||
| Refers to Q4 2024 Financial Statements for accompanying notes | |||||
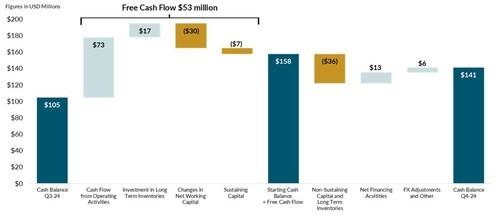
Figure 1: Cash Position Bridge for 3 months ended December 31, 2024 (CNW Group/G Mining Ventures Corp)
Hudbay Minerals Inc. (TSX:HBM) (NYSE: HBM) today released its ann... READ MORE
Strategic acquisition of an established operating gold mine, loca... READ MORE
Cerro de Pasco Resources Inc. (TSX-V: CDPR) (OTCQB: GPPRF) (FRA: ... READ MORE
The Garneau Titanium Project Features Ilmenite-Rich Boulder with ... READ MORE
ValOre Metals Corp. (TSX‐V: VO) (OTCQB: KVLQF) (Frankfurt: KEQ0... READ MORE


