
G Mining Ventures Delivers PEA for High-Grade Oko West Gold Project in Guyana

All amounts are in USD unless stated otherwise
- After-tax NPV5% of $1.4 billion, IRR of 21% and payback of 3.8 years at $1,950/oz base case gold price (long-term consensus)
- After-tax NPV5% of $2.5 billion, IRR of 31% and payback of 2.0 years at $2,500/oz spot gold price
- Average annual gold production of 353,000 ounces at an AISC of $986/oz for 12.7 years
- Startup capital cost of $936 million and sustaining capital of $537 million over the life of mine
- ESIA submission targeted by year end while progressing towards a Feasibility Study for Q1-2025
- An average of 1,260 direct permanent jobs to be created from the Oko West Project
G Mining Ventures Corp. (TSX: GMIN) (OTCQX: GMINF) is pleased to announce the results of its 2024 Preliminary Economic Assessment Study for the development of its wholly owned Oko West Gold Project, located in Guyana.
The PEA, completed by G Mining Services Inc. as lead consultant, supported by other engineering consultants, confirms robust economics for a low-cost, large-scale, conventional open pit and underground mining and milling operation, with operating costs below industry averages, in addition to a high rate of return. The Project is ideally sequenced to leverage the strong macroeconomic conditions including a strong gold price, lower inflation, and Guyana’s rapidly developing economy.
Louis-Pierre Gignac, President & Chief Executive Officer, commented: “The Oko PEA, based on the long-term consensus gold price of $1,950 per ounce, outlines a high-production, long-life, high-margin operation with an after-tax NPV5% of $1.4 billion and IRR of 21%. Oko is ideally sequenced to benefit from GMIN’s regional footprint, development expertise, anticipated free cashflow from our in-production Tocantinzinho Gold Mine in Brazil and historically high gold prices. GMIN announced last week commercial production at Tocantinzinho, delivering our first operating mine on-time and on-budget, and we will seek to repeat this success with Oko using essentially the same team. I am excited that this exceptionally positive PEA only captures a snapshot of the potential value of Oko, as we continue to explore the prospective land package and evaluate value-enhancement opportunities for improved economics in a feasibility study planned for the first quarter of 2025. I look forward to the tremendous shared-value creation for our stakeholders, including the country of Guyana.”
PEA Overview
Oko is planned as a mix of conventional OP mine and mechanized long hole open stoping UG mine, with on-site treatment of the mined material processed through a conventional circuit consisting of comminution, gravity concentration, cyanide leach and adsorption via carbon-in-leach, carbon elution and gold recovery circuits. The OP mine will have a Life of Mine of 15 years, including 2 years of pre-stripping, from 4 pit phases, while the UG mine will have a LOM of 13 years, including 2 years of development, in 3 zones. The mill will operate for 13 years.
The PEA is derived using the Corporation’s mineral resource estimate effective as at February 7, 2024. The effective date of the PEA is September 4, 2024, and a NI 43-101 compliant technical report will be filed on the Corporation’s website and under its SEDAR+ profile within 45 days of this news release.
Table 1: Oko West Preliminary Economic Assessment Highlights
| Description | Units | Figure |
| Production Data | ||
| OP Mill Feed Tonnage | Mt | 61 |
| UG Mill Feed Tonnage | Mt | 15 |
| Total Mineralized Material Mined | Mt | 75 |
| Total Waste Mined (OP and UG) | Mt | 367 |
| Total Tonnage Mined (OP and UG) | Mt | 443 |
| Strip Ratio | waste : mineralized material | 6.0 |
| Average Milling Throughput | Mt/year | 6.0 |
| Average Milling Throughput | tpd | 16,110 |
| Gold Head Grade | g/t | 2.00 |
| OP Head Grade | g/t | 1.72 |
| UG Head Grade | g/t | 3.19 |
| Contained Gold | koz | 4,848 |
| Average Recovery | % | 92.8 % |
| Total Gold Production | koz | 4,500 |
| Mine Life | years | 12.7 |
| Average Annual Gold Production | oz | 353,000 |
| Operating Costs (Average LOM) | ||
| Total Site Costs | USD/oz | $728 |
| Government Royalties | USD/oz | $126 |
| Total Operating Cost | USD/oz | $853 |
| AISC | USD/oz | $986 |
| Capital Costs | ||
| Total Upfront Capital Cost | USD MM | $936 |
| Initial UG Capital Costs (Sustaining Capital) | USD MM | $124 |
| OP and UG Sustaining Capital | USD MM | $413 |
| Life of Mine Sustaining Capital | USD MM | $537 |
| Closure Costs | USD MM | $37 |
| Total Capital Costs | USD MM | $1,510 |
| Financial Evaluation | ||
| Gold Price Assumption | USD/oz | $1,950 |
| After-Tax NPV 5% | USD MM | $1,367 |
| After-Tax IRR | % | 21 % |
| Payback | Years | 3.8 |
Table 2: Sensitivity Analysis
| Downside | Base | Spot | ||
| Scenario | Case | Case | Case | |
| Gold Price | USD/oz
USD MM |
$1,600 | $1,950 | $2,500 |
| After Tax NPV5% | $639 | $1,367 | $2,502 | |
| Payback | Years | 5.9 Years | 3.8 Years | 2.0 Years |
| After-Tax IRR | % | 13 % | 21 % | 31 % |
| Average Annual EBITDA | USD MM | $264 | $376 | $554 |
| Average Annual Free Cash Flow | USD MM | $188 | $272 | $406 |
| LOM EBITDA | USD MM | $3,452 | $4,924 | $7,238 |
| LOM Free Cash Flow | USD MM | $1,475 | $2,584 | $4,325 |
| Note: Average annual figures represent the 12.7-year operating period. |
Table 3: Sensitivity Analysis cont’d
| After Tax | Average Annual | ||||
| Gold Price | NPV5% | IRR | Payback | EBITDA | FCF |
| (USD/oz) | (USD M) | ( %) | (years) | (USD M) | (USD M) |
| $1,300 | ($4) | 5 % | 10.4 | $167 | $115 |
| $1,400 | $214 | 8 % | 8.3 | $199 | $139 |
| $1,500 | $427 | 10 % | 6.9 | $231 | $163 |
| $1,600 | $639 | 13 % | 5.9 | $264 | $188 |
| $1,700 | $849 | 15 % | 5.2 | $296 | $212 |
| $1,800 | $1,057 | 18 % | 4.5 | $328 | $236 |
| $1,900 | $1,264 | 20 % | 4.0 | $360 | $260 |
| $1,950 | $1,367 | 21 % | 3.8 | $376 | $272 |
| $2,000 | $1,471 | 22 % | 3.6 | $392 | $285 |
| $2,100 | $1,677 | 24 % | 3.3 | $425 | $309 |
| $2,200 | $1,883 | 26 % | 3.0 | $457 | $333 |
| $2,300 | $2,090 | 27 % | 2.0 | $489 | $357 |
| $2,400 | $2,296 | 29 % | 2.0 | $521 | $382 |
| $2,500 | $2,502 | 31 % | 2.0 | $554 | $406 |
| $2,600 | $2,708 | 33 % | 2.0 | $586 | $430 |
| Note: Average annual figures represent the 12.7-year operating period. |
Property Description, Location and Access
Oko is an advanced-stage gold development project, which straddles the Cuyuni-Mazaruni Mining Districts (administrative Region 7) in north central Guyana, South America. The Project is located approximately 100 kilometres (“km”) southwest of Georgetown, the capital city of Guyana and approximately 70 km from Bartica, the capital city of Region 7 (Figure 2). The Project comprises one Prospecting Licence (“PL”) issued to Reunion Gold Inc., GMIN’s indirect 100%-owned Guyanese subsidiary, on September 23, 2022. The PL is valid for three years and is renewable for up to two years. The PL has a surface area of approximately 10,890 acres (4,407 hectares).
In March 2024, an option agreement was entered into for the Northwest extension mining permits, consisting of three medium-scale mining permits adjacent to the PL. That agreement is valid for five years with a possible two-year extension. In August 2024, another agreement was concluded to purchase additional MPMS from a private group of individuals for the Eastern and Southern extensions to the PL.
The Project can be accessed via numerous methods: helicopter direct from Ogle airport to the site, fixed-wing plane from Ogle airport to Bartica airstrip, or by car and then speedboat. From the town of Itabali at the confluence of the Cuyuni and Mazaruni rivers, one can use the Puruni or the Aremu laterite roads, using four-wheel drive vehicles. Bartica is accessible by a 20-minute direct flight from the Ogle airport in Georgetown or by road and boat from Parika on the Essequibo River. There are regular boat services between Bartica and Parika.
The climate is equatorial and humid. The Project has operated throughout the year without any interruptions related to the weather.
Mineral Resource Estimate
Measured and Indicated Mineral Resources total 64.6 million tonnes at an average gold grade of 2.05 grams per tonne for 4.27 million contained ounces of gold. Contained gold in the M&I category represents 73% of the global resource.
The MRE considers 397 diamond drill holes, 292 reverse circulation holes, and 59 trenches completed by Reunion Gold Corporation between December 2020 and January 2024.
Table 4: Mineral Resource Estimate
| Category | Tonnes
(kt) |
Gold Grade
(g/t) |
Contained Gold (koz) |
| Pit Constrained Resource | |||
| Indicated | 64,115 | 2.06 | 4,237 |
| Inferred | 8,107 | 1.87 | 488 |
| UG Constrained Resource | |||
| Indicated | 491 | 1.85 | 29 |
| Inferred | 11,510 | 3.01 | 1,116 |
| Total OP and UG | |||
| Indicated | 64,606 | 2.05 | 4,266 |
| Inferred | 19,617 | 2.54 | 1,603 |
| These Mineral Resources are not Mineral Reserves as they have not demonstrated economic viability. All figures are rounded to reflect the relative accuracy of the estimates. The lower cut-offs used to report open pit Mineral Resources are 0.30 g/t Au in saprolite and alluvium/colluvium, 0.313 g/t Au in transition, and 0.37 g/t Au in fresh rock. Underground Mineral Resources are reported inside potentially mineable volume and include below cut-off material (stope optimization cut-off grade of 1.38 g/t Au). A change in the reporting method for the underground part of the deposit explains the differences in tonnage and average grade between this PEA and the MRE published in February 2024. Tonnage of potentially mineable material stated below cut-off (i.e., must take material) is declared for this constrained underground Mineral Resource Estimate. Blocks have been reclassified inside each stope based on deposit knowledge and continuity and reflect the existing classification. No changes in total ounces is observed. The cut-off grades are based on a gold price of US$1,950 per troy ounce and show 96.0%, 95.0% and 92.5% processing recoveries for saprolite and alluvium/colluvium, transition and fresh rock, respectively. | |||
Production Profile
The PEA outlines an average annual gold production profile of 353 thousand ounces over the 12.7-year mine life. Total gold production is 4.5 million ounces with an average gold grade milled of 2.00 g/t Au, and metallurgical recovery of 92.8%.
The processing feed will be supplied by the open pit during the initial three years of commercial production. Starting in the fourth year of production, underground mining will contribute a significant tonnage of mineralized material.
Table 5: Gold Production by Mil Feed Type
| Open Pit | Underground | Total OP + UG | |||||||
| Material | Grade | Contained | Material | Grade | Contained | Contained | Gold | ||
| Milled | Milled | Gold | Milled | Milled | Gold | Gold | Recovery | Recovered | |
| Year | (kt) | (g/t) | (koz) | (kt) | (g/t) | (koz) | (koz) | ( %) | (koz) |
| Year 1 | 6,368 | 1.63 | 334 | 40 | 1.97 | 3 | 336 | 94 % | 317 |
| Year 2 | 6,933 | 1.54 | 343 | 67 | 2.09 | 4 | 348 | 93 % | 324 |
| Year 3 | 6,714 | 1.58 | 340 | 286 | 2.63 | 24 | 365 | 93 % | 339 |
| Year 4 | 6,054 | 1.41 | 275 | 946 | 2.39 | 73 | 347 | 94 % | 325 |
| Year 5 | 4,655 | 1.46 | 219 | 1,345 | 3.18 | 138 | 357 | 93 % | 330 |
| Year 6 | 4,405 | 1.51 | 213 | 1,595 | 3.43 | 176 | 389 | 93 % | 361 |
| Year 7 | 4,432 | 1.46 | 208 | 1,568 | 3.16 | 159 | 368 | 93 % | 340 |
| Year 8 | 4,260 | 1.86 | 255 | 1,562 | 3.19 | 160 | 416 | 93 % | 385 |
| Year 9 | 3,455 | 1.72 | 192 | 1,545 | 3.08 | 153 | 344 | 93 % | 319 |
| Year 10 | 3,489 | 1.90 | 213 | 1,511 | 2.96 | 144 | 357 | 93 % | 331 |
| Year 11 | 3,518 | 2.31 | 261 | 1,482 | 3.37 | 161 | 422 | 93 % | 390 |
| Year 12 | 3,572 | 2.23 | 256 | 1,428 | 3.45 | 158 | 415 | 93 % | 384 |
| Year 13 | 2,406 | 3.04 | 235 | 1,125 | 3.66 | 132 | 367 | 93 % | 340 |
| Total | 60,261 | 1.72 | 3,345 | 14,501 | 3.19 | 1,485 | 4,831 | 93 % | 4,484 |
Mining
The Project is planned as a mining operation that integrates both conventional open pit mining and mechanized long hole open stoping for the underground mine.
The main OP is centered on Block 4 with two smaller sub-pits positioned on the northern and southern extensions to the main pit. A total of 60.7 Mt of mineralized material will be mined from the OP at an average diluted gold grade of 1.72 g/t Au. 0.4 Mt of this material will be milled during the pre-production period. A total of 364.6 Mt of combined waste and overburden will be extracted, resulting in a strip ratio of 6.0x. The OP operation will be executed in 4 phases over 15 years, including 2 years of pre-production, with an owner-operated mining fleet.
The UG operation will take place in three zones: the main zone and two satellite zones, all accessible from a surface mine portal through the same main decline ramp. Long hole open stoping mining method will be used, including transverse stoping and longitudinal stoping variations. The average UG production rate is expected to be 4,250 tonnes per day of mineralized material, with 4,000 tpd and 250 tpd from stope production and lateral development, respectively. A total of 14.5 Mt of mineralized material is expected to be mined at an average diluted gold grade of 3.19 g/t Au. The UG mine is expected to be in production for 13 years, including a two-year development period. The initial 2 years of construction and development will use contract mining and transition to owner-operated mining thereafter.
Processing and Recovery
The proposed process plant design for Oko is based on a standard metallurgical flowsheet to treat gold bearing material and produce doré. The process plant is designed to nominally treat 6.0 Mtpy of fresh rock and will consist of comminution, gravity concentration, cyanide leach and adsorption via carbon-in-leach carbon elution and gold recovery circuits. CIL tailings will be treated in a cyanide destruction circuit and pumped to a tailings storage facility.
The milling rate is initially set at 6.0 million tonnes per annum for hard rock but will be increased to 7.0 Mtpa when saprolite and transition materials are added. During the open pit operational period, the ramp-up period is 5 months. The mill will operate for 13 years.
Select key design criteria include crushing plant availability of 70%; grinding, gravity, CIL, gold recovery and tailings handling circuit availability of 92% through the use of standby equipment in critical areas, inline crushed material stockpile and reliable power supply; comminution circuit to produce a primary grind size of (P80) 80% passing 75 µm; and CIL residence time of 48 hours to achieve optimal gold extraction.
Table 6: Metallurgical Recoveries
| Feed | Total | Mill | |
| Feed Material | Grade | Recovery | Feed |
| Saprolite | 1.40 | 96 % | 10 % |
| Transition | 1.47 | 95 % | 5 % |
| Fresh Rock | 2.11 | 93 % | 85 % |
| Total LOM | 2.00 | 93 % | 100 % |
Power
Plant site activities, including the process plant, UG mining, OP mine, and balance of plant infrastructure, will require an average of 37 megawatts at full operation. The plant’s full power consumption was benchmarked against similar projects, with OP mining and UG mining adjusted for processing throughputs.
The Project’s base case scenario considers installing a dedicated Heavy Fuel Oil fired power plant. The power plant is anticipated to comprise six 9.4 MW engine generating sets, totaling 56.4 MW installed capacity and 42.3 MW running capacity. This assumes that one of the generators would be on standby. One additional genset is planned in sustaining capital to allow for maintenance activities.
Alternative power supplies will be studied as part of the Feasibility Study, including using liquefied natural gas (“LNG”) power plant.
Environmental and Permitting
Between 2022 and 2024, comprehensive physical, biological, and social baseline studies were conducted to support Project planning, including environmental assessments during both dry and wet seasons. These studies aim to identify potential concerns and recommend actions for effective Project design and regulatory compliance. The Project area is not a priority conservation site and does not overlap with any protected or Indigenous lands. Ongoing data collection will help refine Project design, identify potential environmental and social impacts, and contribute to the submission of an Environmental Impact Assessment. Future studies will also address additional project components such as power supply and road access.
The permitting process for the Oko involves obtaining environmental authorization from Guyana’s Environmental Protection Agency following the submission and approval of an EIA, which GMIN expects to file by year end 2024. Exploration activities are conducted under a previously received no-objection letter from the EPA.
The necessary permits covering the construction of the mine, processing plant, transmission line, port, HFO power generation, and access road, will be issued after the EPA’s review, which GMIN anticipates may take approximately six months after submission of the EIA. GMIN’s permitting activities will be guided by ongoing stakeholder engagement and government consultations, ensuring compliance with environmental and social international standards.
Operating Costs
LOM operating costs are estimated at $728 per ounce of gold produced, excluding royalty costs, as summarized below. The LOM AISC is estimated to be $986 per ounce of gold produced based on average annual gold production of 353,000 ounces over the 12.7 years of mine life. The cost structure places the Project in the bottom quartile of the global gold cost curve.
Table 7: Operating Cost and AISC Summary
| Costs | Unit Cost | Unit Cost |
| (USD/t milled) | (USD/oz) | |
| Mining Costs – OP | $13.13 | $219 |
| Mining Costs – UG | $10.76 | $179 |
| Rehandle Costs | $0.15 | $2 |
| Processing Costs | $9.04 | $151 |
| Power Costs | $5.93 | $99 |
| G&A Costs | $4.14 | $69 |
| Transport & Refining | $0.48 | $8 |
| Total Site Cost | $43.62 | $728 |
| Royalty Costs | $7.53 | $126 |
| Total Operating Costs | $51.15 | $853 |
| Sustaining Capex | $7.19 | $120 |
| Closure Costs | $0.49 | $8 |
| Land Payments | $0.30 | $5 |
| All-in Sustaining Costs (“AISC”) | $59.13 | $986 |
| Note: Total Cash Costs and AISC are non-GAAP measures and include royalties payable. |
Project Royalties
The PEA considers two federal government royalties:
- Underground Royalty: 3.0% of net smelter return of the mineral product.
- Open Pit Royalty: 8.0% of net smelter return of the mineral product.
The production profile results in a blended royalty rate of 6.5%.
Capital Cost Estimates
The initial capital cost is estimated to be $936 million after accounting for $29 million in pre-production credits. A 12% contingency totaling $100 million is included in the estimate. Underground-related capex is captured in sustaining capex, with ramp development to initiate in Year 1 of operations.
The total construction period, including the early works program, is forecast to be 28 months.
Table 8: Capital Cost Summary
| Initial CAPEX | USD M |
| 100 – Infrastructure | $71 |
| 200 – Power & Electrical | $118 |
| 300 – Water Management | $16 |
| 400 – Surface Operations | $46 |
| 500 – Mining | $129 |
| 600 – Process Plant | $190 |
| 700 – Construction Indirects | $107 |
| 800 – General Services / Owner’s Costs | $111 |
| 900 – Pre-Production, Start-up & Commissioning | $76 |
| 990 – Contingency (12%) | $100 |
| Capital Costs | $965 |
| Less: Pre-Prod. Credit net of TC/RC & Royalties | ($29) |
| Total Capital Costs | $936 |
The sustaining capex is estimated to be $574 million, including $37 million of closure and rehabilitation costs, split between open pit and underground operations. Open pit sustaining capex is earmarked for additional equipment, replacement units, and major repairs. Other sustaining capex captures tailings storage facility raises, process plant, power plant expansion, and G&A.
Table 9: Sustaining Cost Summary
| Sustaining Capex | USD M | USD/oz |
| Open Pit | $216 | $48 |
| Underground (Initial capex) | $124 | $28 |
| Underground | $133 | $30 |
| Other | $64 | $14 |
| Sustaining Capex | $537 | $120 |
| Closure & Rehabilitation | $37 | $8 |
| Total Sustaining Capex | $574 | $128 |
UG sustaining capex totals $257 million and includes lateral and vertical development of the mine, mobile equipment, fixed equipment, construction, and pre-production. The initial 2 years of construction and development total $124 million (48% of total UG sustaining capex). The table below sets out more details on the underground portion of the sustaining capex.
Table 10: Underground Sustaining Cost Summary
| Underground Sustaining Capex | USD M |
| Lateral Development | $97 |
| Mobile Equipment UG | $63 |
| Construction UG | $29 |
| Pre-Production UG | $26 |
| Vertical Development | $13 |
| Fixed Equipment UG | $12 |
| Mobile Equipment UG Rebuild | $11 |
| Other Equipment UG | $5 |
| Total Underground Sustaining Capex | $257 |
Project Timetable and Next Steps
Corporate Timetable and Next Steps
Upcoming key milestones include:
- Q4-2024: Oko Exploration results
- Q4-2024: Tocantinzinho Gold Mine exploration results
- Q1-2025: TZ nameplate capacity
- Q1-2025: Oko Feasibility Study
- H1-2025: Oko Early Works and Construction Decision
- H2-2027: Oko Commissioning
- H1-2028: Oko Commercial Production
Preliminary Economic Assessment Study 3D VRIFY Presentation
To view a 3D VRIFY presentation of the Study please click on the following link: https://vrify.com/decks/16400 or visit the Corporation’s website at www.gmin.gold.
Updated corporate presentation is available at: https://vrify.com/decks/14338.
Technical Report Preparation and Qualified Persons
The Study has an effective date of September 4, 2024 and was issued on September 9, 2024. It was authored by independent Qualified Persons and is in accordance with National Instrument 43-101 – Standards of Disclosure for Mineral Projects.
GMS was responsible for the overall report and PEA coordination, property description and location, accessibility, history, mineral processing and metallurgical testing, mineral resource estimation, mining methods, recovery methods, project infrastructures, operating costs, capex, economic analysis and project execution plan. For readers to fully understand the information in this news release, they should read the technical report in its entirety, including all qualifications, assumptions, exclusions and risks. The technical report is intended to be read as a whole and sections should not be read or relied upon out of context.
The Qualified Persons are Paul Murphy, P. Eng. having overall responsibility for the Report including capital and operating costs. Neil Lincoln, P. Eng. having responsibility for metallurgy, recovery methods and process plant operating costs. Christian Beaulieu, MSc, PGeo, of Minéralis Consulting Services is responsible for property description, geology, drilling, sampling and the mineral resource estimate. Alexandre Burelle, P. Eng. is responsible for the mining method and capital and operating costs related to the mine and the economic analysis. Derek Chubb, P. Eng., of ERM Consultants Canada Ltd., is responsible for the environment and permitting aspects.
The technical content of this press release has been reviewed and approved by the QPs who were involved with preparation of the Study. In addition, Louis-Pierre Gignac, President & Chief Executive Officer of GMIN, a QP as defined in NI 43-101, has reviewed the Study on behalf of the Corporation and has approved the technical disclosure contained in this news release. The PEA is summarized into a technical report that is filed on the Corporation’s website at www.gmin.gold and on SEDAR+ at www.sedar.com in accordance with NI 43-101.
About G Mining Ventures Corp.
G Mining Ventures Corp. is a mining company engaged in the acquisition, exploration and development of precious metal projects to capitalize on the value uplift from successful mine development. GMIN is well-positioned to grow into the next mid-tier precious metals producer by leveraging strong access to capital and proven development expertise. GMIN is currently anchored by the Tocantinzinho Gold Mine in Brazil and Oko West Project in Guyana, both mining friendly and prospective jurisdictions.
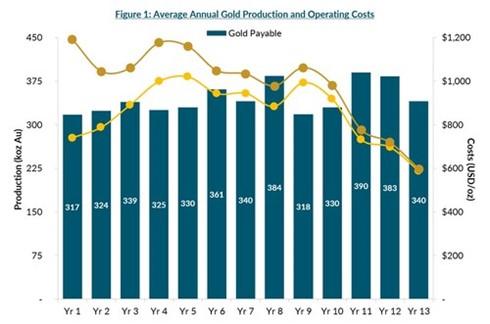
Figure 1: Average Annual Gold Production and Operating Costs (CNW Group/G Mining Ventures Corp)
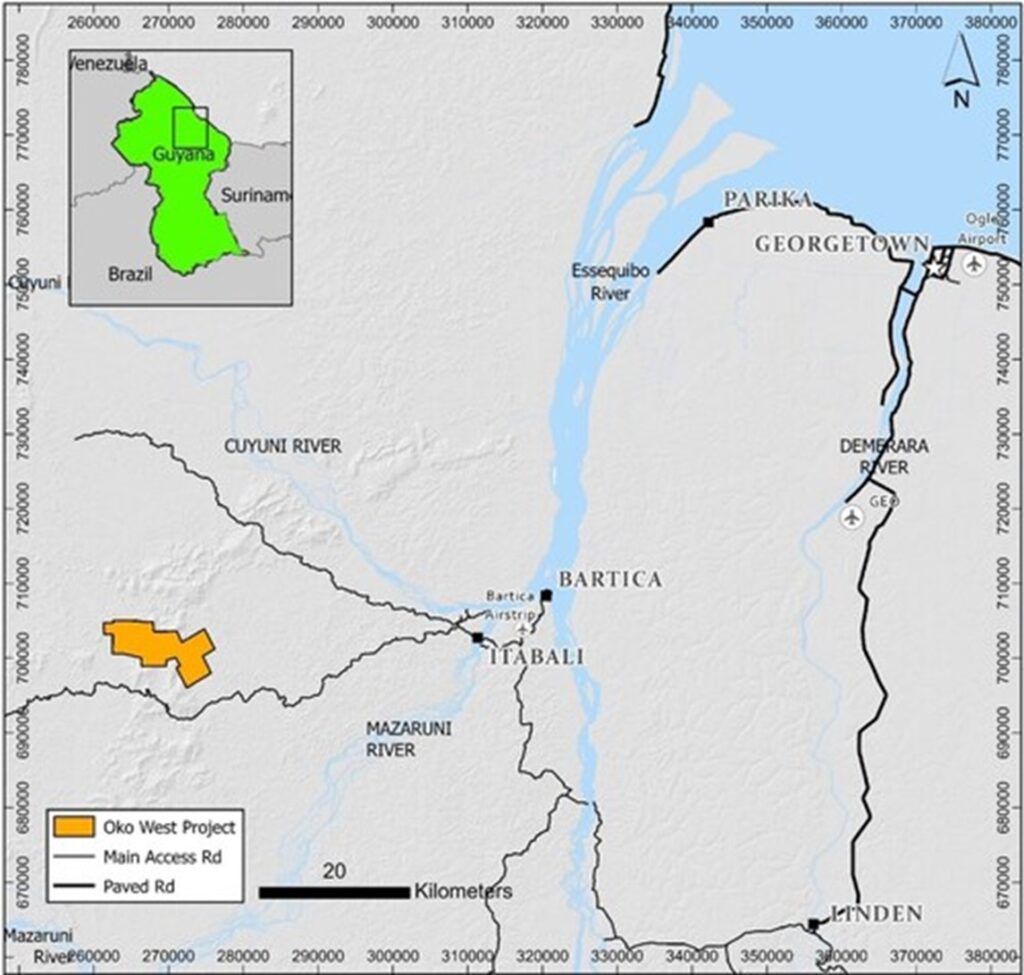
Figure 2: Project Location Map (CNW Group/G Mining Ventures Corp)
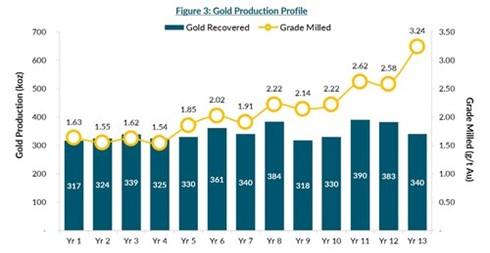
Figure 3: Gold Production Profile (CNW Group/G Mining Ventures Corp)
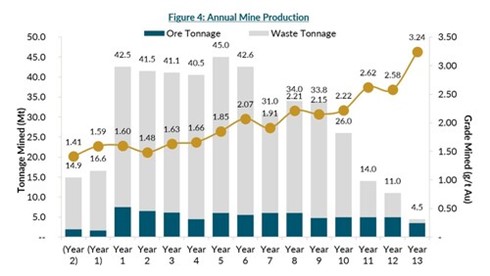
Figure 4: Annual Mine Production (CNW Group/G Mining Ventures Corp)
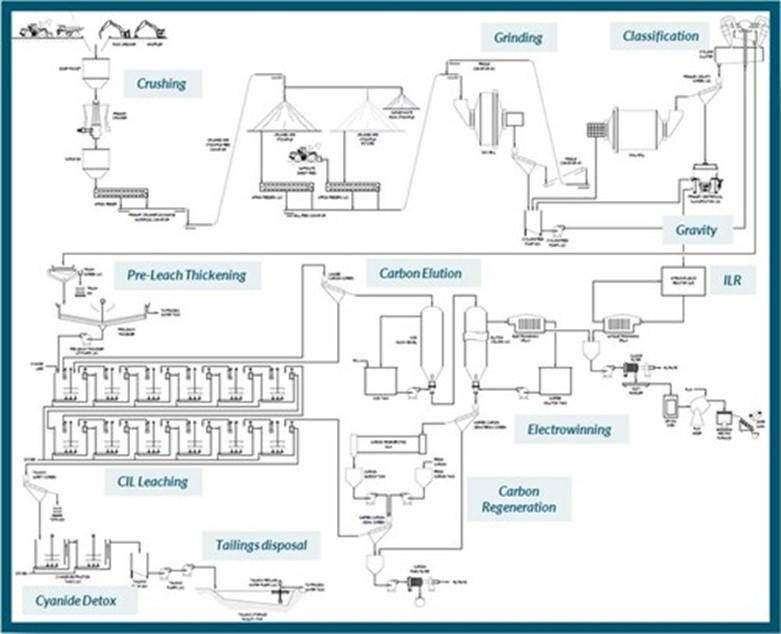
Figure 5: Process Flowsheet (CNW Group/G Mining Ventures Corp)
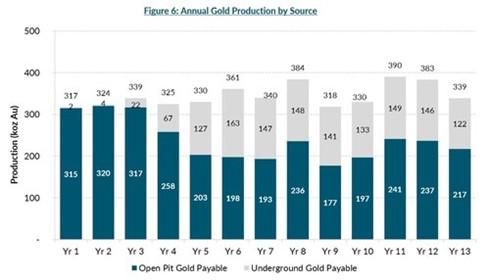
Figure 6: Annual Gold Production by Source (CNW Group/G Mining Ventures Corp)
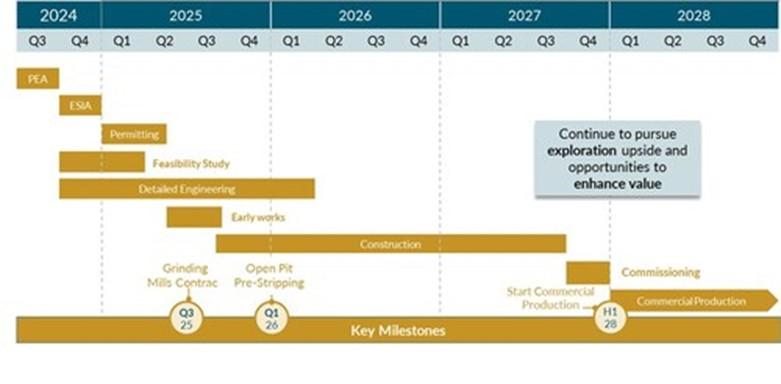
Figure 7: Project Schedule (CNW Group/G Mining Ventures Corp)
MORE or "UNCATEGORIZED"
Great Pacific Gold Announces Closing of Upsized $16.9 Million Private Placement Financing Led by Canaccord Genuity Corp
Great Pacific Gold Corp. (TSX-V: GPAC) (OTCQX: FSXLF) (FSE: V3H)... READ MORE
Ridgeline Minerals Provides Assay Results and Drill Program Updates for the Big Blue and Atlas Projects
Big Blue highlights: 0.6 meters grading 0.7% Cu, 3,194 g/t Ag and... READ MORE
Goldshore Intersects 42.7m of 1.09 g/t Au at the Eastern QES Zone of the Moss Deposit
Goldshore Resources Inc. (TSX-V: GSHR) (OTCQB: GSHRF) (FSE: 8X00)... READ MORE
Dios Sells K2 to Azimut
Dios Exploration Inc. (TSX-V: DOS) is pleased to report it has e... READ MORE
Northisle Announces Near Surface Intercepts and Higher-Grade Intercepts at Depth at West Goodspeed on its North Island Project
Highlights: Recent drilling at West Goodspeed supports the presen... READ MORE


