


Average Annual Gold Production of 101 koz, After-Tax NPV5% of C$285M, and IRR of 35.2%
Highlights:
Fortune Bay Corp. (TSX-V: FOR) (FWB: 5QN) (OTCQX: FTBYF) is pleased to announce positive results from the independent Preliminary Economic Assessment for its 100% owned Goldfields Project located near Uranium City, Saskatchewan. The PEA provides a base case assessment for developing the Goldfields mineral resource by conventional open pit mining methods, and gold recovery with a standard free milling flowsheet, incorporating gravity and leaching of the gravity tails. The economic model supports an operation with low capital cost and high rate of return over an 8.3 year mine life, with average annual production of 101,000 ounces of gold. The PEA was prepared by Ausenco Engineering Canada Inc. in accordance with National Instrument 43-101 – Standards of Disclosure for Mineral Projects. The PEA NI-43-101 Technical Report will be filed on SEDAR (www.sedar.com) within 45 days of this News Release.
Dale Verran, CEO of Fortune Bay, commented, “Goldfields shows potential to become a highly profitable gold mine supported by a PEA produced by Ausenco, one of the most experienced and reputable engineering firms working on gold projects in Canada. Goldfields has now established itself as a leading gold development project in Saskatchewan, which is significant given it is the top-ranked mining jurisdiction in Canada and ranked number two globally. The PEA, based upon 99% of Indicated Mineral Resources, together with the substantial repository of project data, lays a solid foundation for the advancement of the Project.”
Mr. Verran, further commented, “The Project has numerous desirable attributes including a low strip ratio, simple mineralogy and free-milling gold. The robust PEA economics are highlighted by low initial capital costs, competitive all-in sustaining costs, a relatively short payback period and a favorable NPV:CAPEX ratio. In addition, the established infrastructure in a historical mining area, including a powerline to site, and a valid development permit is expected to facilitate the timeline towards construction and operations. The Project continues to present numerous opportunities, including exploration potential, and additional mining and processing opportunities to be further investigated during a pre-feasibility stage.”
Description of the Goldfields Project and PEA
The 100% owned Goldfields Project is located approximately 13 kilometres south of Uranium City in northern Saskatchewan, as shown in Figure 1. The Project comprises 12 mineral dispositions, covering approximately 5,000 hectares, and is host to the Box and Athona gold deposits and numerous other gold prospects and occurrences.
The Project is located within a historical mining area and benefits from established infrastructure, including a road and hydro-powerline to the Box deposit. Nearby facilities and services in Uranium City include bulk fuel, civil contractors, and a commercial airport. The Project has a history of gold production (64,000 oz produced between 1939 to 1942), numerous exploration drilling campaigns (over 1,000 drill holes) and historical mining studies by previous owners of the Project.
The current total gold resource for Box and Athona stands at 979,900 ounces of gold in the Indicated category (23.2 million tonnes at an average grade of 1.31 g/t gold) and 210,800 ounces of gold in the Inferred category (7.1 million tonnes at an average grade of 0.92 g/t gold), as defined in Table 8. The PEA considers conventional open-pit mining at both the Box and Athona gold deposits.
Ausenco was appointed as lead consultant in April 2022 to prepare the PEA in accordance with NI 43-101. The PEA was completed in collaboration with Moose Mountain Technical Services for the mine design, and SRK Consulting (Canada) Inc. for the updated Mineral Resource Estimate and Environmental, Permitting and Social aspects of the Project plan. The PEA comprised a Phase 1 Mine to Mill Optimization to determine the best business case for the Project, including social and environmental considerations, followed by a Phase 2 which included the PEA study based on a 7,500 tpd production case.
Financial Analysis
The economic analysis was performed assuming a 5% discount rate and a gold price of US$1,650 per ounce based on long-term consensus pricing. On a pre-tax basis, the NPV5% is C$401 million, the IRR is 45.5% and the payback period is 1.4 years. On an after-tax basis, the NPV5% is C$285 million, the IRR is 35.2% and the payback period is 1.7 years. A summary of the Project economics, and the projected annual gold production is provided in Table 1 and Figure 2, respectively.
Table 1: Summary of Project Economics
| Units | LOM Total / Avg. | |
| General | ||
| Gold Price | US$/oz | $1,650 |
| Exchange Rate | US$:C$ | 0.77 |
| Mine Life | years | 8.3 |
| Total Waste Tonnes Mined | kt | 69,139 |
| Total Mill Feed Tonnes | kt | 22,708 |
| Strip Ratio | Waste : Resource | 3.0 : 1 |
| Production | ||
| Mill Head Grade | g/t | 1.20 |
| Mill Recovery Rate | % | 95.3 % |
| Total Mill Ounces Recovered | koz | 835 |
| Total Average Annual Production | koz | 101 |
| Operating Costs | ||
| Mining Cost | C$/t Mined | $3.90 |
| Mining Cost | C$/t Milled | $15.27 |
| Processing Cost | C$/t Milled | $15.02 |
| G&A Cost | C$/t Milled | $5.07 |
| Total Operating Costs | C$/t Milled | $35.36 |
| Refining & Transport Cost | C$/oz | $5.00 |
| Royalty NSR | % | 2.0 % |
| Cash Costs | US$/oz Au | $778 |
| AISC | US$/oz Au | $889 |
| Capital Costs | ||
| Initial Capital | C$M | $234 |
| Sustaining Capital | C$M | $129 |
| Closure Costs | C$M | $9 |
| Salvage Costs | C$M | $18 |
| Financials Pre-Tax | ||
| NPV (5%) | C$M | $401 |
| IRR | % | 45.5 % |
| Payback | Years | 1.4 |
| Financials Post-Tax | ||
| NPV (5%) | C$M | $285 |
| IRR | % | 35.2 % |
| Payback | Years | 1.7 |
| Notes: Cash costs consist of mining costs, processing costs, mine-level G&A and refining charges and royalties AISC includes cash costs plus sustaining capital, closure costs, and salvage value. Payback is defined as achieving cumulative positive free cashflow after all cash costs and capital costs, including sustaining capital costs and is calculated from the start of production. Refer to “Non-IFRS Financial Measures” below. |
||
Cautionary Statement: The reader is advised that the PEA summarized in this news release is intended to provide only an initial, high-level review of the Project potential and design options. The PEA mine plan and economic model include numerous assumptions and the use of both indicated and inferred mineral resources. Inferred mineral resources are considered to be too speculative to be used in an economic analysis except as allowed for by NI 43-101 in PEA studies. Mineral resources are not mineral reserves and do not have demonstrated economic viability.
The PEA is based upon a subset of the mineral resources which incorporates 98.6% of indicated mineral resources and 1.4% of inferred mineral resources.
Projected gold production is 835,000 ounces over the 8.3 year LOM. Gold production averages 101,000 ounces per year, with an average of 122,000 ounces per year in the first four years. Attributable recovered ounces from Box and Athona over LOM are 81% and 19%, respectively.
Mine Design and Production Schedule
The PEA considers open-pit mining from the Box and Athona gold deposits over a project mine life of 8.3 years. Mine planning is based on conventional open pit methods suited for the Project location and local site requirements. The subset of Mineral Resources contained within the designed open pits are summarized in Table 2, with a 0.30 g/t gold cut-off, and form the basis of the mine plan and production schedule. A total of 98.6% of the Mineral Resources subset used in the PEA are classified as Indicated.
Table 2: PEA Mine Plan Production Summary
| PEA Mill Feed | 22,708 kt |
| Mill Feed Gold Grade | 1.20 g/t |
| Waste Overburden and Rock | 69,139 kt |
| Waste : Resource Ratio | 3.0 : 1 |
| Notes: | |
| 1. | The PEA Mine Plan and Mill Feed estimates are a subset of the September 1, 2022 Mineral Resource estimates and are based on open pit mine engineering and technical information developed at a Scoping level for the Box and Athona deposits. |
| 2. | PEA Mine Plan and Mill Feed estimates are mined tonnes and grade, the reference point is the primary crusher. |
| 3. | Mill Feed tonnages and grades include open pit mining method modifying factors, such as dilution and recovery. |
| 4. | Cut-off grade of 0.30 g/t assumes US$1,650/oz. Au at a currency exchange rate of 0.77 US$ per C$; 99.95% payable gold; C$5/oz offsite costs (refining, transport and insurance); a 2.0% NSR royalty; and a 95% metallurgical recovery for gold. |
| 5. | The cut-off grade covers processing costs of C$12.00/t, administrative (G&A) costs of C$6.20/t, and low grade stockpile Rehandle costs of C$1.00/t. |
| 6. | Estimates have been rounded and may result in summation differences. |
Optimized ultimate pit limits for each deposit have been split into phases or pushbacks to target higher economic margin material earlier in the mine life.
The Box deposit is split into three phases, and the Athona deposit is split into two phases (Figure 3). Pit designs are configured on five meter bench heights, with eight meter wide berms placed every four benches, or quadruple benching.
The mill will be fed with material from the pits at an average rate of 2.7 Mtpa (7.5 ktpd). Waste rock will be placed in one of three identified waste rock storage facilities (“WRSF”). Waste rock will also be used for construction of the haul roads and the tailings dam located north of the process facilities. Topsoil and overburden encountered at the top of the pits will be placed in a dedicated area and kept salvageable for closure at the end of the mine life. Cut-off grade optimization is employed, stockpiling lower grade material in the initial years and rehandling this material to the mill towards the end of mine life.
Mining cost estimates are built up from first principles based on the selected mining methods, assuming an owner managed operation. Mining operations will be based on 365 operating days per year with two twelve- hour shifts per day. An allowance of twelve days of no mine production per year has been built into the mine schedule to allow for adverse weather conditions.
The mine production schedule is summarized in Figure 4.
Metallurgy and Mineral Processing
Goldfields has been the subject of extensive metallurgical testwork programs and previous studies, dating back to 1939. This work has determined that there are no significant metallurgical or environmental hindrances associated with the mineralization. Based on the latest test work conducted by SGS Canada Inc. (“SGS”) in 2015, gold can be effectively recovered from the mineralization at both Box and Athona by gravity and leaching methods.
The Goldfields process flowsheet was designed based on previous testwork and preliminary financial evaluations, with key process design criteria derived from testwork conducted at SGS in 2015. The process plant employs gravity concentration, and standard leaching with carbon-in-pulp (“CIP”) technology for gold recovery. The plant includes three stages of crushing followed by ball milling, classification, gravity concentration, leach and CIP. Tailings will be subjected to cyanide detoxification before being pumped to the tailings storage facility.
The process plant will treat 2.7 Mt of material per year at an average throughput of 7.5 ktpd based on mill availability of 92%. The crusher plant circuit design is set at 65% availability and the gold room availability is set at 52 weeks per year. The plant will operate two shifts per day, 365 days per year and will produce doré bars.
The plant has been designed to realize an average recovery of 95.3% of the gold (95.9% Box and 93.5% Athona) over LOM. Of this, 24.5% of the gold will be extracted by gravity and a further 70.8% by the leach/CIP process. The proposed process flowsheet is shown in Figure 5.
Site Infrastructure
Goldfields benefits from an existing gravel road from Uranium City (Highway 962) and high-voltage powerline to the Box site from hydropower stations located approximately 40 kilometres to the northwest. Both the gravel road and powerline will require minor upgrades and refurbishment. Stoney Rapids, the regional business hub, is located approximately 150 kilometres to the east and is accessible along Lake Athabasca by boat or barge during the summer, and by an ice-road during winter, built and maintained by the Provincial Government.
Figure 6 shows the site layout, including pits for Box and Athona, stockpiles, waste rock storage facility (“WRSF”), Tailings Storage Facility (“TSF”), onsite roads, processing plant and mining infrastructure areas such as offices and truck shops. This infrastructure has been kept at least 30 meters from the surveyed edge of Lake Athabasca and located to minimize disturbance to existing waterbodies and watercourses.
The site location selection for the WRSF, TSF, processing plant and other mining infrastructure considered various factors including social, environmental, topographic, accessibility, proximity to existing infrastructure and overall flow of the mining operation. Administration facilities, truck shop, wash bay, tire store, fuel storage, assay laboratory and warehousing are centralized near the process plant. Accommodations are planned for Uranium City in a permanent camp with personnel transport to the mine on a shift basis.
The primary design objectives of the TSF are the secure confinement of tailings and the protection of the regional groundwater and surface water during mine operations and closure. Based on preliminary environmental characterization and the geology of the two deposits, it can be considered that the waste rock, mineralized material and tailings are not acid-generating nor metal leaching. These desirable characteristics for the Project (simplified operation, easier water management and reduced closure risks) were incorporated into the Project design.
Tailings at Goldfields will be pumped from the process plant to the TSF and will be stored behind a tailings dam. The TSF has been designed in accordance with CDA guidelines (2013, 2019) to safely accommodate the life of mine tailings production as described in the PEA.
Topsoil and overburden encountered during site excavations will be placed in a dedicated area and kept salvageable for closure at the end of the mine life to facilitate revegetation of the TSF and WRSF.
Capital Costs
Initial capital costs are estimated at C$234M with allowances for indirect costs, including a contingency of C$34M. Sustaining capital costs are estimated at C$129M which includes cost of mine expansion, payments of mining fleet, expansion of TSF, financing of the permanent camp facilities and associated indirect costs. The down payment and initial financing payments for the mining fleet and camp are included in the initial capital period whereas the balance of payments are included in the sustaining capital period. The capital costs for the Project are built using a combination of vendor quotations for all major equipment and benchmark information in the region. The project uses a contingency of 7.4% for initial mining capital, 25% for all process plant and infrastructure costs, for both initial and sustaining capital. An owner’s cost of 5% is applied on the total direct costs excluding mining costs. A summary of capital costs is provided in Table 3.
Table 3: Summary of Capital Costs
| Description | Initial Capital | Sustaining Capital | Total Capital Cost |
| (C$M) | (C$M) | (C$M) | |
| Mine | 40.2 | 69.0 | 109.2 |
| Process Plant | 72.0 | – | 72.0 |
| On Site Infrastructure | 22.1 | 24.7 | 46.8 |
| Off Site Infrastructure | 5.7 | – | 5.7 |
| Tailings Storage Facility | 20.8 | 16.0 | 36.8 |
| Total Direct | 160.7 | 109.7 | 270.5 |
| Project Indirects | 10.3 | 2.9 | 13.1 |
| Project Delivery | 22.1 | 6.6 | 28.8 |
| Owner’s Costs | 6.3 | – | 6.3 |
| Contingency | 34.0 | 9.5 | 43.5 |
| Total Indirect | 72.8 | 19.0 | 91.8 |
| Totals | 233.5 | 128.7 | 362.2 |
| Note: Numbers may not add due to rounding | |||
Operating Costs
Operating costs were derived using benchmark information in the region and are estimated at C$35.36/t milled (Table 4). The mine and process operating costs are built up from first principles. Cost inputs are derived from benchmarked prices.
Table 4: Summary of Operating Costs
| Cost Centre | LOM | Annual Average Cost |
LOM Total / Avg. | Average LOM |
OPEX |
| (C$M) | (C$M) | (C$/t Milled) | (C$/oz) | ( %) | |
| Mining Cost | 346.82 | 41.81 | 15.27 | 415.32 | 43 % |
| Processing Cost | 341.08 | 41.12 | 15.02 | 408.44 | 43 % |
| G&A Cost | 115.12 | 13.88 | 5.07 | 137.86 | 14 % |
| Total Operating Costs | 803.02 | 96.81 | 35.36 | 961.62 | 100 % |
Cash Flow Analysis
The projected cash flow for the Project is provided in Figure 7. Cumulative after-tax unlevered free cash flow totals C$435M. Payback for the Project is 1.7 years.
Sensitivities
A sensitivity analysis was conducted on the base case pre-tax and after-tax NPV, IRR and payback of the Project, using the following variables: gold price, initial capex, total operating costs, discount rate, foreign exchange rate, mill recovery and head grade. The after-tax sensitivity analysis results for a range of gold prices are summarized in Table 5. Tables 6 and 7 provide a summary of after-tax NPV and IRR sensitivities for initial capex, total opex and foreign exchange rate (“FX”). The Project is most sensitive to changes in gold prices and less sensitive to initial capex and operating costs.
Table 5: After-Tax Sensitivity Summary
| Gold Price
(US$/oz) |
US$1,300 | US$1,450 | Base Case US$1,650 | US$1,750 | US$1,950 |
| NPV5% | C$81M | C$168M | C$285M | C$343M | C$459M |
| IRR | 14.6 % | 23.9 % | 35.2 % | 40.5 % | 50.5 % |
| NPV5%/CAPEX | 0.35 | 0.72 | 1.22 | 1.47 | 1.96 |
| Payback (Years) | 5.2 | 2.4 | 1.7 | 1.6 | 1.3 |
Table 6: After-Tax NPV5% Sensitivity
| Gold Price
(US$/oz) |
After-Tax NPV5% Base Case |
Initial CAPEX | Total OPEX | FX | |||
| -20 % | +20 % | -20 % | +20 % | -20 % | +20 % | ||
| US$1,300 | C$81M | C$142M | C$21M | C$168M | (C$7M) | (C$81M) | C$232M |
| US$1,450 | C$168M | C$229M | C$108M | C$255M | C$81M | (C$1M) | C$337M |
| US$1,650 | C$285M | C$345M | C$224M | C$371M | C$198M | C$93M | C$476M |
| US$1,750 | C$343M | C$402M | C$283M | C$429M | C$256M | C$139M | C$545M |
| US$1,950 | C$459M | C$518M | C$399M | C$545M | C$372M | C$232M | C$684M |
Table 7: After-Tax IRR Sensitivity
| Gold Price
(US$/oz) |
After-Tax IRR
Base Case |
Initial CAPEX | Total OPEX | FX | |||
| -20 % | +20 % | -20 % | +20 % | -20 % | +20 % | ||
| US$1,300 | 14.6 % | 25.5 % | 7.1 % | 23.4 % | 4.1 % | 0.0 % | 30.2 % |
| US$1,450 | 23.9 % | 36.4 % | 15.3 % | 31.8 % | 14.8 % | 4.9 % | 40.0 % |
| US$1,650 | 35.2 % | 49.6 % | 25.2 % | 42.3 % | 27.4 % | 15.8 % | 52.0 % |
| US$1,750 | 40.5 % | 55.8 % | 29.9 % | 47.3 % | 33.1 % | 20.9 % | 57.7 % |
| US$1,950 | 50.5 % | 67.4 % | 38.8 % | 56.8 % | 43.9 % | 30.2 % | 68.6 % |
Key Opportunities for Project Improvement
Detailed metallurgical testing, including variability sampling across the deposits, is recommended during a prefeasibility study which has the potential to improve gold recoveries. Further testing for the gravity circuit could support further refinement of the equipment sizing and costs. Confirmatory testing could lead to capital and operating cost reductions in other areas of the process plant.
A preliminary pre-concentration (ore sorting) analysis was completed in early 2022 by SRK which showed potential to improve Project economics based on a scoping level assessment. Additional upside could be created by a decrease in tailings volume as a result of sorting. SRK recommended that preliminary mineral sensing testwork be conducted such that more accurate predictions of sorting could be derived, which could form part of a future prefeasibility study.
Future investigation and trade-off of alternative onsite material transport options that differ from the planned diesel driven haul truck fleet, with the goals of improving the project economics and minimizing the Project’s carbon footprint. These options could include crushing and conveying, hauler trolley systems, and a battery electrical mining fleet. This, combined with the use of hydropower, has the potential to make the Project highly sustainable and climate-friendly.
The Project has exploration potential which could enable longer mine life beyond 8.3 years or increased annual production volumes. The mineralization at Box and Athona remains open and numerous other gold prospects on the Property require more detailed re-evaluation. At Box, initial assessment of underground mining below the extents of the open-pit showed limited potential, however additional drilling to target high-grade zones along structural trends is recommended with the goal of increasing mineral resources for inclusion in future mining studies. This potential is demonstrated by the Phase 1 drilling completed in 2021 which produced intercepts below the current MRE of 8.00 g/t over 4.0 metres (drill hole B21-334), 8.00 g/t over 12.0 metres (drill hole B21-336), 8.74 g/t over 5.0 metres (drill hole B21-339) and 13.22 g/t over 8 metres (drill hole B21-340) (For further details see News Release dated September 14, 2021 and March 7, 2022).
Mineral Resource Estimate
An updated MRE was completed as part of the PEA. The mineral resources have been estimated in accordance with the CIM “Estimation of Mineral Resource and Mineral Reserves Best Practices” guidelines (November 2019) and NI 43-101. The updated MRE was prepared by SRK, an independent consulting firm with significant experience in the estimation of gold deposits, both in Canada and internationally.
This updated MRE replaces the previous MRE with an effective date of March 15, 2021, also completed by SRK, who used the same resource estimation procedures to update the MRE based on additional drilling completed during 2021. SRK is also responsible for the development of the supporting mineralization models which were based upon structural and petrographic studies conducted by SRK during late 2020.
The updated MRE is provided in Table 8 with an effective date of September 1, 2022. Mineral resources are constrained within a conceptual open-pit shell. The MRE reconciles to within 1% of historical mine production at Box when the historically reported process plant recovery of 96% is applied, providing additional confidence in the estimate.
Table 8: Goldfields Mineral Resource Statement, effective date September 1, 2022.
| Deposit | Category | Tonnes | Au Grade | Total Au |
| (Mt) | (g/t) | (000’s oz) | ||
| Box | Indicated | 15.8 | 1.44 | 729.7 |
| Athona | Indicated | 7.4 | 1.06 | 250.2 |
| Total Indicated | 23.2 | 1.31 | 979.9 | |
| Box | Inferred | 3.3 | 1.08 | 112.8 |
| Athona | Inferred | 3.8 | 0.80 | 98.0 |
| Total Inferred | 7.1 | 0.92 | 210.8 | |
| Notes: | ||||
| 1) Mineral resources are not mineral reserves and do not have demonstrated economic viability. | ||||
| 2) Mineral resources are reported at a cut-off grade of 0.3 g/t gold, constrained within a conceptual open-pit shell. | ||||
| 3) Mineral resources are reported using a gold price of US$1800/oz. | ||||
| 4) All figures are rounded to reflect the relative accuracy of the estimate. | ||||
The mineral resource model considers a total of 838 boreholes of which 494 are located within the Box deposit and 344 within the Athona deposit.
Indicated Mineral Resources comprise 82% of the estimate, with the remaining 18% classified at an Inferred level of confidence. Comparison of the March 15, 2021 and September 1, 2022 mineral resource statements show an increase in tonnage and contained gold content within the current Indicated mineral resource statement of approximately 2.7% and 0.5%, respectively, and an increase in the Inferred mineral resource tonnes and contained gold content of approximately 18% and 20%, respectively. The increases observed in the September 2022 mineral resources are related to the additional drilling completed in 2021 which expanded the footprint of the classified mineral resources at both the Box and Athona deposits, as well as the incorporation of a higher gold price which increased the size of the constraining pit shells used for mineral resource reporting.
Environmental, Permitting and Social Considerations
The Project completed a federal screening and a provincial Environmental Assessment and received Ministerial Approval to proceed to licensing in 2008. Updates to the environmental baseline will be required and changes to the Project, to that which was assessed, will require some additional assessment. Approvals to these changes would be required through an application submitted in accordance with Section 16 of the Provincial Assessment Act. Doing so should significantly reduce the schedule and cost required to advance the Project into construction and operations.
There is a risk that both the federal and provincial regulators deem the changes to the Project, from that which was approved in 2008, are too great to allow the gaps to be addressed under a Section 16 (Saskatchewan Assessment Act) application. A decision of this nature would require a new federal screening and possibly a federal assessment coupled with a new provincial assessment as well. This would increase the schedule and cost required to advance the Project to construction.
Fortune Bay is committed to working with Indigenous Rights Holders declaring the Project area as part of their traditional territory. Engagement efforts with these Rights Holders, specifically First Nation representatives, to date have established the foundation of a relationship based on trust and honesty.
No environmental and/or social risks have been identified that cannot be reasonably mitigated through the implementation of good engineering and social practices.
Qualified Persons
The PEA has been prepared by the following “Qualified Persons”, all of whom are considered to be independent consultants of Fortune Bay for the purposes of section 1.5 of NI 43-101, and all of whom have reviewed the information in this press release that is summarized from the PEA in their areas of expertise:
The technical and scientific information in this news release has been reviewed and approved by Dale Verran, M.Sc., P.Geo., Chief Executive Officer of the Company, who is a Qualified Person as defined by NI 43-101. Mr. Verran is an employee of Fortune Bay and is not independent of the Company under NI 43–101.
Non-International Financial Reporting Standards Financial Measures
The Company has included certain non-IFRS financial measures in this news release, such as initial capital cost, sustaining capital cost, total capital cost, AISC, and capital intensity, which are not measures recognized under IFRS and do not have a standardized meaning prescribed by IFRS. As a result, these measures may not be comparable to similar measures reported by other corporations. Each of these measures used are intended to provide additional information to the user and should not be considered in isolation or as a substitute for measures prepared in accordance with IFRS. Non-IFRS financial measures used in this news release and common to the gold mining industry are defined below.
Total Cash Costs and Total Cash Costs per Ounce
Total cash costs are reflective of the cost of production. Total cash costs reported in the PEA include mining costs, processing and water treatment costs, general and administrative costs of the mine, off-site costs, refining costs, transportation costs and royalties. Total cash costs per ounce is calculated as total cash costs divided by payable gold ounces.
AISC and AISC per Ounce
AISC is reflective of all of the expenditures that are required to produce an ounce of gold from operations. AISC reported in the PEA includes total cash costs, sustaining capital, closure costs and salvage, but excludes corporate general and administrative costs. AISC per ounce is calculated as AISC divided by payable gold ounces.
About Ausenco
Ausenco is a global company based across 26 offices in 14 countries, with projects in over 80 locations worldwide. Combining deep technical expertise with a 30-year track record, Ausenco delivers innovative, value- add consulting studies, project delivery, asset operations and maintenance solutions to the mining and metals, oil & gas and industrial sectors.
About Fortune Bay
Fortune Bay Corp. is an exploration and development company with 100% ownership in two advanced gold exploration projects in Canada, Saskatchewan (Goldfields Project) and Mexico, Chiapas (Ixhuatán Project), both with exploration and development potential. The Company is also advancing the 100% owned Strike and Murmac uranium exploration projects, located near the Goldfields Project, which have high-grade potential typical of the Athabasca Basin. The Company has a goal of building a mid-tier exploration and development Company through the advancement of its existing projects and the strategic acquisition of new projects to create a pipeline of growth opportunities. The Company’s corporate strategy is driven by a Board and Management team with a proven track record of discovery, project development and value creation.
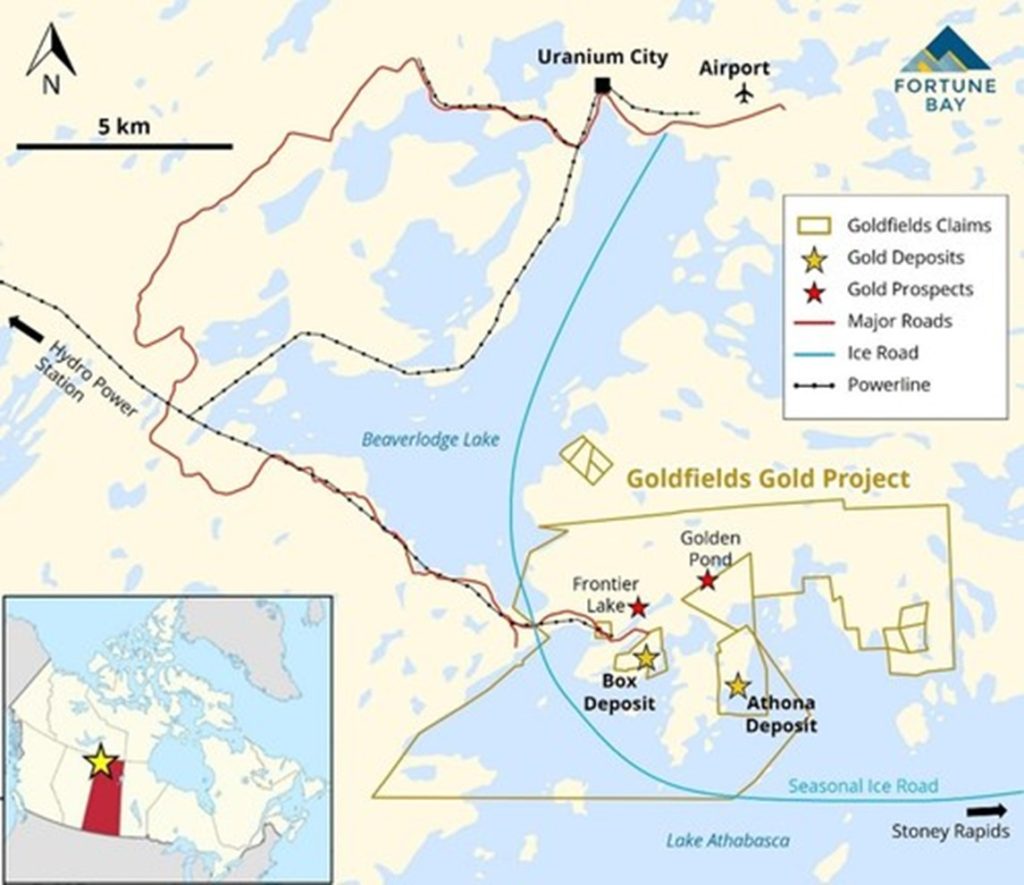
Figure 1: Location of the Goldfields Project (CNW Group/Fortune Bay Corp.)
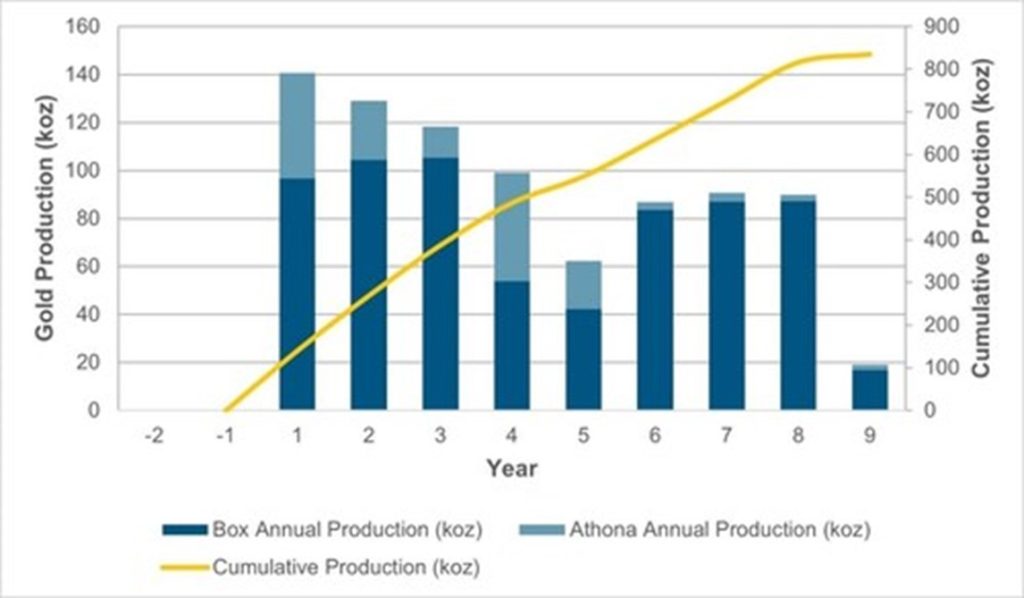
Figure 2: Annual Gold Production (CNW Group/Fortune Bay Corp.)
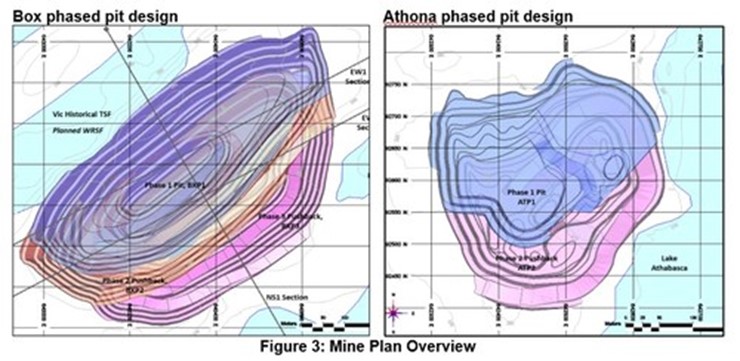
Figure 3: Mine Plan Overview (CNW Group/Fortune Bay Corp.)
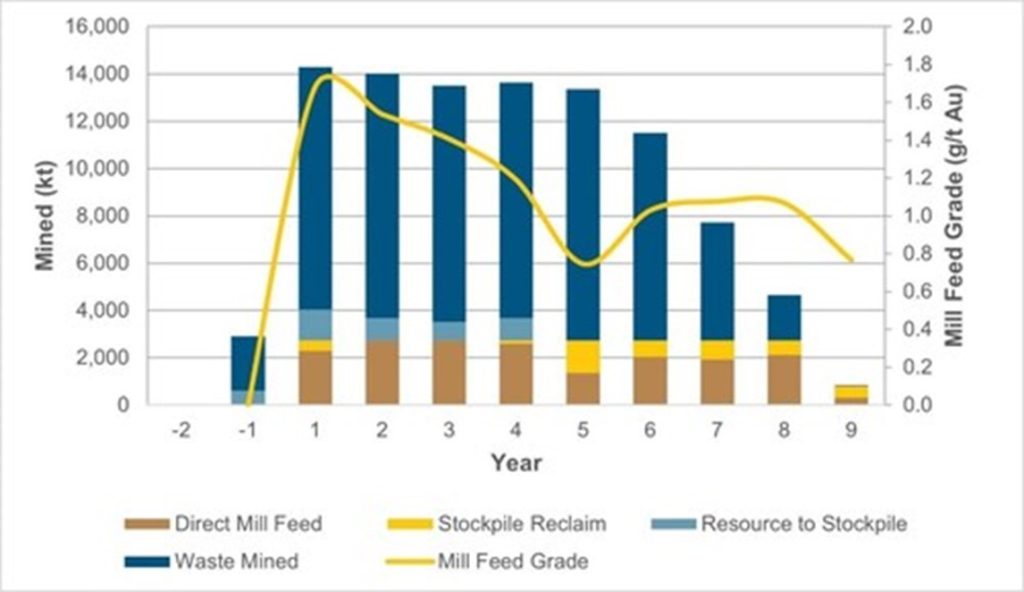
Figure 4: Mine Production Schedule Summary (CNW Group/Fortune Bay Corp.)
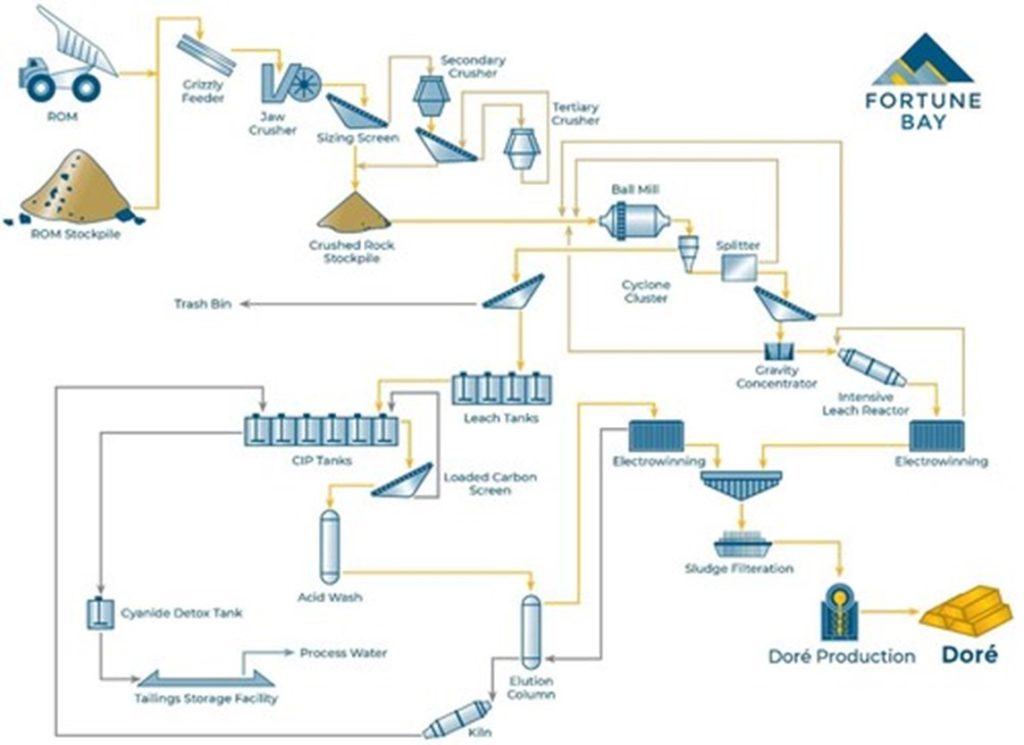
Figure 5: Goldfields Simplified Process Flowsheet (CNW Group/Fortune Bay Corp.)
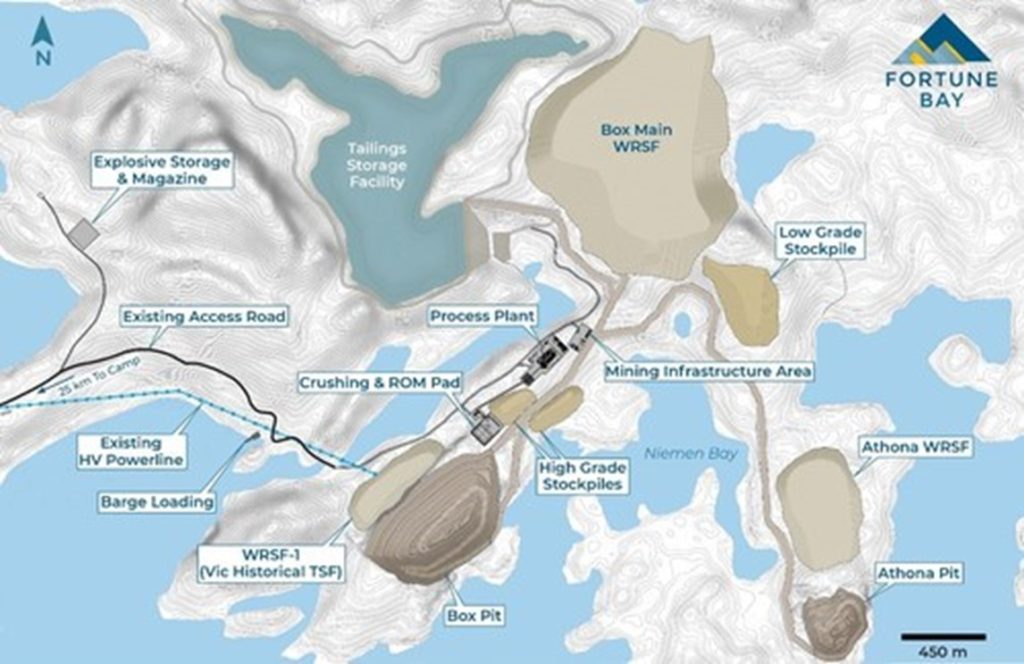
Figure 6: Goldfields Site Layout (CNW Group/Fortune Bay Corp.)
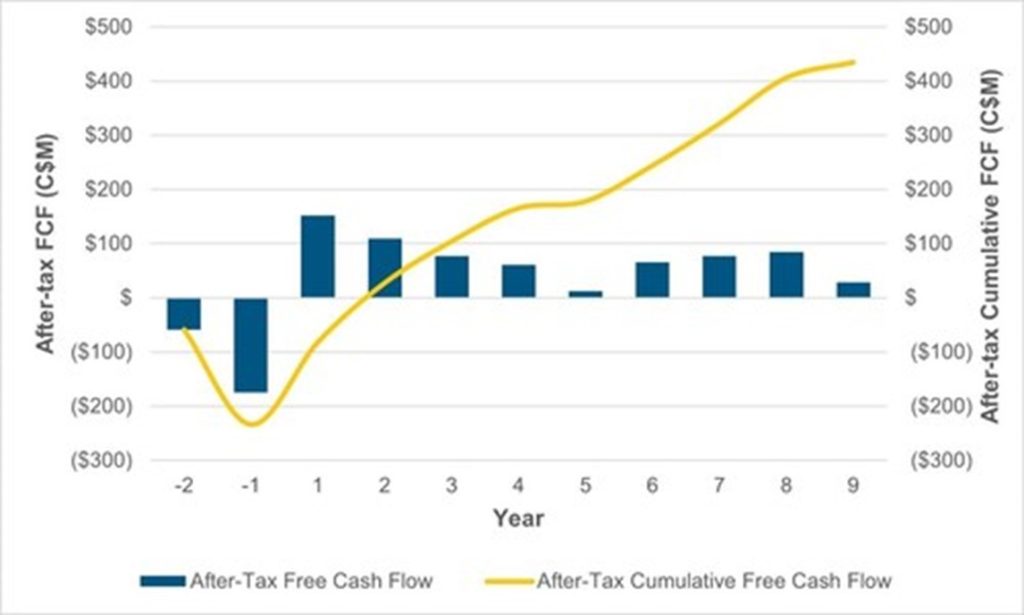
Figure 7: Goldfields Project After-Tax Unlevered Free Cash Flow (CNW Group/Fortune Bay Corp.)
Hudbay Minerals Inc. (TSX:HBM) (NYSE: HBM) today released its ann... READ MORE
Strategic acquisition of an established operating gold mine, loca... READ MORE
Cerro de Pasco Resources Inc. (TSX-V: CDPR) (OTCQB: GPPRF) (FRA: ... READ MORE
The Garneau Titanium Project Features Ilmenite-Rich Boulder with ... READ MORE
ValOre Metals Corp. (TSX‐V: VO) (OTCQB: KVLQF) (Frankfurt: KEQ0... READ MORE


