


Latest assays such as 42m @ 6.1% CuEq and 9.8m @ 16.5% CuEq, which demonstrate the outstanding continuity of the high-grade zone, will feed into the impending economic studies
KEY POINTS
________________________________
1 Metal equivalent for drill results reported in this announcement have been calculated at a copper price of US$8,750/t, gold price of US$2,500/oz, silver price of US$25/oz and zinc price of US$2,500/t. Metallurgical recoveries have been set at 95% for copper, 85% for precious metals and 50% for zinc. CuEq(%) = Cu(%) + (Au(g/t) x 0.82190) + (Ag(g/t) x 0.0822) + (Zn(%) x 0.15038). In the opinion of the Company, all elements included in the metal equivalent calculation have a reasonable potential to be recovered and sold based on current market conditions, metallurgical test work, and historical performance achieved at the Green Bay project whilst in operation.
FireFly Managing Director Steve Parsons said: “These are exceptional results with extremely high grades over substantial widths. They also demonstrate the strong continuity of this mineralisation. This is an outstanding combination of grade and width. The continuing of this mineralisation is a very positive indicator for the upcoming economic studies, which will assess the potential development scenarios for Green Bay.
“These results will be included in the economic studies, which are in the process of being completed, enabling us to demonstrate the financial benefits of such a rich core of mineralisation.
“With six rigs drilling underground, as well as regional exploration in progress, we intend to keep growing and upgrading the resource in parallel with economic and technical studies”.
FireFly Metals Ltd (ASX:FFM) (TSX: FFM) is pleased to announce more exceptional drilling results that demonstrate the strong continuity of the high-grade mineralisation at the Green Bay Copper-Gold Project in Newfoundland and Labrador, Canada.
Recent drilling has continued to focus on upgrading the existing Mineral Resource as part of the economic studies on the upscaled restart of mining at Green Bay.
Infill drilling of the high-grade convergent core zone (Core Zone) continues to return exceptional copper and gold intersections over considerable thicknesses. Latest results from the Core Zone include 42.0m @ 6.1% CuEq and 51.5m @ 4.9% CuEq further demonstrating continuity of what is shaping as an economically significant part of future mining plans being considered in the upcoming economic studies. The Core Zone has a current Mineral Resource of 8.8Mt @ 3.9% CuEq M&I and 10.9Mt @ 3.8% CuEq Inferred with significant potential to grow (see ASX announcement dated 18 November 2025). The deepest hole drilled to date returning an intersection of 49.1m @ 6.1% CuEq (see ASX announcement dated 16 October 2025).
Drilling of the VMS lodes has confirmed the presence of strong copper and gold mineralisation to the west and down-plunge of existing mine development. This is significant because the strike width of the sulphide horizons now extends beyond 400m in places and significantly enhances the copper tonnes per vertical metre in the deposit. Recent intersections include 20.7m @ 7.7% CuEq, 17.8m @ 6.7% CuEq and 25.9m @ 6.4% CuEq.
Select holes were extended to test mineralisation in the lower footwall zone that hosts copper stringer-style mineralisation. Results returned included thick high-grade zones of 25.3m @ 3.8% CuEq, 35.7m @ 3.3% CuEq and 43.5m @ 3.0% CuEq.
The drill results reported in this announcement will be incorporated into an updated mid-year Mineral Resource Estimate (MRE). The current MRE for the Green Bay project stands at 50.4Mt @ 2.0% CuEq M&I and 29.3Mt @ 2.5% CuEq Inferred (see ASX announcement dated 18 November 2025).
The mid-year MRE upgrade will underpin the Preliminary Economic Assessment / Scoping Study that is nearing completion. The study is anticipated for release in July-August 2026 to enable the recent drilling and the upgraded MRE to be incorporated into the mine plan and project economics. This assessment will highlight multiple potential development scenarios for the future operation at Green Bay.
Drilling continues underground with six rigs focused on a combination of both infill drilling and extending the known Mineral Resource in the high-grade VMS zones.
Regional exploration is starting to accelerate following the winter period. Until recently, work has focused on target generation utilising both geophysics, prospecting and historic data compilation. Two surface rigs are currently testing geophysical anomalies at Green Bay. Maiden drilling at the Company’s Tilt Cove project has commenced.
FireFly is well funded to continue its growth drilling, economic studies and pre-construction early works activities. The Company has ~A$219.9M in cash and liquid investments as at 31 March 2026.
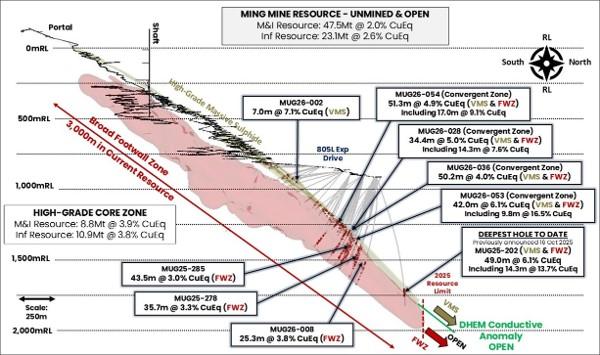
Figure 1: Long section through the Green Bay Ming underground mine highlighting the location of select drill results from this announcement only. Results from both the high-grade copper-gold VMS zone and broad copper Footwall Zone are shown. The large scale DHEM conductor (green) beyond the edge of the current Mineral Resource highlights strong potential for the Mineral Resource to continue. Drill assays >0.5% copper are shown in red. All intersections downhole thickness. Refer to Appendix B for all drill results and locations.
About the Drilling Results
Drilling at the Ming underground copper-gold mine recommenced following FireFly’s acquisition of the Green Bay Copper-Gold Project in October 2023. In total, FireFly has completed ~192,000m of underground diamond drilling up to 31 May 2026.
This announcement contains the results of 67 completed drill holes. The drilling results focus on infill drilling and holes targeting the lateral margins of the mineralisation. Logging and analysis of additional drill holes is ongoing.
There are two distinct styles of mineralisation present at the Ming Mine, consisting of a series of upper copper-gold rich VMS lenses underlain by a broad copper-rich stringer zone, known as the Footwall Zone.
The FWZ is extensive, with the copper stringer mineralisation observed over thicknesses of ~150m and widths exceeding 200m. The known strike of the mineralisation defined to date is three kilometres and it remains open down-plunge.
The high-grade Core Zone consists of the VMS and the upper FWZ mineralisation where the two styles converge down-plunge. The Core Zone has a current Mineral Resource of 8.8Mt @ 3.9% CuEq M&I and 10.9Mt @ 3.8% CuEq.
Six drill rigs are currently operating underground, with the focus split between both step-out extension (two rigs) and infill Mineral Resource conversion drilling (four rigs).
All drilling reported in this announcement has been conducted from the 805L drill drive. Whilst this development is currently being utilised for exploration, it will form an important part of future mine infrastructure for the potential upscaled operation.
Additional development has been completed from this drive to position the rigs to test for high grade extensions of the 1806 and 1807 VMS lodes. The location of drill platforms and holes reported in this announcement are presented in Figure 2. Significant assay results are presented in Appendix B of this announcement.
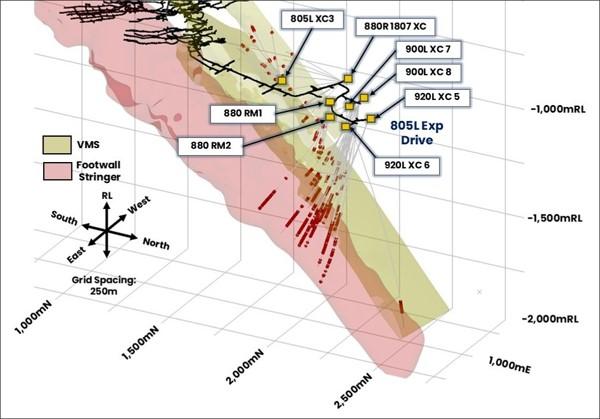
Figure 2: Isometric view of the Ming Mine 805L Exploration Drive showing the location of drill platforms and drilling reported in this announcement. Assay results greater than 0.5% Cu are shown in red.
Resource Conversion Drilling
805L Exploration Drive Crosscut 3 West
The drilling reported from the mid-section of the 805L Exploration drive (Crosscut 3 West) focused on upgrading the data density of the Inferred Mineral Resource reported in MRE announced by the Company on 18 November 2025 (November 2025 MRE).
Drilling focused on conversion of the western peripheral margins of the high-grade VMS zones which will potentially form an important high-grade component in the early years of an upscaled restart of production at the Ming Mine. The zones at the margins of the VMS lenses are typically gold-rich which is likely the result of lateral variations in both fluid composition and fluid depositional temperature.
Results from the 805L Crosscut 3 are summarised in Table 1.
| Hole Number | Style | From (m) |
To (m) |
Width (m) |
Assay | CuEq % |
Comments | |||
| Cu % | Au g/t | Ag g/t | Zn % | |||||||
| MUG25_257 | VMS | 285.1 | 287.4 | 2.3 | 3.20 | 4.9 | 31.3 | 1.36 | 7.68 | Multiple gold-rich VMS zones separated by post-mineral gabbro |
| VMS | 291.4 | 296.7 | 5.3 | 0.80 | 1.6 | 6.2 | 0.24 | 2.17 | ||
| MUG25_262 | VMS | 262.9 | 269.2 | 6.3 | 1.72 | 1.4 | 11.7 | 0.83 | 3.08 | VMS zone at outer western margin |
| MUG25_264 | VMS | 254.8 | 261.6 | 6.8 | 2.49 | 2.5 | 28.7 | 2.24 | 5.12 | Copper-gold VMS zone |
| MUG25_272 | VMS | 465.2 | 489.8 | 24.7 | 1.39 | 2.6 | 20.8 | 0.38 | 3.74 | Multiple gold-dominated VMS zones including a 2.6m intersection grading 9.9g/t Au |
| VMS | 501.4 | 504.0 | 2.6 | 4.38 | 9.9 | 38.3 | 1.80 | 13.14 | ||
| MUG26_001 | FWZ | 526.8 | 528.8 | 2.0 | 1.17 | 0.1 | 1.2 | 0.06 | 1.26 | Isolated copper stringers in the FW |
| MUG26_039 | VMS | 340.9 | 347.0 | 6.1 | 4.40 | 3.7 | 27.9 | 1.33 | 7.91 | VMS with high-grade copper and gold |
Table 1: Drill results from the 805L Exploration Drive Crosscut 3 West. All results presented are downhole intervals. Based on drill angles and interpreted geology the true thickness is approximately 60-75% of the reported downhole interval for holes drilled in the 805L Crosscut 3.
880R 1807 Crosscut
Drilling completed from the 880L 1807 Remuck was designed to test down-plunge extents of the western margin of the VMS lodes. The three holes that successfully reached target intersected copper and/or gold rich VMS style mineralisation (Table 2).
| Hole Number | Style | From (m) |
To (m) |
Width (m) |
Assay | CuEq % |
Comments | |||
| Cu % | Au g/t | Ag g/t | Zn % | |||||||
| MUG26_002 | VMS | 308.2 | 315.2 | 7.0 | 4.62 | 2.7 | 27.3 | 0.40 | 7.09 | Copper and gold rich VMS zone |
| MUG26_023 | VMS | 273.2 | 281.7 | 8.6 | 1.80 | 2.0 | 20.7 | 2.97 | 4.05 | Zinc-rich copper and gold zone |
| MUG26_043 | VMS | 422.8 | 425.3 | 2.4 | 0.38 | 2.2 | 13.7 | 0.06 | 2.29 | Thin gold-dominated VMS zone at the margins of the channel |
Table 2: Drill results from the 880R 1807 Crosscut. All results presented are downhole intervals. Based on drill angles and interpreted geology the true thickness is approximately 75-80% of the reported downhole interval for holes drilled in the 880R 1807 crosscut.
880R Remuck 1 and 2
The drilling completed from the 880 Remuck bays 1 and two focused on infill drilling of the eastern high-grade VMS zones with select holes continued deeper into the footwall stringer mineralisation.
The VMS mineralisation intersected to the east is typically copper-dominant with moderate to locally high-gold grades.
Results from the 880R Remuck bays are summarised in Table 3.
| Hole Number | Style | From (m) |
To (m) |
Width (m) |
Assay | CuEq % |
Comments | |||
| Cu % | Au g/t | Ag g/t | Zn % | |||||||
| MUG25_246 | VMS | 314.3 | 318.4 | 4.1 | 5.40 | 2.0 | 13.8 | 1.14 | 7.33 | High grade copper and gold VMS |
| MUG25_250 | FWZ | 505.9 | 511.8 | 5.9 | 1.56 | 0.1 | 1.4 | 0.04 | 1.64 | Multiple zones of moderately grading footwall stringer veins from ~506m to ~580m |
| FWZ | 528.8 | 539.0 | 10.2 | 1.79 | 0.1 | 1.5 | 0.02 | 1.87 | ||
| FWZ | 546.3 | 562.4 | 16.2 | 1.31 | 0.1 | 1.3 | 0.02 | 1.37 | ||
| FWZ | 567.5 | 579.4 | 11.9 | 1.59 | 0.1 | 1.7 | 0.03 | 1.66 | ||
| MUG25_255 | VMS | 319.8 | 330.3 | 10.5 | 3.05 | 1.8 | 16.5 | 1.50 | 4.86 | Thick zone of copper dominated VMS mineralisation |
| MUG25_260 | VMS | 322.8 | 332.5 | 9.8 | 5.04 | 1.8 | 12.9 | 1.34 | 6.80 | Thick and high-grade copper and gold VMS |
| MUG25_263 | VMS | 342.1 | 345.0 | 2.9 | 1.25 | 0.5 | 3.3 | 0.60 | 1.78 | Thin VMS zone with gabbro dykes |
| MUG25_265 | VMS | 326.5 | 330.3 | 3.8 | 2.43 | 1.2 | 13.9 | 1.98 | 3.82 | Copper-gold VMS |
| MUG25_270 | VMS | 329.4 | 338.8 | 9.4 | 2.66 | 1.4 | 12.5 | 2.03 | 4.26 | An upper copper-gold VMS underlain by a gold rich zone devoid of copper |
| VMS | 340.5 | 348.0 | 7.5 | 0.03 | 1.1 | 7.4 | 0.56 | 1.08 | ||
| MUG25_277 | VMS | 329.5 | 341.3 | 11.8 | 2.32 | 1.2 | 11.2 | 1.56 | 3.62 | Thick moderately grading VMS zone with both copper and gold |
| MUG25_283 | VMS | 365.3 | 369.2 | 3.9 | 1.39 | 1.2 | 16.8 | 0.67 | 2.62 | VMS zone at mineralisation margins |
Table 3: Drill results from the 880R Remuck 1 and 2 drill cuddies. All results presented are approximate true thickness unless otherwise stated.
900L Crosscuts 7 and 8
900L Crosscuts 7 and 8 were mined during 2026 as drill platforms to test the western zones of the VMS mineralisation.
Work completed from the 900L crosscuts 7 and 8 was focused on infilling and extending the western margins of the Ming North VMS lode. This drilling successfully demonstrated both down-plunge and lateral continuity of the zones, highlighted by intersections including 20.7m @ 7.7% CuEq, 9.3m @ 7.0% CuEq and 17.8m @ 6.7% CuEq.
Select holes were extended to test footwall mineralisation.
Drilling completed from the 900L Crosscuts 7 and 8 reported in this announcement is summarised in Table 4.
| Hole Number | Style | From (m) |
To (m) |
Width (m) |
Assay | CuEq % |
Comments | |||
| Cu % | Au g/t | Ag g/t | Zn % | |||||||
| MUG25_261 | VMS | 400.3 | 403.4 | 3.1 | 7.99 | 2.6 | 19.0 | 1.65 | 10.55 | High-grade copper and gold VMS |
| MUG25_267 | VMS | 390.1 | 399.4 | 9.3 | 5.10 | 1.6 | 20.3 | 2.94 | 7.00 | Thick zone of copper-dominated high grade VMS |
| MUG25_273 | VMS | 375.9 | 378.2 | 2.3 | 4.04 | 1.4 | 14.9 | 0.56 | 5.41 | Multiple VMS horizons intersected separated by ~13m |
| VMS | 391.1 | 396.9 | 5.8 | 1.95 | 0.8 | 4.2 | 0.17 | 2.66 | ||
| MUG25_279 | VMS | 384.2 | 401.9 | 17.8 | 5.40 | 1.3 | 15.8 | 0.36 | 6.69 | Thick high-grade upper VMS grading into sericite-rich upper-footwall stringer mineralisation |
| FWZ | 413.0 | 415.0 | 2.0 | 1.85 | 0.1 | 1.7 | 0.06 | 1.99 | ||
| FWZ | 423.1 | 426.0 | 2.9 | 1.36 | 0.1 | 1.1 | 0.18 | 1.49 | ||
| MUG25_280 | VMS | 383.5 | 387.7 | 4.2 | 2.71 | 1.1 | 13.4 | 2.96 | 4.20 | Copper-gold VMS horizon |
| MUG26_003 | VMS | 404.0 | 416.8 | 12.8 | 3.02 | 2.0 | 12.6 | 3.33 | 5.28 | Thick copper and gold VMS |
| MUG26_013 | VMS | 375.0 | 395.7 | 20.7 | 5.90 | 1.9 | 14.1 | 0.74 | 7.71 | Massive sulphide zone transitioning into footwall stringer mineralisation |
| FWZ | 411.0 | 416.8 | 5.8 | 3.39 | 0.2 | 3.8 | 0.22 | 3.63 | ||
| MUG26_015 | VMS | 389.5 | 400.0 | 10.6 | 3.72 | 1.7 | 20.0 | 3.57 | 5.82 | VMS zone with strong copper and gold grades with high silver and zinc contents |
| MUG26_029 | VMS | 377.0 | 390.6 | 13.6 | 5.72 | 1.1 | 15.4 | 0.40 | 6.83 | Chalcopyrite-dominated VMS zone |
| MUG26_031 | VMS | 373.5 | 382.7 | 9.2 | 2.18 | 1.0 | 14.6 | 2.75 | 3.56 | Moderately grading pyrite-dominated VMS |
| MUG26_038 | VMS | 369.7 | 388.3 | 18.6 | 4.48 | 1.7 | 17.2 | 0.80 | 6.13 | Thick zone of copper and gold mineralisation grading into footwall stringers |
| MUG26_042 | VMS | 387.3 | 398.8 | 11.6 | 2.94 | 2.5 | 19.1 | 0.78 | 5.23 | Copper-gold VMS |
| MUG26_046 | VMS | 391.0 | 395.5 | 4.5 | 3.05 | 3.1 | 30.9 | 1.61 | 6.09 | Polymetallic copper-gold VMS intersection with high silver grade |
Table 4: Drill results from the 900L Crosscuts 7 and 8. All results presented are approximate true thickness unless otherwise stated.
900L Crosscuts 5 and 6
The 900L crosscuts 5 and 6 are the northern-most drill positions in the 805L exploration drive. Drilling completed from crosscuts 5 and 6 reported in this announcement focused on the conversion of Inferred Mineral Resources to the higher confidence M&I category for inclusion in the upcoming economic studies.
The drilling successfully demonstrated continuity of the convergent high-grade core zone, with notable intersections including 42.0m @ 6.1% CuEq, 51.5m @ 4.9% CuEq, 34.4m @ 5.0% CuEq and 50.2m @ 4.0% CuEq.
Infill drilling of the footwall stringer zone successfully confirmed thick and continuous mineralisation with key intersections including 25.3m @ 3.8% CuEq, 35.7m @ 3.3% CuEq and 30.1m @ 2.1% CuEq.
A summary of the results of drilling from the 900L Crosscuts 5 and 6 is presented in Table 5.
| Hole Number | Style | From (m) |
To (m) |
Width (m) |
Assay | CuEq % |
Comments | |||
| Cu % | Au g/t | Ag g/t | Zn % | |||||||
| MUG25_247 | VMS | 441.8 | 444.1 | 2.3 | 3.68 | 5.9 | 64.8 | 0.62 | 9.12 | Thin high-grade upper VMS zone with multiple lower footwall stringer intersections |
| FWZ | 533.2 | 539.0 | 5.9 | 1.52 | 0.2 | 1.7 | 0.15 | 1.71 | ||
| FWZ | 555.0 | 579.0 | 24.0 | 1.00 | 0.1 | 1.0 | 0.01 | 1.06 | ||
| FWZ | 602.5 | 622.0 | 19.6 | 1.40 | 0.1 | 1.9 | 0.01 | 1.45 | ||
| MUG25_258 | FWZ | 517.0 | 529.0 | 12.0 | 1.33 | 0.2 | 1.3 | 0.10 | 1.51 | Multiple footwall stringer style intersections highlighted by a thick zone grading 31.3m @ 2.1% CuEq from 628.8m |
| FWZ | 557.3 | 566.0 | 8.7 | 1.82 | 0.2 | 1.9 | 0.03 | 2.04 | ||
| FWZ | 598.0 | 603.2 | 5.2 | 1.39 | 0.1 | 1.2 | 0.01 | 1.46 | ||
| FWZ | 628.8 | 660.0 | 31.3 | 1.97 | 0.1 | 2.4 | 0.01 | 2.07 | ||
| MUG25_266 | VMS | 457.0 | 459.9 | 2.9 | 1.81 | 0.9 | 10.3 | 3.56 | 3.19 | Thin upper VMS underlain by two thick FW stringer zones both grading over 2% CuEq |
| FWZ | 512.0 | 529.8 | 17.8 | 1.86 | 0.4 | 2.6 | 0.02 | 2.18 | ||
| FWZ | 536.3 | 573.0 | 36.8 | 1.98 | 0.1 | 1.8 | 0.11 | 2.08 | ||
| MUG25_276 | VMS | 464.3 | 469.0 | 4.8 | 0.87 | 1.5 | 13.6 | 0.90 | 2.38 | Gold-dominant pyritic VMS above multiple FW stringer zone intersections |
| VMS | 473.0 | 479.0 | 6.0 | 3.53 | 2.1 | 28.9 | 0.58 | 5.58 | ||
| FWZ | 567.0 | 599.0 | 32.0 | 1.41 | 0.1 | 1.5 | 0.18 | 1.50 | ||
| FWZ | 607.0 | 613.0 | 6.0 | 1.62 | 0.1 | 2.5 | 0.15 | 1.74 | ||
| MUG25_278 | VMS | 460.8 | 468.2 | 7.4 | 2.14 | 1.2 | 8.6 | 0.82 | 3.33 | Strong upper VMS over two thick coherent zones of footwall stringer veins |
| FWZ | 484.1 | 519.8 | 35.7 | 3.07 | 0.2 | 3.2 | 0.04 | 3.27 | ||
| FWZ | 531.1 | 548.7 | 17.6 | 1.64 | 0.1 | 1.2 | 0.04 | 1.74 | ||
| MUG25_281 | VMS | 509.2 | 518.4 | 9.2 | 1.79 | 4.9 | 21.5 | 0.49 | 6.09 | Gold-dominated thick VMS with two coherent zones of stringer mineralisation |
| FWZ | 580.5 | 588.5 | 8.0 | 2.09 | 0.2 | 1.7 | 0.11 | 2.33 | ||
| FWZ | 612.8 | 642.9 | 30.1 | 1.92 | 0.1 | 2.0 | 0.32 | 2.06 | ||
| MUG25_285 | VMS / FWZ | 461.1 | 506.4 | 45.3 | 2.61 | 0.4 | 4.3 | 0.29 | 3.01 | Convergent zone with a high-grade upper VMS transitioning immediately into FW stringers |
| MUG26_005 | VMS | 452.9 | 457.3 | 4.4 | 0.79 | 2.6 | 26.8 | 0.59 | 3.23 | Gold-dominated upper VMS with multiple lower-grade stringer intersections between ~513m and 634m |
| FWZ | 513.3 | 519.0 | 5.7 | 1.57 | 0.2 | 2.7 | 0.13 | 1.79 | ||
| FWZ | 570.1 | 582.0 | 12.0 | 1.27 | 0.1 | 1.1 | 0.01 | 1.33 | ||
| FWZ | 595.0 | 602.8 | 7.8 | 1.12 | 0.0 | 1.1 | 0.01 | 1.17 | ||
| FWZ | 607.2 | 634.0 | 26.8 | 1.35 | 0.1 | 1.7 | 0.01 | 1.42 | ||
| MUG26_008 | VMS | 484.2 | 489.9 | 5.8 | 2.90 | 0.4 | 6.0 | 0.25 | 3.30 | Upper massive sulphide horizon with a high-grade upper footwall stringer zone ~24m beneath the VMS |
| FWZ | 513.3 | 538.5 | 25.3 | 3.54 | 0.3 | 3.8 | 0.06 | 3.79 | ||
| FWZ | 561.1 | 568.0 | 6.9 | 1.88 | 0.1 | 1.5 | 0.06 | 1.98 | ||
| MUG26_022 | VMS | 506.2 | 510.1 | 3.9 | 2.51 | 4.3 | 65.1 | 0.86 | 6.72 | Copper-gold VMS with multiple FWZ intersections |
| FWZ | 550.3 | 553.1 | 2.8 | 2.19 | 0.2 | 2.4 | 0.05 | 2.39 | ||
| FWZ | 563.3 | 575.9 | 12.6 | 1.55 | 0.4 | 2.1 | 0.02 | 1.88 | ||
| FWZ | 588.6 | 608.0 | 19.4 | 1.84 | 0.1 | 1.8 | 0.14 | 1.95 | ||
| MUG26_028 | VMS / FWZ | 436.9 | 471.3 | 34.4 | 3.81 | 1.2 | 11.0 | 0.56 | 4.98 | Convergent Core Zone including an upper VMS zone grading 14.3m @ 7.6% CuEq |
| Including | VMS | 436.9 | 451.2 | 14.3 | 5.16 | 2.5 | 21.4 | 1.21 | 7.62 | |
| MUG26_036 | VMS / FWZ | 425.9 | 476.1 | 50.2 | 3.50 | 0.4 | 5.1 | 0.73 | 3.97 | High-grade convergent Core Zone with VMS immediately grading into a high-grade enriched FW stringer zone grading 32.4m @ 4.7% CuEq |
| Including | VMS | 425.9 | 437.7 | 11.8 | 2.25 | 0.6 | 7.4 | 2.87 | 3.22 | |
| Including | FWZ | 443.7 | 476.1 | 32.4 | 4.52 | 0.1 | 1.6 | 0.02 | 4.66 | |
| MUG26_040 | VMS | 571.0 | 573.0 | 2.0 | 3.21 | 1.9 | 7.7 | 0.20 | 4.89 | Thin upper VMS over multiple zones of stringer mineralisation |
| FWZ | 604.0 | 612.0 | 8.0 | 2.06 | 0.3 | 2.3 | 0.10 | 2.34 | ||
| FWZ | 625.0 | 628.0 | 3.0 | 4.04 | 0.3 | 4.3 | 0.02 | 4.35 | ||
| MUG26_044 | VMS | 468.2 | 494.1 | 25.9 | 5.48 | 1.0 | 8.4 | 0.21 | 6.43 | High-grade thick VMS zone with some FW stringers towards the base |
| MUG26_045 | VMS | 453.4 | 457.0 | 3.6 | 1.96 | 0.6 | 5.8 | 0.33 | 2.54 | Moderate VMS |
| MUG26_053 | VMS / FWZ | 413.1 | 455.1 | 42.0 | 4.74 | 1.4 | 10.0 | 0.84 | 6.13 | Core Zone with an extremely high- grade upper VMS grading 9.8m @ 16.5% CuEq |
| Including | VMS | 421.6 | 431.4 | 9.8 | 12.68 | 4.0 | 27.8 | 1.60 | 16.46 | |
| MUG26_054 | VMS / FWZ | 404.7 | 456.1 | 51.5 | 3.99 | 0.9 | 9.0 | 0.87 | 4.91 | Core Zone with a high-grade zone grading 17m @ 9.1% CuEq |
| Including | VMS | 415.0 | 432.0 | 17.0 | 7.48 | 1.7 | 17.4 | 0.72 | 9.09 | |
Table 5: Drill results from the 900L Crosscuts 5 and 6. All results presented are approximate true thickness unless otherwise stated.
2026 Forward Work Plans
The FireFly growth strategy remains focused on advancing the Green Bay project towards the resumption of upscaled copper and gold production. Near term activities remain focused on:
Green Bay (Ming Mine) Mineral Resource Development
As of 31 May 2026, the Company had completed ~192,000 metres of underground diamond drilling. Six underground rigs will continue to advance the underground Mineral Resource conversion and extension activities for the foreseeable future.
Near-term underground drilling will remain focused on infill definition to upgrade areas of Inferred to the higher confidence M&I Mineral Resources ahead of economic studies into resuming upscaled production at Green Bay. The decision to focus on infill drilling is driven by numerous factors, including:
Green Bay (Ming Mine) Mineral Resource Growth
Mineral Resource growth in coming months will be driven by testing down plunge extensions of the high-grade VMS channels parallel to the Ming North lode. Drilling in this announcement shows the 1806 VMS continues at depth and Mineral Resource additions are expected from this zone.
A MRE update is planned and will incorporate drilling completed since the issue of the previous estimate in November 2025. This update will be the estimate used to complete the first economic studies.
Economic Studies
Economic and technical studies on the upscaled resumption of copper and gold production at Green Bay are well underway.
The study, intended for completion in July/August 2026, will meet the criteria of a Scoping Study (in the 2012 Edition of the Australasian Code for Reporting of Exploration Results, Mineral Resources and Ore Reserves) and Preliminary Economic Assessment (in Canadian National Instrument NI 43-101 – Standards of Disclosure for Mineral Projects).
The study will consider various development scenarios for the project, including several haulage scenarios (e.g., shaft, decline), annual production rates (scale), and life of mine metal production.
Project Development
The Company has secured conditional release from further Environmental Assessment by the Province of Newfoundland and Labrador for a start-up mining and processing operation (see ASX announcement dated 5 August 2025). FireFly has now satisfied conditions of the release and has commenced applying for permits. The Company has commenced selective low-cost seasonal early works to prepare the Project for future development and construction.
Regional & Generative Exploration
Regional exploration is accelerating following a scheduled winter hiatus. Recent activity has focused on target generation incorporating both geophysics survey and interpretation, prospecting programs and compilation of historic datasets. Two surface diamond drill rigs are currently testing geophysical anomalies in the areas south of the Ming Mine. A third surface rig has commenced drilling at the Company’s Tilt Cove project.
Balance Sheet and Funding Position
FireFly is well-funded to execute its growth drilling program, economic studies and pre-construction early works activities. As at 31 March 2026, the Company has approximately A$219.9 million in cash and liquid investments.
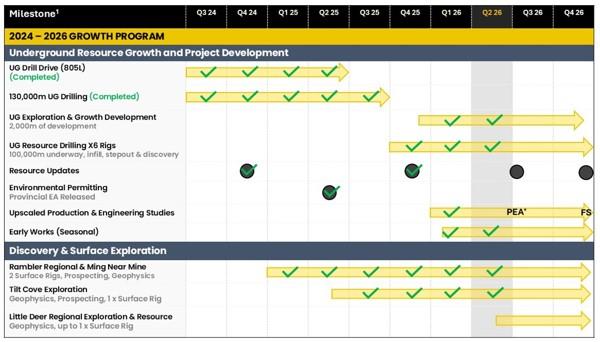
Figure 3: Timeline of key activities at the Green Bay copper-gold project.
1. Please note that timeframes are indicative and may be subject to change.
ABOUT FIREFLY METALS LTD
FireFly Metals Ltd is an emerging copper-gold company focused on advancing the high-grade Green Bay Copper-Gold Project in Newfoundland, Canada. The Green Bay Copper-Gold Project currently hosts 50.4Mt of Measured and Indicated Mineral Resources at 2.0% for 1,016Kt copper equivalent and 29.3Mt of Inferred Mineral Resources at 2.5% for 722Kt CuEq, prepared and disclosed in accordance with the 2012 Edition of the Australasian Code for Reporting of Exploration Results, Mineral Resources and Ore Reserves and Canadian National Instrument 43-101 – Standards of Disclosure for Mineral Projects. The Company has a clear strategy to rapidly grow the copper-gold Mineral Resource to demonstrate a globally significant copper-gold asset.
The Company also holds a 90% interest in the Limestone Well Vanadium-Titanium Project in Western Australia.
APPENDIX A
Green Bay Copper-Gold Project Mineral Resource Estimate
Ming Deposit Mineral Resource Estimate
| TONNES | COPPER | GOLD | SILVER | CuEq | ||||
| (Mt) | Grade | Metal | Grade | Metal | Grade | Metal | Grade | |
| (%) | (‘000 t) | (g/t) | (‘000 oz) | (g/t) | (‘000 oz) | (%) | ||
| Measured | 6.3 | 1.5 | 94 | 0.3 | 50 | 1.9 | 388 | 1.7 |
| Indicated | 41.2 | 1.7 | 708 | 0.4 | 488 | 3.2 | 4,320 | 2.1 |
| TOTAL M&I | 47.5 | 1.7 | 802 | 0.4 | 537 | 3.1 | 4,708 | 2.0 |
| Inferred | 23.1 | 2.0 | 456 | 0.7 | 553 | 5.9 | 4,379 | 2.6 |
Little Deer Mineral Resource Estimate
| TONNES | COPPER | GOLD | SILVER | CuEq | ||||
| (Mt) | Grade | Metal | Grade | Metal | Grade | Metal | Grade | |
| (%) | (‘000 t) | (g/t) | (‘000 oz) | (g/t) | (‘000 oz) | (%) | ||
| Measured | – | – | – | – | – | – | – | – |
| Indicated | 2.9 | 2.1 | 62 | 0.1 | 9 | 3.4 | 320 | 2.3 |
| TOTAL M&I | 2.9 | 2.1 | 62 | 0.1 | 9 | 3.4 | 320 | 2.3 |
| Inferred | 6.2 | 1.8 | 110 | 0.1 | 10 | 2.2 | 430 | 1.8 |
GREEN BAY TOTAL MINERAL RESOURCE ESTIMATE
| TONNES | COPPER | GOLD | SILVER | CuEq | ||||
| (Mt) | Grade | Metal | Grade | Metal | Grade | Metal | Grade | |
| (%) | (‘000 t) | (g/t) | (‘000 oz) | (g/t) | (‘000 oz) | (%) | ||
| Measured | 6.3 | 1.5 | 94 | 0.3 | 50 | 1.9 | 388 | 1.7 |
| Indicated | 44.1 | 1.7 | 769 | 0.4 | 496 | 3.3 | 4,638 | 2.1 |
| TOTAL M&I | 50.4 | 1.7 | 863 | 0.3 | 546 | 3.1 | 5,026 | 2.0 |
| Inferred | 29.3 | 1.9 | 566 | 0.6 | 563 | 5.1 | 4,810 | 2.5 |
APPENDIX B – Significant Intersection Table
Collar co-ordinates and orientation are listed in the local Ming Mine grid, which is rotated +35 degrees from NAD83 True North. Significant intersections reported are those above a 1% copper cut-off or 0.5g/t gold, and contain a maximum of 6 metres of internal waste. Please refer to the compliance statements for further details on parameters used in the copper equivalent calculation. All results are approximate true width (TW) unless otherwise noted.
| Hole Number | Easting | Northing | RL | Azi | Dip | Drilled Length (m) | From (m) | To (m) |
Width (m) |
Assay | CuEq % | |||
| Cu % | Au g/t | Ag g/t | Zn % | |||||||||||
| MUG25_235 | 1,206.9 | 2,355.8 | -917.0 | 182 | – 68 | 234 | Abandoned due to excessive downhole deviation | |||||||
| MUG25_242 | 1,137.5 | 1,972.0 | -842.4 | 210 | 5 | 15 | Abandoned due to excessive downhole deviation | |||||||
| MUG25_246 | 1,117.0 | 2,190.3 | -894.0 | 215 | -67 | 357 | 314.3 | 318.4 | 4.1 | 5.40 | 2.0 | 13.8 | 1.14 | 7.33 |
| MUG25_247 | 1,255.5 | 2,355.8 | -916.9 | 176 | -70 | 690 | 441.8 | 444.1 | 2.3 | 3.68 | 5.9 | 64.8 | 0.62 | 9.12 |
| 498.0 | 501.5 | 3.5 | 1.33 | 0.5 | 1.8 | 0.07 | 1.75 | |||||||
| 533.2 | 539.0 | 5.9 | 1.52 | 0.2 | 1.7 | 0.15 | 1.71 | |||||||
| 555.0 | 579.0 | 24.0 | 1.00 | 0.1 | 1.0 | 0.01 | 1.06 | |||||||
| 602.5 | 622.0 | 19.6 | 1.40 | 0.1 | 1.9 | 0.01 | 1.45 | |||||||
| MUG25_248 | 1,137.5 | 1,972.0 | -842.4 | 224 | -5 | 45 | Abandoned due to excessive downhole deviation | |||||||
| MUG25_250 | 1,222.1 | 2,255.1 | -906.4 | 162 | -63 | 615 | 505.9 | 511.8 | 5.9 | 1.56 | 0.1 | 1.4 | 0.04 | 1.64 |
| 528.8 | 539.0 | 10.2 | 1.79 | 0.1 | 1.5 | 0.02 | 1.87 | |||||||
| 546.3 | 562.4 | 16.2 | 1.31 | 0.1 | 1.3 | 0.02 | 1.37 | |||||||
| 567.5 | 579.4 | 11.9 | 1.59 | 0.1 | 1.7 | 0.03 | 1.66 | |||||||
| MUG25_251 | 1,117.0 | 2,190.3 | -894.0 | 223 | -75 | 15 | Abandoned due to excessive downhole deviation | |||||||
| MUG25_255 | 1,117.0 | 2,190.3 | -894.0 | 223 | -57 | 357 | 319.8 | 330.3 | 10.5 | 3.05 | 1.8 | 16.5 | 1.50 | 4.86 |
| MUG25_256 | 1,255.5 | 2,355.8 | -916.9 | 172 | -76 | 45 | Abandoned due to excessive downhole deviation | |||||||
| MUG25_257 | 1,137.5 | 1,972.0 | -842.4 | 226 | -9 | 363 | 285.1 | 287.4 | 2.3 (1.6m TW) |
3.20 | 4.9 | 31.3 | 1.36 | 7.68 |
| 291.4 | 296.7 | 5.3 (4.8m TW) |
0.80 | 1.6 | 6.2 | 0.24 | 2.17 | |||||||
| MUG25_258 | 1,255.5 | 2,355.8 | -916.9 | 172 | -76 | 696 | 517.0 | 529.0 | 12.0 | 1.33 | 0.2 | 1.3 | 0.10 | 1.51 |
| 557.3 | 566.0 | 8.7 | 1.82 | 0.2 | 1.9 | 0.03 | 2.04 | |||||||
| 598.0 | 603.2 | 5.2 | 1.39 | 0.1 | 1.2 | 0.01 | 1.46 | |||||||
| 611.0 | 614.0 | 3.0 | 1.20 | 0.0 | 0.9 | 0.01 | 1.24 | |||||||
| 628.8 | 660.0 | 31.3 | 1.97 | 0.1 | 2.4 | 0.01 | 2.07 | |||||||
| MUG25_260 | 1,117.0 | 2,190.3 | -894.0 | 227 | -64 | 381 | 322.8 | 332.5 | 9.8 | 5.04 | 1.8 | 12.9 | 1.34 | 6.80 |
| MUG25_261 | 1,056.9 | 2,298.9 | -899.7 | 185 | -79 | 450 | 400.3 | 403.4 | 3.1 | 7.99 | 2.6 | 19.0 | 1.65 | 10.55 |
| MUG25_262 | 1,137.5 | 1,972.0 | -842.4 | 229 | -15 | 375 | 262.9 | 269.2 | 6.3 (4.4m TW) |
1.72 | 1.4 | 11.7 | 0.83 | 3.08 |
| MUG25_263 | 1,117.0 | 2,190.3 | -894.0 | 235 | -70 | 414 | 342.1 | 345.0 | 2.9 | 1.25 | 0.5 | 3.3 | 0.60 | 1.78 |
| MUG25_264 | 1,137.5 | 1,972.0 | -842.4 | 234 | -22 | 375 | 254.8 | 261.6 | 6.8 (4.8m TW) |
2.49 | 2.5 | 28.7 | 2.24 | 5.12 |
| MUG25_265 | 1,117.0 | 2,190.3 | -894.0 | 227 | -51 | 360 | 326.5 | 330.3 | 3.8 | 2.43 | 1.2 | 13.9 | 1.98 | 3.82 |
| MUG25_266 | 1,185.8 | 2,352.2 | -916.1 | 175 | -74 | 641 | 457.0 | 459.9 | 2.9 | 1.81 | 0.9 | 10.3 | 3.56 | 3.19 |
| 476.7 | 478.7 | 2.0 | 1.91 | 0.3 | 3.9 | 0.05 | 2.21 | |||||||
| 484.6 | 486.8 | 2.2 | 1.66 | 0.1 | 2.6 | 0.09 | 1.77 | |||||||
| 512.0 | 529.8 | 17.8 | 1.86 | 0.4 | 2.6 | 0.02 | 2.18 | |||||||
| 536.3 | 573.0 | 36.8 | 1.98 | 0.1 | 1.8 | 0.11 | 2.08 | |||||||
| MUG25_267 | 1,056.9 | 2,298.9 | -899.7 | 193 | -74 | 429 | 390.1 | 399.4 | 9.3 | 5.10 | 1.6 | 20.3 | 2.94 | 7.00 |
| MUG25_268 | 1,096.0 | 2,286.3 | -899.1 | 162 | -72 | 48 | Abandoned due to excessive downhole deviation | |||||||
| MUG25_269 | 1,255.5 | 2,355.8 | -916.9 | 187 | -75 | 210 | Abandoned due to excessive downhole deviation | |||||||
| MUG25_270 | 1,117.0 | 2,190.3 | -894.0 | 233 | -57 | 375 | 329.4 | 338.8 | 9.4 | 2.66 | 1.4 | 12.5 | 2.03 | 4.26 |
| 340.5 | 348.0 | 7.5 | 0.03 | 1.1 | 7.4 | 0.56 | 1.08 | |||||||
| MUG25_271 | 1,096.0 | 2,286.3 | -899.1 | 162 | -72 | 147 | Abandoned due to excessive downhole deviation | |||||||
| MUG25_272 | 1,137.5 | 1,972.0 | -842.4 | 223 | 7 | 540 | 465.2 | 489.8 | 24.7 (16.0m TW) |
1.39 | 2.6 | 20.8 | 0.38 | 3.74 |
| 501.4 | 504.0 | 2.6 (1.7m TW) |
4.38 | 9.9 | 38.3 | 1.80 | 13.14 | |||||||
| MUG25_273 | 1,056.9 | 2,298.9 | -899.7 | 197 | -68 | 408 | 375.9 | 378.2 | 2.3 | 4.04 | 1.4 | 14.9 | 0.56 | 5.41 |
| 391.1 | 396.9 | 5.8 | 1.95 | 0.8 | 4.2 | 0.17 | 2.66 | |||||||
| MUG25_274 | 1,255.5 | 2,355.8 | -916.9 | 187 | -75 | 15 | Abandoned due to excessive downhole deviation | |||||||
| MUG25_275 | 1,096.0 | 2,286.3 | -899.1 | 162 | -72 | 143 | Abandoned due to excessive downhole deviation | |||||||
| MUG25_276 | 1,255.5 | 2,355.8 | -916.9 | 187 | -75 | 711 | 464.3 | 469.0 | 4.8 | 0.87 | 1.5 | 13.6 | 0.90 | 2.38 |
| 473.0 | 479.0 | 6.0 | 3.53 | 2.1 | 28.9 | 0.58 | 5.58 | |||||||
| 543.9 | 547.0 | 3.1 | 1.31 | 0.1 | 1.1 | 0.16 | 1.42 | |||||||
| 567.0 | 599.0 | 32.0 | 1.41 | 0.1 | 1.5 | 0.18 | 1.50 | |||||||
| 607.0 | 613.0 | 6.0 | 1.62 | 0.1 | 2.5 | 0.15 | 1.74 | |||||||
| MUG25_277 | 1,117.0 | 2,190.3 | -894.0 | 230 | -64 | 375 | 329.5 | 341.3 | 11.8 | 2.32 | 1.2 | 11.2 | 1.56 | 3.62 |
| MUG25_278 | 1,185.8 | 2,352.2 | -916.1 | 175 | -78 | 642 | 460.8 | 468.2 | 7.4 | 2.14 | 1.2 | 8.6 | 0.82 | 3.33 |
| 484.1 | 519.8 | 35.7 | 3.07 | 0.2 | 3.2 | 0.04 | 3.27 | |||||||
| 531.1 | 548.7 | 17.6 | 1.64 | 0.1 | 1.2 | 0.04 | 1.74 | |||||||
| MUG25_279 | 1,096.0 | 2,286.3 | -899.1 | 162 | -72 | 471 | 384.2 | 401.9 | 17.8 | 5.40 | 1.3 | 15.8 | 0.36 | 6.69 |
| 413.0 | 415.0 | 2.0 | 1.85 | 0.1 | 1.7 | 0.06 | 1.99 | |||||||
| 423.1 | 426.0 | 2.9 | 1.36 | 0.1 | 1.1 | 0.18 | 1.49 | |||||||
| MUG25_280 | 1,056.9 | 2,298.9 | -899.7 | 205 | -64 | 411 | 383.5 | 387.7 | 4.2 | 2.71 | 1.1 | 13.4 | 2.96 | 4.20 |
| MUG25_281 | 1,255.5 | 2,355.8 | -916.9 | 190 | -83 | 753 | 509.2 | 518.4 | 9.2 | 1.79 | 4.9 | 21.5 | 0.49 | 6.09 |
| 580.5 | 588.5 | 8.0 | 2.09 | 0.2 | 1.7 | 0.11 | 2.33 | |||||||
| 595.0 | 598.0 | 3.0 | 1.27 | 0.1 | 1.1 | 0.09 | 1.38 | |||||||
| 612.8 | 642.9 | 30.1 | 1.92 | 0.1 | 2.0 | 0.32 | 2.06 | |||||||
| 725.4 | 728.4 | 3.0 | 1.56 | 0.3 | 4.6 | 0.04 | 1.81 | |||||||
| MUG25_282 | 1,185.8 | 2,352.2 | -916.1 | 190 | -78 | 15 | Abandoned due to excessive downhole deviation | |||||||
| MUG25_283 | 1,117.0 | 2,190.3 | -894.0 | 236 | -43 | 438 | 365.3 | 369.2 | 3.9 | 1.39 | 1.2 | 16.8 | 0.67 | 2.62 |
| MUG25_284 | 1,056.9 | 2,298.9 | -899.7 | 206 | -78 | 36 | Abandoned due to excessive downhole deviation | |||||||
| MUG25_285 | 1,185.8 | 2,352.2 | -916.1 | 190 | -78 | 575 | 461.1 | 506.4 | 45.3 | 2.61 | 0.4 | 4.3 | 0.29 | 3.01 |
| MUG26_001 | 1,137.5 | 1,972.0 | -842.4 | 232 | 8 | 547 | 526.8 | 528.8 | 2.0 (1.2m TW) |
1.17 | 0.1 | 1.2 | 0.06 | 1.26 |
| MUG26_002 | 964.7 | 2,163.4 | -877.5 | 192 | -20 | 357 | 308.2 | 315.2 | 7.0 (5.6m TW) |
4.62 | 2.7 | 27.3 | 0.40 | 7.09 |
| MUG26_003 | 1,056.9 | 2,298.9 | -899.7 | 206 | -78 | 432 | 404.0 | 416.8 | 12.8 | 3.02 | 2.0 | 12.6 | 3.33 | 5.28 |
| MUG26_004 | 1,096.0 | 2,286.3 | -899.1 | 159 | -73 | 72 | Abandoned due to excessive downhole deviation | |||||||
| MUG26_005 | 1,255.5 | 2,355.8 | -916.9 | 179 | -73 | 690 | 452.9 | 457.3 | 4.4 | 0.79 | 2.6 | 26.8 | 0.59 | 3.23 |
| 513.3 | 519.0 | 5.7 | 1.57 | 0.2 | 2.7 | 0.13 | 1.79 | |||||||
| 546.5 | 550.0 | 3.5 | 1.55 | 0.2 | 1.9 | 0.04 | 1.70 | |||||||
| 570.1 | 582.0 | 12.0 | 1.27 | 0.1 | 1.1 | 0.01 | 1.33 | |||||||
| 595.0 | 602.8 | 7.8 | 1.12 | 0.0 | 1.1 | 0.01 | 1.17 | |||||||
| 607.2 | 634.0 | 26.8 | 1.35 | 0.1 | 1.7 | 0.01 | 1.42 | |||||||
| MUG26_006 | 1,096.0 | 2,286.3 | -899.1 | 155 | -73 | 15 | Abandoned due to excessive downhole deviation | |||||||
| MUG26_007 | 1,056.9 | 2,298.9 | -899.7 | 209 | -72 | 9 | Abandoned due to excessive downhole deviation | |||||||
| MUG26_008 | 1,185.8 | 2,352.2 | -916.1 | 191 | -89 | 620 | 484.2 | 489.9 | 5.8 | 2.90 | 0.4 | 6.0 | 0.25 | 3.30 |
| 513.3 | 538.5 | 25.3 | 3.54 | 0.3 | 3.8 | 0.06 | 3.79 | |||||||
| 561.1 | 568.0 | 6.9 | 1.88 | 0.1 | 1.5 | 0.06 | 1.98 | |||||||
| MUG26_009 | 1,056.9 | 2,298.9 | -899.7 | 209 | -72 | 423 | No Significant Assays | |||||||
| MUG26_010 | 1,096.0 | 2,286.3 | -899.1 | 155 | -73 | 6 | Abandoned due to excessive downhole deviation | |||||||
| MUG26_011 | 1,096.0 | 2,286.3 | -899.1 | 155 | -73 | 22 | Abandoned due to excessive downhole deviation | |||||||
| MUG26_012 | 964.7 | 2,163.4 | -877.5 | 191 | -38 | 330 | No Significant Assays | |||||||
| MUG26_013 | 1,096.0 | 2,286.3 | -899.1 | 155 | -73 | 453 | 375.0 | 395.7 | 20.7 | 5.90 | 1.9 | 14.1 | 0.74 | 7.71 |
| 411.0 | 416.8 | 5.8 | 3.39 | 0.2 | 3.8 | 0.22 | 3.63 | |||||||
| MUG26_014 | 1,137.5 | 1,972.0 | -842.4 | 230 | -4 | 429 | No Significant Assays | |||||||
| MUG26_015 | 1,056.9 | 2,298.9 | -899.7 | 213 | -67 | 414 | 389.5 | 400.0 | 10.6 | 3.72 | 1.7 | 20.0 | 3.57 | 5.82 |
| MUG26_016 | 964.7 | 2,163.4 | -877.5 | 200 | -36 | 351 | No Significant Assays | |||||||
| MUG26_017 | 1,255.5 | 2,355.8 | -916.9 | 190 | -87 | 111 | Abandoned due to excessive downhole deviation | |||||||
| MUG26_018 | 962.6 | 2,163.8 | -877.0 | 209 | -36 | 348 | No Significant Assays | |||||||
| MUG26_019 | 1,185.8 | 2,352.2 | -916.1 | 197 | -75 | 51 | Abandoned due to excessive downhole deviation | |||||||
| MUG26_020 | 1,056.9 | 2,298.9 | -899.7 | 222 | -75 | 459 | No Significant Assays | |||||||
| MUG26_021 | 1,255.5 | 2,355.8 | -916.9 | 190 | -87 | 21 | Abandoned due to excessive downhole deviation | |||||||
| MUG26_022 | 1,255.5 | 2,355.8 | -916.9 | 190 | -87 | 657 | 506.2 | 510.1 | 3.9 | 2.51 | 4.3 | 65.1 | 0.86 | 6.72 |
| MUG26_022 | 550.3 | 553.1 | 2.8 | 2.19 | 0.2 | 2.4 | 0.05 | 2.39 | ||||||
| 556.8 | 559.4 | 2.6 | 1.12 | 0.0 | 1.2 | 0.02 | 1.17 | |||||||
| 563.3 | 575.9 | 12.6 | 1.55 | 0.4 | 2.1 | 0.02 | 1.88 | |||||||
| 588.6 | 608.0 | 19.4 | 1.84 | 0.1 | 1.8 | 0.14 | 1.95 | |||||||
| 615.5 | 618.8 | 3.3 | 1.10 | 0.0 | 1.0 | 0.06 | 1.15 | |||||||
| MUG26_023 | 964.7 | 2,163.4 | -877.5 | 185 | -49 | 339 | 273.2 | 281.7 | 8.6 (6.4m TW) |
1.80 | 2.0 | 20.7 | 2.97 | 4.05 |
| MUG26_024 | 1,096.0 | 2,286.3 | -899.1 | 166 | -78 | 16 | Abandoned due to excessive downhole deviation | |||||||
| MUG26_025 | 1,096.0 | 2,286.3 | -899.1 | 166 | -78 | 9 | Abandoned due to excessive downhole deviation | |||||||
| MUG26_026 | 1,096.0 | 2,286.3 | -899.1 | 166 | -78 | 25 | Abandoned due to excessive downhole deviation | |||||||
| MUG26_027 | 1,185.8 | 2,352.2 | -916.1 | 197 | -75 | 12 | Abandoned due to excessive downhole deviation | |||||||
| MUG26_028 | 1,185.8 | 2,352.2 | -916.1 | 197 | -75 | 531 | 436.9 | 471.3 | 34.4 | 3.81 | 1.2 | 11.0 | 0.56 | 4.98 |
| Including | 436.9 | 451.2 | 14.3 | 5.16 | 2.5 | 21.4 | 1.21 | 7.62 | ||||||
| MUG26_029 | 1,096.0 | 2,286.3 | -899.1 | 166 | -78 | 441 | 377.0 | 390.6 | 13.6 | 5.72 | 1.1 | 15.4 | 0.40 | 6.83 |
| MUG26_030 | 964.7 | 2,163.4 | -877.5 | 199 | -3 | 18 | Abandoned due to excessive downhole deviation | |||||||
| MUG26_031 | 1,056.9 | 2,298.9 | -899.7 | 205 | -58 | 408 | 373.5 | 382.7 | 9.2 | 2.18 | 1.0 | 14.6 | 2.75 | 3.56 |
| MUG26_032 | 1,137.5 | 1,972.0 | -842.4 | 235 | -7 | 414 | No Significant Assays | |||||||
| MUG26_033 | 964.7 | 2,163.4 | -877.5 | 199 | -3 | 426 | No Significant Assays | |||||||
| MUG26_034 | 1,096.0 | 2,286.3 | -899.1 | 171 | -84 | 444 | No Significant Assays | |||||||
| MUG26_035 | 1,137.5 | 1,972.0 | -842.4 | 212 | 2 | 75 | Abandoned due to excessive downhole deviation | |||||||
| MUG26_036 | 1,185.8 | 2,352.2 | -916.1 | 187 | -66 | 555 | 425.9 | 476.1 | 50.2 | 3.50 | 0.4 | 5.1 | 0.73 | 3.97 |
| Including | 425.9 | 437.7 | 11.8 | 2.25 | 0.6 | 7.4 | 2.87 | 3.22 | ||||||
| MUG26_036 | Including | 443.7 | 476.1 | 32.4 | 4.52 | 0.1 | 1.6 | 0.02 | 4.66 | |||||
| MUG26_037 | 964.7 | 2,163.4 | -877.5 | 205 | -2 | 441 | No Significant Assays | |||||||
| MUG26_038 | 1,062.6 | 2,299.0 | -899.2 | 194 | -62 | 423 | 369.7 | 388.3 | 18.6 | 4.48 | 1.7 | 17.2 | 0.80 | 6.13 |
| MUG26_039 | 1,137.5 | 1,972.0 | -842.4 | 212 | 4 | 420 | 340.9 | 347.0 | 6.1 (4.3m TW) |
4.40 | 3.7 | 27.9 | 1.33 | 7.91 |
| MUG26_040 | 1,255.5 | 2,355.8 | -916.9 | 40 | -87 | 780 | 571.0 | 573.0 | 2.0 | 3.21 | 1.9 | 7.7 | 0.20 | 4.89 |
| 604.0 | 612.0 | 8.0 | 2.06 | 0.3 | 2.3 | 0.10 | 2.34 | |||||||
| 625.0 | 628.0 | 3.0 | 4.04 | 0.3 | 4.3 | 0.02 | 4.35 | |||||||
| MUG26_041 | 1,137.5 | 1,972.0 | -842.4 | 221 | 5 | 474 | No Significant Assays | |||||||
| MUG26_042 | 1,062.6 | 2,299.0 | -899.2 | 206 | -29 | 477 | 387.3 | 398.8 | 11.6 (10.4m TW) |
2.94 | 2.5 | 19.1 | 0.78 | 5.23 |
| MUG26_043 | 964.7 | 2,163.4 | -877.5 | 210 | -1 | 477 | 422.8 | 425.3 | 2.4 (1.8m TW) |
0.38 | 2.2 | 13.7 | 0.06 | 2.29 |
| MUG26_044 | 1,185.8 | 2,352.2 | -916.1 | 191 | -81 | 657 | 468.2 | 494.1 | 25.9 | 5.48 | 1.0 | 8.4 | 0.21 | 6.43 |
| MUG26_045 | 1,174.0 | 2,400.0 | -916.1 | 198 | -68 | 507 | 453.4 | 457.0 | 3.6 | 1.96 | 0.6 | 5.8 | 0.33 | 2.54 |
| MUG26_046 | 1,062.6 | 2,299.0 | -899.2 | 209 | -38 | 438 | 391.0 | 395.5 | 4.5 | 3.05 | 3.1 | 30.9 | 1.61 | 6.09 |
| MUG26_047 | 964.7 | 2,163.4 | -877.5 | 196 | -12 | 15 | Abandoned due to excessive downhole deviation | |||||||
| MUG26_048 | 1,137.5 | 1,972.0 | -842.4 | 212 | 1 | 45 | Abandoned due to excessive downhole deviation | |||||||
| MUG26_049 | 1,185.8 | 2,352.2 | -916.1 | 198 | -70 | 15 | Abandoned due to excessive downhole deviation | |||||||
| MUG26_050 | 1,174.0 | 2,400.0 | -916.1 | 210 | -65 | 489 | No Significant Assays | |||||||
| MUG26_051 | 964.7 | 2,163.4 | -877.5 | 196 | -12 | 411 | No Significant Assays | |||||||
| MUG26_052 | 1,185.8 | 2,352.2 | -916.1 | 198 | -70 | 15 | Abandoned due to excessive downhole deviation | |||||||
| MUG26_053 | 1,185.8 | 2,352.2 | -916.1 | 198 | -70 | 534 | 413.1 | 455.1 | 42.0 | 4.74 | 1.4 | 10.0 | 0.84 | 6.13 |
| Including | 421.6 | 431.4 | 9.8 | 12.68 | 4.0 | 27.8 | 1.60 | 16.46 | ||||||
| MUG26_054 | 1,255.5 | 2,355.8 | -916.9 | 202 | -51 | 495 | 404.7 | 456.1 | 51.5 | 3.99 | 0.9 | 9.0 | 0.87 | 4.91 |
| Including | 415.0 | 432.0 | 17.0 | 7.48 | 1.7 | 17.4 | 0.72 | 9.09 | ||||||
| MUG26_055 | 964.9 | 2,163.3 | -877.5 | 198 | -49 | 15 | Abandoned due to excessive downhole deviation | |||||||
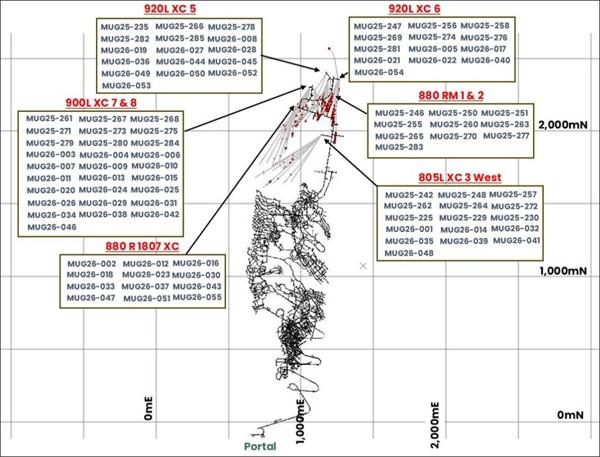
Plan view of drilling in this announcement
Gemdale Gold Inc. (TSX-V: GEMG) (OTCQB: GDGIF) is pleased to anno... READ MORE
Nations Royalty Corp. (TSX-V: NRC) (OTCQX: NRYCF) (FSE: Y96) is p... READ MORE
Cambria Gold Mines Inc. (TSX-V: CAMB) (OTCQX: CAMVF) is pleased t... READ MORE
SAGA Metals Corp. (TSX-V: SAGA) (OTCQB: SAGMF) (FSE: 20H) a Nor... READ MORE
Mercado Minerals Ltd. (CSE: MERC) (OTCQB: MRMNF) announces drill ... READ MORE


