


-Paydirt editor Doug Hornig is back with an insightful chart on gold’s surges in the bull market so far, what technical analysis says is the intermediate top in the gold price, and how the diggers are on board, too…
Is your head spinning?
Mine, too.
The Calm Within the Storm
The past year has been a whirlwind of craziness: a presidential election with one candidate dropping out and the other winning handily; a continuing orgy of money creation; inflation that is or isn’t a problem, depending on whom you ask; an economy that is either booming or cratering, again depending; two major wars raging; an upheaval in international trade; historical alliances under threat; tariffs on, tariffs off; the rise of openly socialist politicians, both here and abroad.
And did I mention the federal debt careening past $37 trillion, with not the slightest intent in Washington to bring it down?
Whew.
Somewhere in there, is there one element of stability? There is. We are in the midst of a bull run in gold that has held steady through it all. And this year, those who pull it from the ground have joined the party. Let’s take a closer look, beginning with the gold price itself.
My old pal Jeff Clark dates the current surge to February of 2024. In his opinion, the current leg of the bull market began on Leap Year Day of ’24, because “the day before the Fed came out and said, ‘we’re going to raise rates more often than we said.’ That’s since changed, of course, but … gold ignited the next day and essentially has never looked back. It’s never had more than a 6% correction since then.”
Yep. This chart reveals just how consistent it’s been:
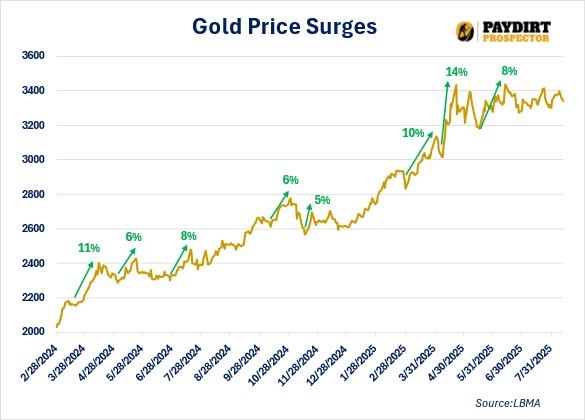
As you can see, every downturn has been followed by a significant uptick, and then consolidation—a narrow trading range with a solid floor, such as we are in now. Call it a holding pattern, for the time being.
The price was $2049/oz. at the beginning of this chart. It’s at $3383 as I write on August 14. That’s a tidy 65% gain. Since the beginning of 2025 alone, the gain is 27% as I write.
A Few Fundamentals
So, will that line continue northward? All but certainly.
Most likely, regular readers already understand the many macro factors driving the bull:
In addition, monetary inflation gallops ahead and checkout-line inflation remains sticky, while the value of the dollar is in decline as countries around the globe “de-dollarize.” (Gold and the dollar tend to move inversely—but gold can even gain in tandem with a rising dollar in systemic risk scenarios like we have today.)
Expectations of Fed rate cuts are high. Cuts tend to push the gold price higher, but simply holding rates steady is gold-positive. Downward pressure would only come with rate increases. That seems off the table as long as Powell is Chair—and his replacement next year is highly likely to be even more averse to raising rates.
All of these things strengthen gold’s attractiveness and fuel a demand for the metal as the ultimate safe haven in troubled times.
How powerful that trend is, can be seen in the fact that the central banks of China, India and Russia (and many smaller ones) continue accumulating gold at a rapid pace. And demand for paper gold, in the form of inflows to ETFs, is high. The biggest one—GLD—is up 25% year to date. That’s substantial but still below past peaks, suggesting more upside potential.
TA Weighs In
This is all fundamental analysis. To that, let me add a little technical analysis (TA). If you’re unfamiliar with TA, it attempts to divine meaning in the chart shapes of the buying and selling of financial assets. It’s controversial. Many analysts see it as nothing more than voodoo. Many others swear by it.
Each of the recurring patterns revealed by TA has a name. The gold price is now in one called the “cup-and-handle.”
And here’s what it means:
Cup-and-handle formations can extend over long periods. According to TA, gold formed a very long-term cup between 2011 and 2020. It then settled into a handle until it transitioned upward when it surged past $2100 in March of 2024—which just happens to coincide almost perfectly with Jeff’s designated breakout point.
Successful cup-and-handle breakouts provide measurable price targets using both arithmetic and logarithmic calculation methods. At the break point in 2024, using the arithmetic method, TA projected a price of $3000. Obviously, we got there. However…
Predictions are perilous, no question. But when fundamental analysis and TA line up as they do here, it seems safe to conclude that the bull still has an abundance of room to run.
The Diggers are on Board, too
Since you are here on TheGoldAdvisor.com, my assumption is that you have a vested interest in how the companies that actually mine the metal are doing.
Very well, thanks.
Every tick up in the gold price falls right to the bottom line for the companies that are actually producing. It also sparks investment interest in those who are still in development, and even in prospectors.
Unfortunately for shareholders, gold miners were in a brutal two-year bear market from early 2022 to early 2024. Not surprising, as the gold price was flat and looked like it was never going anywhere.
But here’s the good news: since that gold breakout moment pinpointed by Jeff, the miners began to rise with gold—and then to outpace it. This is typical. Mining share prices tend to trail a rising gold price for a while and then, as a bull market becomes firmly established, they rush past. It’s not uncommon to see them double, triple, or even go 10X.
This chart of the primary mining ETFs, GDX and GDXJ, confirm that this is exactly what’s been happening:
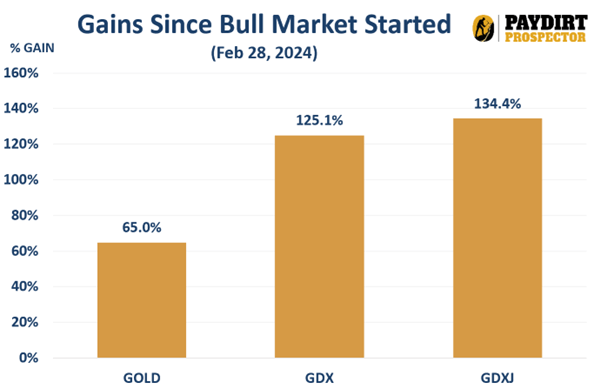
So we’re already sitting on better than a double. As Jeff likes to say, the easy money has now been made, but … the big money still lies ahead. History suggests he’s right, and that this boom is much nearer the beginning than the end…
With that in mind, I’ll point out that Jeff’s stock picks in his Paydirt Prospector newsletter are cleaning up. Check out how the gains so far this year. You can invest right alongside him, and as the data above shows, there is a LOT more ahead. This is how to put some offense in your portfolio.
Hudbay Minerals Inc. (TSX:HBM) (NYSE: HBM) today released its ann... READ MORE
Strategic acquisition of an established operating gold mine, loca... READ MORE
Cerro de Pasco Resources Inc. (TSX-V: CDPR) (OTCQB: GPPRF) (FRA: ... READ MORE
The Garneau Titanium Project Features Ilmenite-Rich Boulder with ... READ MORE
ValOre Metals Corp. (TSX‐V: VO) (OTCQB: KVLQF) (Frankfurt: KEQ0... READ MORE


