







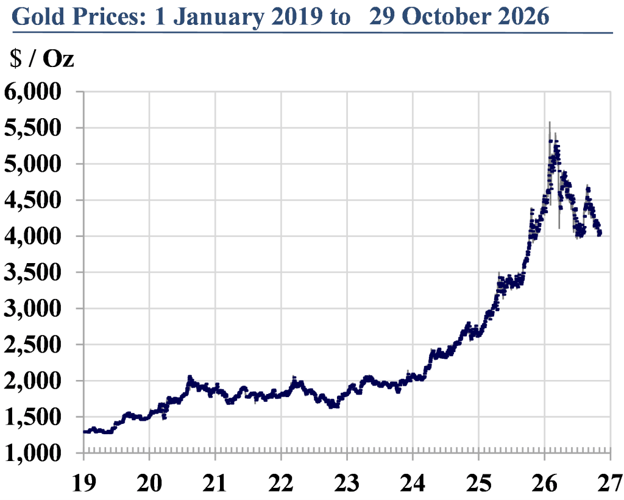
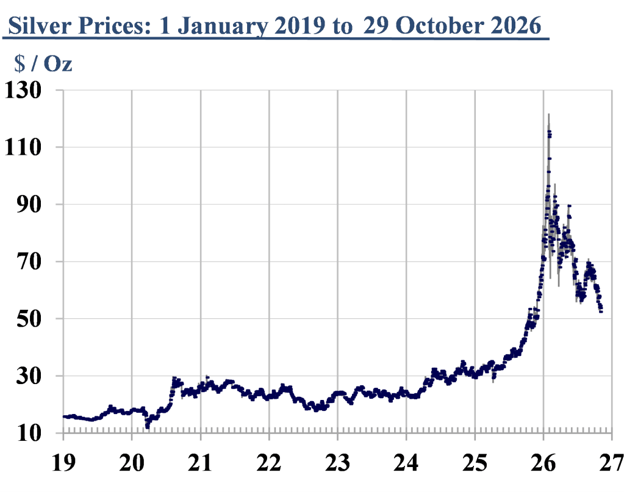
Gold and silver prices have been on an incredible, historic ride over the past two years, and indeed the past eight years.
Prices have risen sharply, with a massive rise in prices starting right after the Kansas City Fed’s annual Jackson Hole, Wyoming, conference in August 2025 through January 2026. This rise in prices was followed by a partial retracement through July. Prices rose sharply once again in August 2026, typically a quiet period in precious metals prices, followed once again by a partial retracement.
Gold rose 57% from a $3,390.20 settlement price on 25 August 2025 (the first trading day after the 2025 KC Fed conference) to a peak settlement price of $5,318.40 on 29 January 2026. Gold then fell 25% to as low as $3,992.10 on 16 July. Prices recovered some of this decline and were trading around $4,200 as of 19 October.
Silver prices similarly rose from a low of $36.71 on 31 July 2025 to a peak of $115.50 on 26 January on a Comex settlement price basis, only to drop back as low as $56.19 on 16 July.
The sharp increases and declines in gold and silver prices have been reflecting equally large waves of investor buying and selling.
The volumes of buying and selling are at record levels. This should not be surprising. More investors and more types of investors (individuals, wealthy families, institutional fund managers, government sovereign wealth funds, and everything in between) have been buying more gold and silver in more parts of the world, at higher prices, for a longer time since the early 2000s than ever before.
These long-term and short-term investors have become more interested in gold and silver as investments, as a form of savings, as an alternative asset, than ever before. Precious metals market fundamentals have been stimulating this interest. So, too, and more significantly, have reasons related to the economic, political, financial, and social trends and conditions that inspire investors to buy gold and silver, or take profits.
As more investors with more investible money have become active in gold and silver, the gross and net volumes have grown very large.
The volatile swings in investor buying and selling of gold and silver since last August are a continuation of what has been happening since 2019. It also has been a continuation of what has been happening since 2000 in gold and silver investment demand and prices.
More important, it is a harbinger of what we should expect in the gold and silver markets in the weeks, months, and years to come.
This report will discuss the factors that have been driving investors to buy and sell gold and silver over the past two years, along with what should be expected in the next several quarters and the next few years.
First, this report will review the buying and selling volumes and timing that have occurred, and discuss what CPM projects may be future trends in investment demand and prices.
It must be noted that these trends in investor buying and selling, and prices, have not been limited to gold and silver. Platinum group metals, copper, other base metals, petroleum, natural gas, and agricultural commodities have seen similar patterns of increased two-way investor activities.
How Much Are Investors Buying
Investors buy gold and silver in many forms. CPM measures physical precious metals investment demand as much as is possible. Given the extremely secretive nature of much of the buying, this is an extremely difficult item to estimate. Some market commentators lament the inability to get audited data on investment demand for gold, seemingly not understanding that the anonymity afforded investors in gold and silver is one of the key attractions of the metal to most investors around the world.
Our statistics typically measure our estimates of net investment demand for physical metal. This includes metal in bar and coin form, as well as medallions and other shapes and sizes of investible physical products. We include the gold and silver purchased, and sold, by investors using exchange-traded funds and other investment products (ETFs, ETPs).
When we began collecting data and intelligence on gold and silver investment demand in the 1970s most of the buying was opaque: There was no public reporting. The only publicly available information on gold investment demand at that time was the sales of South African Krugerrands.
In the 1980s various national mints, in the United States, Canada, Australia, Austria, China, and other nations, began issuing gold and silver bullion coins. (The analysts at CPM worked with all of those mints in creating and launching these coins, along with platinum and palladium coins.) These coins proved to be very popular among investors. The advent and growth of official coins provided increased transparency into investment demand trends and levels, although we cautioned repeatedly that coin investors were representative of only a portion of the precious metals investing public.
In the 2000s ETFs and ETPs were launched, again garnering a good deal of investor attention. These funds are publicly listed securities and disclose how much gold and silver they are holding for investors, further lifting the veil on investment demand and increasing the publicly available data on investor buying and selling.
As with coins, perhaps even more so, ETF investors are not necessarily representative of all gold and silver investors. They have different investment objectives, time horizons, and attitudes. Especially in gold (more so than with silver) the start of ETFs brought in new investors who had not and were not interested in physical gold investors before the ETFs arrived. These investors represent a large portion of the investment market for gold and silver, but not the majority.
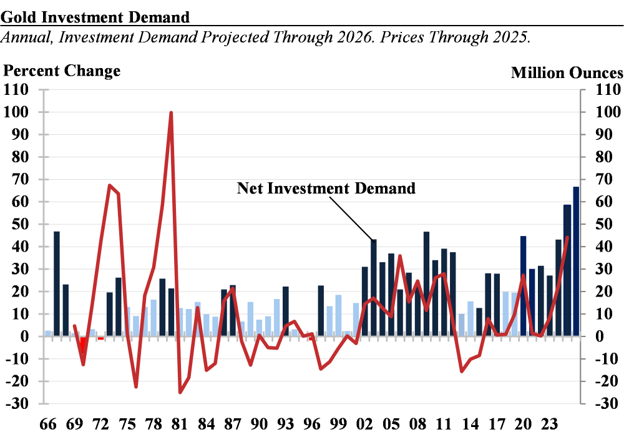
This chart shows annual net purchases of gold by investors. CPM estimates that in 2025 investors bought a record 58.4 million ounces of gold on a net basis, which may be exceeded this year. Investment demand may reach 66.7 million ounces in 2026.
In the annual gold investment demand chart below the difference between the light blue and dark blue bars is that the light blue bars are years in which investors bought 20 million ounces or less net physical gold. These years correspond loosely with years of declining prices. The dark blue bars are years in which investors bought more than 20 million ounces of gold, which correspond loosely with rising gold prices.
The previous record amount of gold bought by investors on an annual net basis was 46.8 million ounces in 1967, when the gold price was fixed at $35.00 per ounce. That level of demand led to the U.S. Treasury closing its private sector gold window in April 1968, ending the period when non-U.S. private entities and people could trade their U.S. dollars for gold at that fixed price.
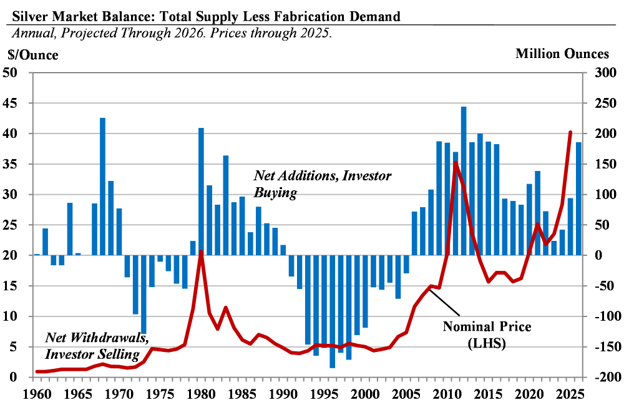
The same trends are at work in silver, although the nature of silver investment demand is somewhat different from that of gold on a cumulative basis. For one thing, when investors are bearish, they tend to buy less gold and they tend to sell more silver. The annual investment demand charts below clearly drive this point home.
Secondly, while net silver investment demand has been rising sharply over the past two years, it has only risen back toward levels similar to those seen in past silver bull markets in the late 1960s, early 1980s, and from 2008 through 2016.
Investors collectively were buying very large volumes from 2008 through 2016. As silver prices declined after 2011 and were relatively moribund until 2020 net investment demand for silver declined to very low levels. Net investor demand peaked at 244.3 million ounces in 2012 and declined to 83.3 million ounces in 2019.
Demand recovered to an estimated 138.3 million ounces in 2021 but then subsided once more, declining to 24.1 million ounces of net buying in 2023.
Over the past two years investors have rekindled their interest in buying silver, with demand rising to 94.0 million ounces in 2025 and possibly reaching 181.9 million ounces in 2026.
Investor Buying And Selling
Over the past several years not only have investors moved toward buying record gold and near-record levels of silver. Investor activity in gold and silver also has become much more two-way: Investors as a group have sharply increased their collective net demand, even as some investors at times have been selling surprisingly large volumes of gold and silver.
To understand this two-way buying and selling one needs to know that different investors have different time horizons, risk tolerance, and investment profiles.
CPM always has advised investors to divide their gold and silver portfolios into compartments. They should have a core position in these metals that they buy and hold, as financial insurance. They also should have a portion of their holdings that they buy and sell as intermediate-term investments, and a third portion that they trade as shorter-term investments.
Some investors follow such advice. Others fall into one of three categories: Long-term buy-and-hold investors, intermediate-term investors, and short-term, more opportunistic or aggressive investors.
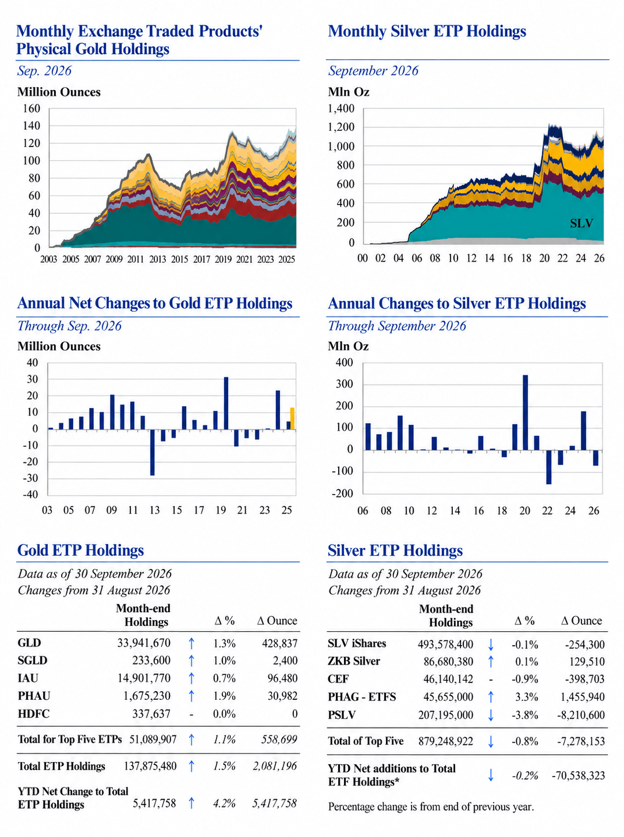
The charts and tables below show trends in net changes in gold and silver ETF holdings. As mentioned earlier, ETF trends do not necessarily represent the full spectrum of gold and silver investors. However, given the ease and convenience of ETFs for many investors they have become the preferred way to invest in these metals, especially for short-term investing.
The charts show net gold sales from ETF investors from 2021 through 2023 and net selling of silver from ETF investors in 2022 and 2023.
Investors reversed course in 2025, adding 22.9 million ounces of gold to their ETF holdings and 178 million ounces of silver.
The tables show that year to date through September gold ETF investors had bought 5.4 million ounces of gold net, while silver ETF investors were net sellers of 70.5 million ounces.
That 70.5 million ounces of net year-to-date silver sales demands explanation. Investors had loaded up on silver ETFs in late 2025, buying 18.7 million ounces in November and 35.2 million in December – fully 30% of the 178 million ounces bought during the entire year 2025. They had bought 88.3 million ounces in the last five months of the year.
When silver prices went from $36 at the end of July 2025 to $121 on an intraday basis and $115 on a settlement price basis at the end of January 2026, investors sold 40.1 million ounces in January 2026. As silver prices then began to decline investors took profits on another 33.6 million ounces in March. Those two months saw 73.7 million ounces of net silver sales, accounting for more than 100% of the year-to-date 70.5 million ounces.
The Factors Driving Gold And Silver Prices
So what has been driving investors around the world to buy record amounts of gold and silver?
Investors buy and hold gold and silver for a variety of reasons.
Given the state of the world that may seem like a rhetorical question, but the reality is that when you disaggregate the political, economic, financial, and social problems facing both the world and major nations such as the United States, Canada, various European and other countries, there are important nuances.
All of these factors are signaling that investors should shift more of their assets into gold and silver at this time.
Equity markets are wildly over-valued, primarily reflecting the hyper-inflated values of a handful of non-mining companies. Worse still, much of the capital appreciation in equity markets has been with companies that are involved in unproven markets and industries. In this way the value of stocks are in a similar position to where they were just before the internet stock market bubble burst in 2001.
So, too, the risks involved in lending money to companies, many state, local, and national governments, and some individuals are greatly under-valued at this point, making interest rates vulnerable to spikes higher.
Real estate values are overvalued, as they were prior to the 1991 recession and the 2007 – 2009 Great Recession and Global Financial Crisis. National and international politics are in disarray.
International trade is suffering as deglobalization and nativism gain strength in countries around the world.
Sovereign debt, corporation and private debt are enormous, collectively at levels more than 320% of global economic output (global GDP). People focus on the U.S. Treasury’s $40 trillion debt, although that actually is one of the least worrisome piles of debt.
Inflation is rising in many countries.
In short, the risks and uncertainties individuals are facing today are greater than they have been at any point since December 1941 – when the United States entered World War Two. After Pearl Harbor, it was clear who would win the war. There still were massive uncertainties as to how the war would play out, but it was clear who would win.
Since that time, the world has faced many scary developments, including the Cold War, the threat of nuclear annihilation, the collapse of the post-war economic cooperation, and countless wars. There have been 14 recessions in the United States, and a myriad of financial and economic crises around the world.
Today, we find ourselves facing greater risks to our personal well-being than during any of these prior crises.
That said, the world probably is not on the verge of a ‘collapse’. Rather, we are facing yet another round of massive crises coming together, as they did in 1980 – 1982 and again from 2007 through the sovereign and U.S. debt crises of 2011.
For all of the factors above, one thing becomes clear. Investors should have more of their wealth in gold and silver, as well as the companies producing these commodities. In a broader market downturn their stocks may initially drop as well (remember Covid?), but then the strong fundamentals for precious metals should lead them to outperform and investors who are underweight the sector may be scrambling to gain exposure.

This CPM Group Market Commentary was sponsored by Silvercorp, one of the premier silver mining companies. We would like to thank Silvercorp for making this CPM research available free of charge.
Silvercorp offers investors exposure to silver production through its enhanced leverage to the metal. The Company’s mines have been consistently growing and profitable, further bolstered by rising silver prices.

25 Reps. 25 Grand. A celebration of American strength, American c... READ MORE
In this presentation, Jeffrey Christian of CPM Group discusses gold’s decline below $4,000,... READ MORE
The Ellis Martin Report and Money Talk Radio welcome Lyle Thorne, Chief Executive Officer, an... READ MORE
Dryden Gold Corp. (TSX-V: DRY) (OTCQX: DRYGF) (FSE: X7W) is pleased to share a letter to shareholder... READ MORE