


Expanded mineral resource and strong exploration upside support long-term production potential
Streamlined project execution driven by integrated open pit and underground mining strategy
Existing infrastructure and staged capital investment result in lowered execution risk
This news release contains forward-looking information about expected future events that is subject to risks and assumptions set out in the “Cautionary Statement on Forward-Looking Information” below. All figures are in United States dollars unless otherwise stated. All production figures reflect payable metal quantities and are on a 100% basis, unless otherwise stated. For references denoted with NG, refer to the “Non-GAAP Financial Measures” disclosures at the end of this news release for a description of these measures. The preliminary economic assessment described in this news release is preliminary in nature and includes inferred mineral resources that are considered too speculative geologically to have the economic considerations applied to them that would enable them to be categorized as mineral reserves, and there is no certainty that the PEA will be realized. Mineral resources that are not mineral reserves do not have demonstrated economic viability.
Centerra Gold Inc. (TSX: CG) (NYSE: CGAU) is pleased to announce an updated mineral resource and the results of a PEA for its Kemess project in British Columbia, showing robust economics including an after-tax net present value (5%) of $1.1 billion and an after-tax internal rate of return of 16%, using long-term pricing of $3,000 per ounce gold and $4.50 per pound of copper.
President and CEO, Paul Tomory, commented, “The Kemess PEA represents an important step forward in advancing Centerra’s organic growth pipeline in British Columbia. The study builds on a significant mineral endowment, outlining a de-risked restart plan that leverages substantial existing infrastructure and employs an integrated development strategy based on conventional open pit and longhole open stoping underground mining operation. This approach supports strong economics, including an initial 15-year mine life with average annual production of 171,000 ounces of gold and 61 million pounds of copper (approximately 267,000 gold equivalent ounces), at an all-in sustaining cost on a by-product basisNG of $971 per ounce. Given the significant unstreamed gold and copper production profile, the value of Kemess increases to $2.8 billion at spot metal prices.”
Paul Tomory continued, “The expanded resource estimate reflects a thorough and disciplined evaluation of the full body of available geological data across the site including additional drilling and technical work in the Nugget zone and the historical Kemess South deposit. The PEA evaluates only the Kemess Main and Kemess Underground areas, which represent approximately 47% of the total indicated and inferred resource tonnes, highlighting the potential for additional resources to be incorporated into future technical studies.”
Paul Tomory concluded, “The PEA also demonstrates the strategic opportunity Kemess represents as Centerra continues to advance its self-funded organic growth pipeline. We see an opportunity for Kemess to become Centerra’s second long-life gold-copper asset in British Columbia, complementing Mount Milligan and strengthening our presence in the Toodoggone, one of the most prospective mining jurisdictions in North America. Kemess represents a compelling growth opportunity, supported by strong economics and significant upside exploration potential in the deep Kemess Offset zone and along the Kemess East trend. We are now focused on ongoing exploration and advancing technical work towards a Pre-Feasibility Study expected in 2027.”
The Honourable, David Eby, Premier of British Columbia, commented “This is promising news for our province and Canada as a whole. Centerra’s continued interest reflects the incredible momentum we’re building in British Columbia’s mining sector. The potential reopening of the Kemess mine is one of several mining projects that will create thousands of good paying, family supporting jobs, and generate billions of dollars for our economy. Together with investors, communities, and First Nations, we are meeting the moment as the economic engine of a stronger and more independent Canada.”
Kemess Updated Resource and PEA Highlights
Summary of Kemess PEA Key Metrics
| Summary of Kemess PEA Key Metrics(1) | |
| Production | |
| Type of operation | Open Pit & Underground |
| Mine Life (years) | 15 |
| Total gold production (koz) | 2,323 |
| Average annual gold production(2)(koz) | 171 |
| Total copper production (Mlbs) | 851 |
| Average annual copper production(2)(Mlbs) | 61 |
| Total process plant feed (M tonnes) | 254,869 |
| Average process plant throughput – post-2033 (tonnes per day “tpd”) | 50,000 |
| Average gold grade (grams per tonne “g/t”) | 0.39 |
| Average copper grade (%) | 0.18 |
| Average gold recovery (%) | 74.5 |
| Average copper recovery (%) | 88.2 |
| Costs | |
| Open pit mining cost per tonne mined ($/tonne) | 2.81 |
| Underground mining cost per tonne mined(3)($/tonne) | 31.48 |
| Processing cost per tonne processed ($/tonne)(4) | 6.11 |
| General & Administrative (“G&A”) cost per tonne processed(5)($/tonne) | 3.83 |
| Gold production costs per ounce sold ($/oz) | 1,401 |
| All-in sustaining costs on a by-product basisNGper ounce sold ($/oz) | 971 |
| Capital Expenditures | |
| Initial non-sustaining capital expendituresNG(6)($ millions) | 771 |
| Expansionary non-sustaining capital expendituresNG($ millions) | 277 |
| Sustaining capital expendituresNG(7)($ millions) | 595 |
| PEA Economics(8) | |
| After-tax NPV5%($ millions) | 1,094 |
| IRR (%) | 16.4 |
| Economics at Spot Commodity Prices(9) | |
| After-tax NPV5%($ millions) | 2,754 |
| IRR (%) | 28.7 |
(1) The PEA is preliminary in nature and includes inferred mineral resources that are considered too speculative geologically to have the economic considerations applied to them that would enable them to be categorized as mineral reserves, and there is no certainty that the PEA will be realized. Mineral resources that are not mineral reserves do not have demonstrated economic viability. (2) 2033-2045 excluding start-up and ramp-down. (3) Underground mining cost includes underground operating development, drill and blast, paste backfill, underground crushing and conveying, production geology, equipment maintenance, and power costs. The underground mining costs were calculated using engineering estimates and benchmarks from similar operations. The direct underground mining costs are estimated at $23.51 (C$32.45) per ore tonne mined, including primary and secondary stoping. The underground operating development and ore conveying costs are estimated to be $7.59 (C$10.47) and $0.38 (C$0.52) per ore tonne mined. (4) Includes pumping costs to tailings storage facility. (5) Excludes corporate allocations and includes impact benefit agreement costs over life of mine (“LOM”). (6) Does not include lease payments of $40 million which impact net cash flow. (7) Does not include capital lease payments of $229 million which are included in the economics and costs above. (8) PEA economics are based on long-term prices of $3,000/oz gold and $4.50/lb. USD/CAD exchange rate assumptions are $1.38:1. (9) Economics at spot commodity prices assumes $4,500/oz gold and $6.00/lb copper over LOM. USD/CAD exchange rate assumptions are $1.38:1.
Kemess PEA Summary
Kemess is located in the highly prospective Toodoggone District in the northern interior of British Columbia. It was a past producing mine which benefits from significant infrastructure already on-site, including: a 380 km, 230 kilovolt power line; a 50,000 tpd nameplate processing plant in need of some refurbishment and equipment replacements; “mothballed” site infrastructure including a water treatment plant, camp, administration facilities, air strip, truck shop and warehouse which will require some refurbishment; and tailings storage using the previously mined pit as well as an existing tailings facility, which is capable of expansion.
Kemess is a gold-copper porphyry deposit, and the PEA outlines a development approach in which conventional truck-shovel open pit mining begins first, followed by the start of longhole open stoping underground operations approximately two years later. Once underground production commences, both mining methods operate concurrently for the remainder of the 15 year mine life. Average annual production is expected to be 171,000 ounces of gold and 61 million pounds of copper (approximately 267,000 gold equivalent ounces assuming $3,000 per ounce gold, $4.50 per pound copper and $37.50 per ounce silver), at an AISC on a by-product basisNG of $971 per ounce. This integrated mine plan helps streamline the project execution, optimize plant feed and utilize existing infrastructure, while maintaining the expected timeline to first production in late 2031. Key critical-path items include the required BC Hydro sub-station upgrade, as well as permitting activities.
The PEA includes the construction of a leach plant at Kemess, planned as part of the expansionary capital program. The plant is expected to increase overall gold recovery by approximately 14%, enhancing the project’s economics. In addition to improving recovery, it would provide valuable flexibility by enabling the processing of ore from potential satellite deposits in the future. The leach plant is expected to cost $116 million, including indirects and contingency, as part of the expansionary non-sustaining capital expendituresNG, starting in 2032.
Kemess will initially produce a gold-copper concentrate that will be shipped to a British Columbia port and then transported to overseas refineries for final processing, similar to Mount Milligan. With the addition of the leach plant as the underground operations come online, Kemess is expected to produce both a gold-copper concentrate and gold doré bars, with 82% of production to be in the form of concentrate.
The PEA estimates open pit mining costs to average $2.81 per tonne mined and underground mining costs, including development, to average $31.48 per tonne mined over the LOM. Processing costs are estimated to average $6.11 per tonne processed, and G&A costs are estimated to average $3.83 per tonne processed.
Kemess PEA Production and Cost Profile(1)
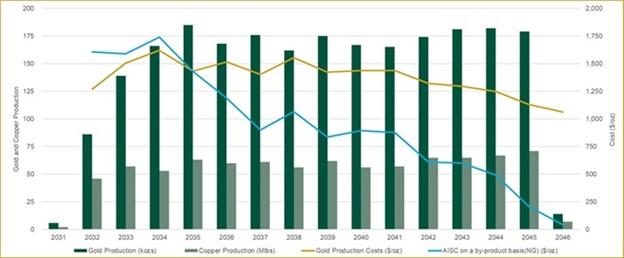
(1) AISC on a by-product basisNG is presented net of copper and silver revenues, after reflecting the impact of the silver stream.
Capital ExpendituresNG
Initial non-sustaining capital expendituresNG required to achieve first production from the open pit are estimated at $771 million, and focused mainly on open pit capital stripping, construction of the underground conveyor system from the Kemess Main zone to the Kemess South process plant, and refurbishment of the process plant, open pit infrastructure and camp. Approximately 30% of the initial non-sustaining capitalNG is allocated to stripping and underground development activities, with the remainder directed towards infrastructure construction and development.
An additional $277 million in expansionary non-sustaining capital expendituresNG will be invested following open pit start-up to support the commencement of underground operations. This includes underground development and the construction of a leach plant, which is expected to improve overall gold recovery by approximately 14%.
Sustaining capital expendituresNG over the LOM are estimated at approximately $595 million, averaging $98 million per year in the first six years, and $26 million per year over the remainder of the mine life. Sustaining capital in the early years includes a paste backfill plant for underground operations and the infrastructure and civil works required to transition tailings deposition to the Kemess South tailings storage facility.
The mining fleet is expected to be leased using equipment leases. The capital lease payments of approximately $40 million made during the initial project development period, are not included in the initial non-sustaining capital expendituresNG, but form part of the initial cash outflow prior to first production. Capital lease payments, including equipment and other leases, of $229 million, made after first production, are treated as sustaining capital lease payments and are not included in the sustaining capital expenditure estimates. Sustaining capital lease payments are included in the determination of the LOM AISC for the Project. Refer to the PEA LOM Summary table at the end of this news release for details on capital lease payments throughout the LOM.
A breakdown of the initial non-sustaining capitalNG is included in the table below.
| Initial Non-Sustaining CapitalNGBreakdown | Total ($M) |
| Open pit conveyor system | 65 |
| Open pit crusher | 25 |
| Process plant refurbishment | 96 |
| Kemess Main infrastructure | 53 |
| General site infrastructure | 27 |
| Tailings facility (existing Kemess South pit) | 9 |
| Subtotal Infrastructure Directs | 275 |
| Indirects | 110 |
| Contingency | 115 |
| Subtotal Infrastructure | 500 |
| Capitalized open pit stripping | 124 |
| Capitalized pre-production G&A | 101 |
| Open pit fleet | 7 |
| Open pit conveyor tunnel development | 39 |
| Total Initial Non-Sustaining CapitalNG | 771 |
| Non-sustaining lease payments | 40 |
| Total Initial Non-Sustaining CapitalNGand Non-Sustaining Lease Payments | 811 |
NOTE: Totals may not sum due to rounding.
Updated Mineral Resource Estimate
The updated indicated mineral resource includes 244.4 million tonnes, with an average grade of 0.42 g/t gold and 0.21% copper, containing 3.3 million ounces of gold and 1.1 billion pounds of copper. The updated inferred mineral resource includes 299.6 million tonnes, with an average grade of 0.37 g/t gold and 0.19% copper, containing 3.6 million ounces of gold and 1.2 billion pounds of copper. It reflects a gold and copper price assumption of $2,400 per ounce and $4.00 per pound, respectively, and incorporates additional ounces from the Nugget and Kemess South deposits resulting from recent drilling and technical work. For the purposes of the PEA mine plan and economics, only 47% of this updated indicated and inferred resource tonnes has been evaluated, limited to the Kemess Main and Kemess Underground deposits.
Kemess Gold Mineral Resources(1,2)
| December 31, 2025 | April 15, 2025 | |||||
| Tonnes (kt) |
Grade (g/t Au) |
Contained Metal (koz) |
Tonnes (kt) |
Grade (g/t Au) |
Contained Metal (koz) |
|
| Indicated Resources | ||||||
| Open Pit – Kemess Main | 170,513 | 0.30 | 1,668 | 142,570 | 0.32 | 1,467 |
| Open Pit – Kemess South | 13,204 | 0.37 | 158 | – | – | – |
| Underground – Kemess UG | 33,223 | 0.82 | 877 | 25,347 | 0.91 | 745 |
| Underground – Kemess East | 27,491 | 0.64 | 565 | 25,074 | 0.66 | 531 |
| Total Indicated | 244,431 | 0.42 | 3,269 | 192,990 | 0.44 | 2,742 |
| Inferred Resources | ||||||
| Open Pit – Kemess Main | 237,050 | 0.30 | 2,299 | 124,428 | 0.31 | 1,232 |
| Open Pit – Kemess South | 198 | 0.34 | 2 | – | – | – |
| Underground – Kemess UG | 20,094 | 0.74 | 481 | 10,821 | 0.96 | 335 |
| Underground – Kemess East | 42,252 | 0.57 | 772 | 34,010 | 0.60 | 661 |
| Total Inferred | 299,593 | 0.37 | 3,555 | 169,260 | 0.41 | 2,228 |
NOTE: Totals may not sum due to rounding. (1) Refer to Tables “Centerra Gold Updated Kemess Resources Summary”, including the respective footnotes and the “Additional Footnotes” section at the end of the release. (2) The PEA is preliminary in nature and includes inferred mineral resources that are considered too speculative geologically to have the economic considerations applied to them that would enable them to be categorized as mineral reserves, and there is no certainty that the PEA will be realized. Mineral resources that are not mineral reserves do not have demonstrated economic viability.
Kemess Copper Mineral Resources(1,2)
| December 31, 2025 | April 15, 2025 | |||||
| Tonnes (kt) |
Grade (% Cu) |
Contained Metal (Mlbs) |
Tonnes (kt) |
Grade (% Cu) |
Contained Metal (Mlbs) |
|
| Indicated Resources | ||||||
| Open Pit – Kemess Main | 170,513 | 0.15 | 575 | 142,570 | 0.16 | 503 |
| Open Pit – Kemess South | 13,204 | 0.13 | 38 | – | – | – |
| Underground – Kemess UG | 33,223 | 0.36 | 265 | 25,347 | 0.39 | 217 |
| Underground – Kemess East | 27,491 | 0.44 | 268 | 25,074 | 0.45 | 251 |
| Total Indicated | 244,431 | 0.21 | 1,146 | 192,990 | 0.23 | 971 |
| Inferred Resources | ||||||
| Open Pit – Kemess Main | 237,050 | 0.13 | 682 | 124,428 | 0.14 | 395 |
| Open Pit – Kemess South | 198 | 0.08 | 0.4 | – | – | – |
| Underground – Kemess UG | 20,094 | 0.33 | 148 | 10,821 | 0.40 | 95 |
| Underground – Kemess East | 42,252 | 0.42 | 393 | 34,010 | 0.44 | 331 |
| Total Inferred | 299,593 | 0.19 | 1,223 | 169,260 | 0.22 | 821 |
NOTE: Totals may not sum due to rounding. (1) Refer to Tables “Centerra Gold Updated Kemess Resources Summary”, including the respective footnotes and the “Additional Footnotes” section at the end of the release. (2) The PEA is preliminary in nature and includes inferred mineral resources that are considered too speculative geologically to have the economic considerations applied to them that would enable them to be categorized as mineral reserves, and there is no certainty that the PEA will be realized. Mineral resources that are not mineral reserves do not have demonstrated economic viability.
Exploration Potential
In 2025, a total of 28 km of drilling was completed, focused on infilling the resource at Kemess Main open pit, Kemess Underground and Nugget, as well as resource extension drilling at Kemess Offset. Results confirm the continuity of mineralization within the resource areas.
Exploration activities will continue in 2026 with infill drilling in the Kemess Main zone, as well as at the Kemess Offset zone to help bridge the mineralization gap between Kemess Underground and Kemess East. Beyond Kemess East, additional exploration potential exists along the eastern extension of the Kemess Main mineralization trend, including the KEY and Hilda South targets. These targets exhibit geophysical signatures consistent with the main Kemess deposits, including shallow, tabular chargeability high anomalies, with underlying chargeability lows that typically host the bulk of gold-copper mineralization.
Geochemical zonation patterns further support this prospectivity. The KEY zone represents an eastern extension of the Kemess East system. Historic drilling at Hilda South has intersected anomalous arsenic, zinc, and lead values which mirror the geochemical signature found above the main mineralized zone at Kemess East. Step-out drilling along this trend, extending eastward from Kemess East, would be exploration targets in the future.
Figure 1: Plan view showing the distance between Kemess Main (formerly Kemess North) and Kemess South
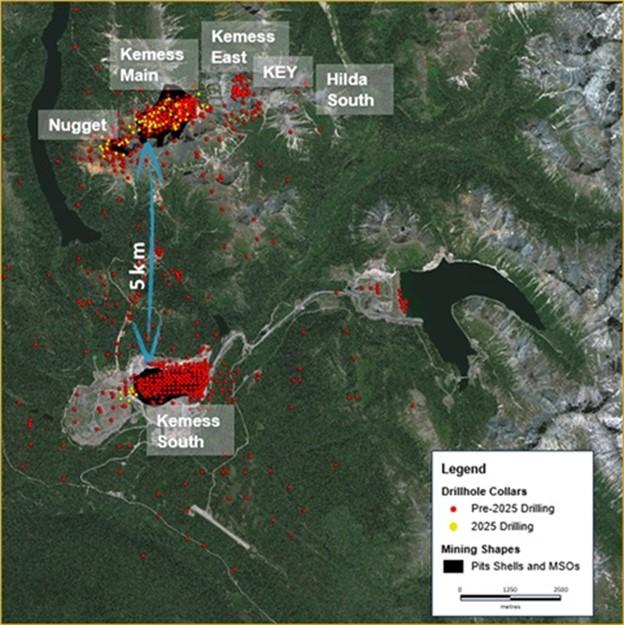
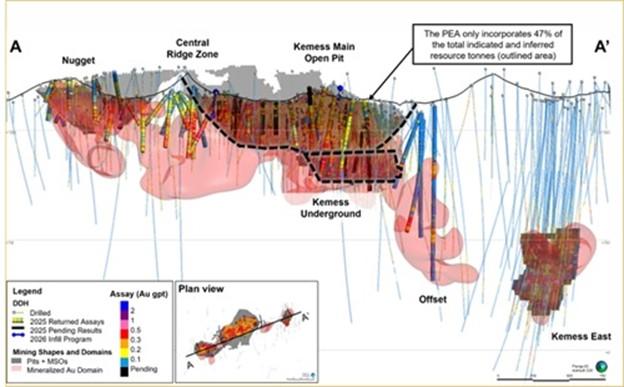
Figure 2: A long sectional view (looking northeast) of the Kemess Main mineralized trend. The PEA evaluates only the Kemess Main and Kemess Underground areas (outlined area), which represent approximately 47% of the total indicated and inferred resource tonnes.
Permitting and Community Relations
Permitting for the Kemess project is well advanced, with some approvals already in place from the site’s previous operations and development plans. Amendments to existing permits will be required to align with the updated development plan. Overall, the Project benefits from a strong permitting foundation, with a path to securing the required amendments for both open pit and underground operations.
Centerra also benefits from established relationships with its First Nations partners through existing impact benefit and other agreements, supported by ongoing discussions regarding the planned development strategy. These agreements provide a strong foundation for collaboration, support, and shared economic participation.
Kemess is expected to provide consistent employment to more than 700 workers and increase business opportunities for First Nations, surrounding communities, and the province, representing a significant economic driver for northern communities in British Columbia.
Sensitivity Analysis
The PEA highlights Kemess’s strong economics, supported by an integrated development strategy and disciplined capital investment. Kemess’s after-tax NPV5% is approximately $1.1 billion, based on long-term gold and copper price assumptions of $3,000 per ounce and $4.50 per pound, respectively. The scale of the mineral endowment included in the PEA, with over 2.3 million ounces of contained gold and 851 million pounds of contained copper, together with the long-life production profile, provides Kemess with strong leverage to rising metal prices, with further upside potential as ongoing exploration advances resource growth. At spot commodity prices of approximately $4,500 per ounce of gold and $6.00 per pound of copper, the after-tax NPV5% increases to approximately $2.8 billion. The sensitivities to commodity prices and input costs are illustrated in the tables below.
Kemess PEA After-Tax NPV5% Sensitivities ($M)
| -10% | -5% | PEA(1) | 5% | 10% | |
| Gold Price | 848 | 971 | 1,094 | 1,216 | 1,338 |
| Copper Price | 958 | 1,026 | 1,094 | 1,161 | 1,229 |
| Canadian Dollar | 782 | 946 | 1,094 | 1,226 | 1,346 |
| Capital Costs | 941 | 1,017 | 1,094 | 1,170 | 1,246 |
| Operating Costs | 903 | 999 | 1,094 | 1,188 | 1,283 |
Kemess PEA After-Tax NPV5% Sensitivity to Long-Term Gold Price ($M)
| Gold Price ($/oz) | |||||
| $2,000 | $2,500 | $3,000(1) (PEA) |
$4,000 | $5,000 | |
| NPV5% | 262 | 683 | 1,094 | 1,905 | 2,712 |
(1) PEA economics are based on long-term commodity prices of $3,000/oz gold and $4.50/lb copper. USD/CAD exchange rate assumptions are $1.38:1.
Kemess PEA After-Tax NPV5% Sensitivity to Long-Term Copper Price ($M)
| Copper Price ($/lb) | |||||
| $3.50 | $4.00 | $4.50(1) (PEA) |
$5.50 | $6.50 | |
| NPV5% | 792 | 943 | 1,094 | 1,394 | 1,692 |
(1) PEA economics are based on long-term commodity prices of $3,000/oz gold and $4.50/lb copper. USD/CAD exchange rate assumptions are $1.38:1.
Kemess PEA LOM Summary
| LOM Total | 2028 | 2029 | 2030 | 2031 | 2032 | 2033 | 2034 | 2035 | 2036 | 2037 | 2038 | 2039 | 2040 | 2041 | 2042 | 2043 | 2044 | 2045 | 2046 | 2047 | 2048 | |||||||||||||||||||||||
| Assumptions | ||||||||||||||||||||||||||||||||||||||||||||
| Gold price ($/oz) | 3,000 | 3,000 | 3,000 | 3,000 | 3,000 | 3,000 | 3,000 | 3,000 | 3,000 | 3,000 | 3,000 | 3,000 | 3,000 | 3,000 | 3,000 | 3,000 | 3,000 | 3,000 | 3,000 | 3,000 | 3,000 | |||||||||||||||||||||||
| Copper price ($/lb) | 37.50 | 37.50 | 37.50 | 37.50 | 37.50 | 37.50 | 37.50 | 37.50 | 37.50 | 37.50 | 37.50 | 37.50 | 37.50 | 37.50 | 37.50 | 37.50 | 37.50 | 37.50 | 37.50 | 37.50 | 37.50 | |||||||||||||||||||||||
| Silver price ($/oz) | 4.50 | 4.50 | 4.50 | 4.50 | 4.50 | 4.50 | 4.50 | 4.50 | 4.50 | 4.50 | 4.50 | 4.50 | 4.50 | 4.50 | 4.50 | 4.50 | 4.50 | 4.50 | 4.50 | 4.50 | 4.50 | |||||||||||||||||||||||
| USD to CAD Exchange rate | 1.38 | 1.38 | 1.38 | 1.38 | 1.38 | 1.38 | 1.38 | 1.38 | 1.38 | 1.38 | 1.38 | 1.38 | 1.38 | 1.38 | 1.38 | 1.38 | 1.38 | 1.38 | 1.38 | 1.38 | 1.38 | |||||||||||||||||||||||
| Mine Production | ||||||||||||||||||||||||||||||||||||||||||||
| Ore mined (Mt) | 255 | – | – | – | 3 | 14 | 18 | 18 | 18 | 18 | 18 | 18 | 18 | 18 | 18 | 18 | 18 | 18 | 17 | 2 | ||||||||||||||||||||||||
| Waste mined (Mt) | 170 | – | 18 | 18 | 14 | 7 | 12 | 16 | 15 | 14 | 9 | 13 | 13 | 8 | 7 | 3 | 3 | 1 | 1 | 0 | ||||||||||||||||||||||||
| Total material mined (Mt) | 425 | – | 18 | 18 | 18 | 21 | 30 | 35 | 33 | 32 | 27 | 31 | 31 | 26 | 25 | 21 | 21 | 19 | 18 | 2 | ||||||||||||||||||||||||
| Rehandle material moved (Mt) | 2 | – | – | – | – | 2 | – | – | – | – | – | – | – | – | – | – | – | – | – | – | ||||||||||||||||||||||||
| Total material moved (Mt) | 427 | – | 18 | 18 | 18 | 23 | 30 | 35 | 33 | 32 | 27 | 31 | 31 | 26 | 25 | 21 | 21 | 19 | 18 | 2 | ||||||||||||||||||||||||
| Open Pit Strip ratio (Waste:Ore) | 0.8 | 4.0 | 0.4 | 0.7 | 1.0 | 1.0 | 0.9 | 0.6 | 0.8 | 0.8 | 0.5 | 0.5 | 0.2 | 0.2 | 0.1 | 0.0 | 0.0 | |||||||||||||||||||||||||||
| Processing | ||||||||||||||||||||||||||||||||||||||||||||
| Ore processed (Mt) | 255 | – | – | – | 1 | 16 | 18 | 18 | 18 | 18 | 18 | 18 | 18 | 18 | 18 | 18 | 18 | 18 | 17 | 2 | ||||||||||||||||||||||||
| Gold feed grade (g/t) | 0.39 | – | – | – | 0.26 | 0.32 | 0.35 | 0.39 | 0.42 | 0.39 | 0.40 | 0.37 | 0.39 | 0.38 | 0.37 | 0.39 | 0.41 | 0.41 | 0.44 | 0.44 | ||||||||||||||||||||||||
| Copper feed grade (%) | 0.18 | % | – | – | – | 0.10 | % | 0.17 | % | 0.18 | % | 0.16 | % | 0.19 | % | 0.18 | % | 0.18 | % | 0.17 | % | 0.18 | % | 0.16 | % | 0.17 | % | 0.19 | % | 0.19 | % | 0.20 | % | 0.22 | % | 0.24 | % | |||||||
| Gold recovery (%) | 74.5 | % | – | – | – | 53.3 | % | 53.3 | % | 69.6 | % | 73.8 | % | 75.9 | % | 75.9 | % | 77.0 | % | 76.7 | % | 78.0 | % | 77.5 | % | 77.6 | % | 77.0 | % | 77.6 | % | 76.6 | % | 75.3 | % | 74.3 | % | |||||||
| Copper recovery (%) | 88.2 | % | – | – | – | 81.4 | % | 81.4 | % | 83.3 | % | 86.2 | % | 87.1 | % | 87.3 | % | 88.8 | % | 89.5 | % | 90.3 | % | 90.0 | % | 90.4 | % | 90.1 | % | 90.2 | % | 90.0 | % | 89.5 | % | 89.3 | % | |||||||
| Gold recovered (kozs) | 2,376 | – | – | – | 6 | 88 | 142 | 168 | 189 | 172 | 180 | 165 | 178 | 171 | 168 | 177 | 185 | 186 | 182 | 18 | ||||||||||||||||||||||||
| Copper recovered (Mlbs) | 898 | – | – | – | 3 | 48 | 61 | 56 | 66 | 64 | 65 | 59 | 66 | 59 | 61 | 68 | 69 | 71 | 75 | 8 | ||||||||||||||||||||||||
| Dry concentrate produced (kdmt) | 1,939 | – | – | – | 6 | 105 | 131 | 121 | 143 | 138 | 140 | 128 | 142 | 128 | 131 | 148 | 149 | 153 | 161 | 17 | ||||||||||||||||||||||||
| Gold payable produced (kozs) | 2,323 | – | – | – | 6 | 86 | 139 | 166 | 185 | 168 | 176 | 162 | 175 | 167 | 165 | 174 | 181 | 182 | 179 | 14 | ||||||||||||||||||||||||
| Copper payable produced (Mlbs) | 851 | – | – | – | 2 | 46 | 57 | 53 | 63 | 60 | 61 | 56 | 62 | 56 | 57 | 65 | 65 | 67 | 71 | 7 | ||||||||||||||||||||||||
| Metal Sales | ||||||||||||||||||||||||||||||||||||||||||||
| Gold ounces sold (kozs) | 2,323 | – | – | – | 6 | 86 | 139 | 166 | 185 | 168 | 176 | 162 | 175 | 167 | 165 | 174 | 181 | 182 | 179 | 14 | – | – | ||||||||||||||||||||||
| Copper pounds sold (Mlbs) | 851 | – | – | – | 2 | 46 | 57 | 53 | 63 | 60 | 61 | 56 | 62 | 56 | 57 | 65 | 65 | 67 | 71 | 7 | – | – | ||||||||||||||||||||||
| Revenue | ||||||||||||||||||||||||||||||||||||||||||||
| Gold sales ($M) | 6,970 | – | – | – | 18 | 257 | 418 | 497 | 554 | 504 | 528 | 485 | 524 | 501 | 494 | 521 | 544 | 547 | 536 | 42 | – | – | ||||||||||||||||||||||
| Copper sales ($M) | 3,829 | – | – | – | 11 | 206 | 258 | 239 | 283 | 272 | 276 | 253 | 280 | 253 | 258 | 292 | 293 | 303 | 318 | 33 | – | – | ||||||||||||||||||||||
| Silver revenue(1) ($M) | 13 | – | – | – | 0 | – | – | 1 | 1 | 1 | 1 | 1 | 1 | 1 | 1 | 1 | 1 | 1 | 1 | 0 | – | – | ||||||||||||||||||||||
| Smelting and refining costs ($M) | (131 | ) | – | – | – | (0 | ) | (5 | ) | (6 | ) | (7 | ) | (8 | ) | (8 | ) | (9 | ) | (8 | ) | (10 | ) | (9 | ) | (10 | ) | (11 | ) | (12 | ) | (13 | ) | (14 | ) | (1 | ) | – | – | |||||
| Total revenue ($M) | 10,681 | – | – | – | 29 | 459 | 670 | 729 | 830 | 768 | 797 | 731 | 795 | 747 | 743 | 802 | 826 | 839 | 841 | 74 | – | – | ||||||||||||||||||||||
| Silver stream upfront payments ($M) | 45 | 10 | 10 | 13 | 13 | – | – | – | – | – | – | – | – | – | – | – | – | – | – | – | – | – | ||||||||||||||||||||||
| Total inflows ($M) | 10,726 | 10 | 10 | 13 | 41 | 459 | 670 | 729 | 830 | 768 | 797 | 731 | 795 | 747 | 743 | 802 | 826 | 839 | 841 | 74 | – | – | ||||||||||||||||||||||
| Unit Costs(2) | ||||||||||||||||||||||||||||||||||||||||||||
| Gold production costs ($/oz) | 1401 | – | – | – | 2,995 | 1,270 | 1,504 | 1,620 | 1,432 | 1,515 | 1,403 | 1,553 | 1,424 | 1,438 | 1,438 | 1,320 | 1,296 | 1,250 | 1,129 | 1,061 | – | – | ||||||||||||||||||||||
| AISC on a by-product basisNG ($/oz) | 971 | – | – | – | 4,285 | 1,606 | 1,589 | 1,741 | 1,428 | 1,189 | 900 | 1,066 | 836 | 895 | 877 | 610 | 601 | 492 | 205 | 43 | ||||||||||||||||||||||||
| Outflows | ||||||||||||||||||||||||||||||||||||||||||||
| Operating costs ($M) | (4,985 | ) | (0 | ) | (0 | ) | (0 | ) | (29 | ) | (195 | ) | (336 | ) | (394 | ) | (396 | ) | (388 | ) | (373 | ) | (378 | ) | (377 | ) | (358 | ) | (357 | ) | (353 | ) | (357 | ) | (350 | ) | (317 | ) | (26 | ) | – | – | ||
| Selling and marketing costs(3) ($M) | (98 | ) | – | – | – | (0 | ) | (5 | ) | (7 | ) | (6 | ) | (7 | ) | (7 | ) | (7 | ) | (6 | ) | (7 | ) | (6 | ) | (7 | ) | (7 | ) | (7 | ) | (8 | ) | (8 | ) | (1 | ) | – | – | |||||
| Initial non-sustaining capital expendituresNG ($M) | (771 | ) | (151 | ) | (271 | ) | (292 | ) | (58 | ) | – | – | – | – | – | – | – | – | – | – | – | – | – | – | – | – | – | |||||||||||||||||
| Expansionary non-sustaining capital expendituresNG ($M) | (277 | ) | – | – | – | (91 | ) | (186 | ) | (1 | ) | – | – | – | – | – | – | – | – | – | – | – | – | – | – | – | ||||||||||||||||||
| Sustaining capital expendituresNG ($M) | (595 | ) | – | – | – | – | (109 | ) | (93 | ) | (78 | ) | (89 | ) | (17 | ) | (41 | ) | (27 | ) | (26 | ) | (24 | ) | (24 | ) | (19 | ) | (20 | ) | (17 | ) | (10 | ) | (1 | ) | – | – | ||||||
| Lease payments ($M) | (269 | ) | – | – | (25 | ) | (21 | ) | (28 | ) | (35 | ) | (41 | ) | (44 | ) | (48 | ) | (3 | ) | (3 | ) | (3 | ) | (3 | ) | (3 | ) | (3 | ) | (3 | ) | (3 | ) | (3 | ) | – | – | – | |||||
| Reclamation expenditures ($M) | (100 | ) | – | – | – | – | – | – | – | – | – | – | – | – | – | – | – | – | – | – | (36 | ) | (36 | ) | (27 | ) | ||||||||||||||||||
| Cash taxes ($M) | (1,302 | ) | – | – | – | – | (5 | ) | (7 | ) | (7 | ) | (68 | ) | (69 | ) | (86 | ) | (72 | ) | (100 | ) | (118 | ) | (121 | ) | (146 | ) | (155 | ) | (164 | ) | (179 | ) | (6 | ) | – | – | ||||||
| Total outflows ($M) | (8,397 | ) | (151 | ) | (271 | ) | (317 | ) | (199 | ) | (529 | ) | (478 | ) | (525 | ) | (605 | ) | (529 | ) | (510 | ) | (487 | ) | (514 | ) | (509 | ) | (510 | ) | (529 | ) | (542 | ) | (541 | ) | (517 | ) | (70 | ) | (36 | ) | (27 | ) |
| Net cash flow ($M) | 2,329 | (141 | ) | (261 | ) | (304 | ) | (157 | ) | (70 | ) | 191 | 204 | 225 | 239 | 287 | 244 | 281 | 238 | 233 | 273 | 284 | 298 | 325 | 4 | (36 | ) | (27 | ) | |||||||||||||||
| NPV @ 5%(4) ($M) | 1,094 | |||||||||||||||||||||||||||||||||||||||||||
(1) Silver revenues include impact from the Kemess stream arrangement with Triple Flag Precious Metals Corp. (“Triple Flag”).
(2) Unit cost LOM average. Open pit mining costs refer to open pit unit cost per tonne mined. Underground mining costs refer to underground unit cost per tonne mined. Milling and G&A costs refer to respective unit cost per tonne of ore milled.
(3) Selling and marketing costs include ocean freight.
(4) NPV @ 5% includes a $69 million incremental closure benefit.
“Mt” refers to millions of tonnes; “koz” to thousands of ounces; “Mlb” to millions of pounds; and “kdmt” to thousands of dry metric tonnes. NOTE: Totals may not add due to rounding.
Project Assumptions
The economic analysis of the Project was performed using the following assumptions and basis:
Centerra Gold Updated Kemess Resource Summary(1,4,5) as of December 31, 2025
(see additional footnotes below)
|
Indicated Mineral Resources(2) |
|||||||
| Tonnes (kt) | Gold Grade (g/t) | Contained Gold (koz) | Copper Grade (%) | Contained Copper (Mlbs) | Silver Grade (g/t) | Contained Silver (koz) | |
| Open Pit – Main Zone | 170,513 | 0.30 | 1,668 | 0.15 | 575 | 1.12 | 6,155 |
| Open Pit – Kemess South | 13,204 | 0.37 | 158 | 0.13 | 38 | 0.68 | 289 |
| Underground – Kemess UG | 33,223 | 0.82 | 877 | 0.36 | 265 | 2.48 | 2,652 |
| Underground – Kemess East | 27,491 | 0.64 | 565 | 0.44 | 268 | 1.91 | 1,684 |
| Total Indicated | 244,431 | 0.42 | 3,269 | 0.21 | 1,146 | 1.37 | 10,780 |
|
Inferred Mineral Resources(3) |
|||||||
| Tonnes (kt) | Gold Grade (g/t) | Contained Gold (koz) | Copper Grade (%) | Contained Copper (Mlbs) | Silver Grade (g/t) | Contained Silver (koz) | |
| Open Pit – Main Zone | 237,050 | 0.30 | 2,299 | 0.13 | 682 | 1.06 | 8,108 |
| Open Pit – Kemess South | 198 | 0.34 | 2 | 0.08 | 0 | 0.42 | 3 |
| Underground – Kemess UG | 20,094 | 0.74 | 481 | 0.33 | 148 | 2.22 | 1,433 |
| Underground – Kemess East | 42,252 | 0.57 | 772 | 0.42 | 393 | 1.92 | 2,602 |
| Total Inferred | 299,593 | 0.37 | 3,555 | 0.19 | 1,223 | 1.26 | 12,146 |
(1) Mineral resources are stated in accordance with CIM (2014) Definitions as incorporated by reference into NI 43-101. Mineral Resources are estimated and have an effective date of December 31, 2025.
(2) Mineral resources do not have demonstrated economic viability.
(3) Inferred mineral resources have a lower level of confidence as to their existence and as to whether they can be mined economically. It cannot be assumed that all or part of the inferred mineral resources will ever be upgraded to a higher category.
(4) Centerra’s equity interests as of this news release are as follows: Kemess Main, Kemess South, Kemess UG, Kemess East 100%.
(5) Numbers may not add due to rounding.
Additional Resource Footnotes
Mineral reserve and mineral resource estimates are forward-looking information and are based on key assumptions and are subject to material risk factors. If any event arising from these risks occurs, the Company’s business, prospects, financial condition, results of operations or cash flows, and the market price of Centerra’s shares could be adversely affected. Additional risks and uncertainties not currently known to the Company, or that are currently deemed immaterial, may also materially and adversely affect the Company’s business operations, prospects, financial condition, results of operations or cash flows, and the market price of Centerra’s shares. See the section entitled “Risk That Can Affect Centerra’s Business” in the Company’s Management’s Discussion and Analysis (MD&A) for the three months ended September 30, 2025, available on SEDAR+ at www.sedarplus.ca and EDGAR at www.sec.gov/edgar and see also the discussion below under the heading “Cautionary Statement on Forward-Looking Information”.
NI 43-101 Technical Report
A technical report on Kemess will be prepared in accordance with National Instrument 43-101 Standards of Disclosure for Mineral Projects and will be filed within 45 days of this news release on SEDAR+ at www.sedarplus.ca and EDGAR www.sec.gov/edgar.
About Centerra Gold
Centerra Gold Inc. is a Canadian-based gold mining company focused on operating, developing, exploring and acquiring gold and copper properties in North America, Türkiye, and other markets worldwide. Centerra operates two mines: the Mount Milligan Mine in British Columbia, Canada, and the Öksüt Mine in Türkiye. The Company also owns the Kemess Project in British Columbia, Canada, the Goldfield Project in Nevada, United States, and owns and operates the Molybdenum Business Unit in the United States and Canada.
Hudbay Minerals Inc. (TSX:HBM) (NYSE: HBM) today released its ann... READ MORE
Strategic acquisition of an established operating gold mine, loca... READ MORE
Cerro de Pasco Resources Inc. (TSX-V: CDPR) (OTCQB: GPPRF) (FRA: ... READ MORE
The Garneau Titanium Project Features Ilmenite-Rich Boulder with ... READ MORE
ValOre Metals Corp. (TSX‐V: VO) (OTCQB: KVLQF) (Frankfurt: KEQ0... READ MORE


