


Cassiar Gold Corp. (TSX-V: GLDC) (OTCQX: CGLCF) is pleased to report the results of an updated Mineral Resource Estimate for the Taurus Deposit at its 100% owned flagship Cassiar Gold Property (Property) located in northern British Columbia, Canada. The MRE has been prepared in accordance with Canadian Institute of Mining, Metallurgy and Petroleum definition standards, and represents the expansion and infill of the deposit footprint by the Company since the previous mineral resource estimate from 2022. A technical report in support of the MRE (the ‘NI43-101 Report’) will be filed on SEDAR within 45 days of this news release. The pit-constrained MRE for the Taurus Deposit area and pending supporting technical report for the Property incorporate results from 46,389 m of diamond drilling completed across the property since the previous MRE, as well as other exploration activities completed at the Cassiar Gold project in 2022 through 2024. The resource excludes mineralized areas at the Cassiar South project area.
Highlights:
“Thanks to the hard work and tireless efforts of our technical team, advisors, directors, and contractors, the new MRE marks another key milestone for the Cassiar Gold Project through the addition of a higher grade indicated category and a larger inferred resource.” stated Marco Roque, President and CEO of Cassiar Gold. “Our cumulative programs have advanced a robust gold deposit that hosts mineralization from surface, with continued exploration upside. We look forward to building on this foundational resource and unlocking the potential of the prospective Cassiar land package.”
Taurus Deposit 2025 Mineral Resource Estimate Overview
The 2025 MRE is based on 598 drill holes totaling approximately 65,667 m of drill core sampled by the Company and preceding operators. Of the total, 107 new drill holes and approximately 31,237 m of core drilled since 2022 contributed to the updated MRE reported here. Cassiar Gold drill holes have contributed to confirmation of historical drill data, infilled several widely drilled portions of the deposit, and tested extensions and exploration targets through step out drilling which have resulted in the expansion of the deposit footprint.
A new geological model, developed from first principles, integrates updated structural and lithological data to more accurately constrain the geometry of mineralized zones. Incorporation of data from recent infill and expansion drilling has refined domain boundaries, enabling more robust modeling of the mineralized system.
“By establishing a new geological model with high-quality structural and lithological data, we’ve enhanced confidence in the resource and laid a foundation for more efficient, value driven drilling to advance this deposit and adjacent targets.” said Jill Maxwell, VP Exploration for Cassiar Gold Corp. “Several of the adjacent targets share key geological and geophysical characteristics with Taurus and highlight the significant potential of the Cassiar Property.”
The resource was estimated into 13 “vein and shear” domain groups including 139 individual domains representing higher-grade/higher-continuity mineralization, and a pyrite halo domain which represents the disseminated and short-range mineralization surrounding the veins and shears. These geological domains best represent the deposit (with current understanding and information) with regards to its geology and gold distribution, as well as in consideration of the proposed open pit extraction method. This resource is considered by the author to have reasonable prospects for eventual economic extraction.
Table 1 summarizes the gold mineral resources for the Taurus deposit, effective June 8, 2025, with key considerations and parameters listed below.
Table 1. Resources Estimated for the Taurus Deposit
| Resource Category | Au g/t Cut-off | Tonnes | Au g/t | Au oz |
| Indicated | 0.40 | 8,800,000 | 1.43 | 410,000 |
| Inferred | 0.40 | 63,150,000 | 0.95 | 1,930,000 |
Table 2 summarizes the gold mineral resources at different gold prices for the Taurus deposit to demonstrate the sensitivity of the deposit to price fluctuations.
Table 2 Resource Sensitivity to Gold Price
| Gold Price (US$) | Resource Category | Au g/t Cut-off | Tonnes | Au g/t | Au oz |
| $2100 | Indicated | 0.40 | 8,700,000 | 1.44 | 400,000 |
| Inferred | 0.40 | 60,590,000 | 0.95 | 1,850,000 | |
| $2400 | Indicated | 0.40 | 8,800,000 | 1.43 | 410,000 |
| Inferred | 0.40 | 63,150,000 | 0.95 | 1,930,000 | |
| $2600 | Indicated | 0.40 | 8,820,000 | 1.43 | 410,000 |
| Inferred | 0.40 | 64,220,000 | 0.95 | 1,960,000 |
Table 3 summarizes the gold mineral resources at different cut-off grades for the Taurus deposit to demonstrate the sensitivity of the deposit to mining grade considerations. These cut-offs are investigated within the USD$2400 gold price open pit scenario and demonstrate strong retention of contained gold at increasing cutoff grades.
Table 3 Resource Sensitivity to cut-off grade at USD$2,400 oz gold price
| Cut-off Grade (Au g/t) | Resource Category | Tonnes | Au g/t | Au oz |
| 0.30 | Indicated | 11,120,000 | 1.21 | 430,000 |
| Inferred | 82,470,000 | 0.81 | 2,150,000 | |
| 0.40 | Indicated | 8,800,000 | 1.43 | 410,000 |
| Inferred | 63,150,000 | 0.95 | 1,930,000 | |
| 0.50 | Indicated | 7,130,000 | 1.66 | 380,000 |
| Inferred | 48,110,000 | 1.11 | 1,710,000 | |
| 0.60 | Indicated | 5,870,000 | 1.90 | 360,000 |
| Inferred | 36,930,000 | 1.28 | 1,520,000 | |
| 0.70 | Indicated | 4,980,000 | 2.13 | 340,000 |
| Inferred | 28,990,000 | 1.45 | 1,350,000 | |
| 0.80 | Indicated | 4,310,000 | 2.34 | 320,000 |
| Inferred | 23,550,000 | 1.61 | 1,220,000 | |
| 0.90 | Indicated | 3,820,000 | 2.53 | 310,000 |
| Inferred | 19,670,000 | 1.76 | 1,110,000 | |
| 1.00 | Indicated | 3,480,000 | 2.69 | 300,000 |
| Inferred | 16,070,000 | 1.92 | 990,000 |
Figure 1 . Plan view image of Reported Resources for Taurus Deposit area (pit constrained, 0.4 g/t cutoff). Black areas depict pit walls constraining the resource block model.
The gold mineralization at Taurus has three dominant controlling orientations which have been captured through domaining, and estimation settings and parameters. These include (i) the Taurus West area, which is controlled by the east-southeast-dipping Taurus West Fault that is surrounded by a broad semi-tabular zone of dominantly disseminated pyrite mineralization in mafic volcanic rocks, and which contains discrete, gently south plunging higher grade mineralized chutes, (ii) the dominant east-west to east northeast striking and steeply dipping extension and shear vein systems in the central and eastern areas, and (iii) northwest trending pyritic shear zones and fringing extension vein sets in the Sable area of the southeast Taurus Deposit. The geologically defined domains are incorporated into the resource model and are illustrated in Figures 1 though 3.
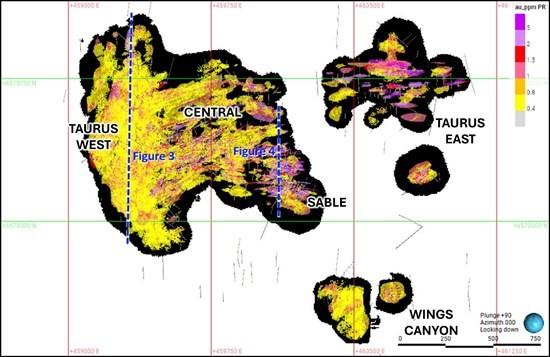
Figure 2 . Vertical cross-section along Taurus West Area (see Figure 1 for location), looking west +/- 25 m. Note gently plunging higher grade domains which form chutes along and above the Taurus West Fault.
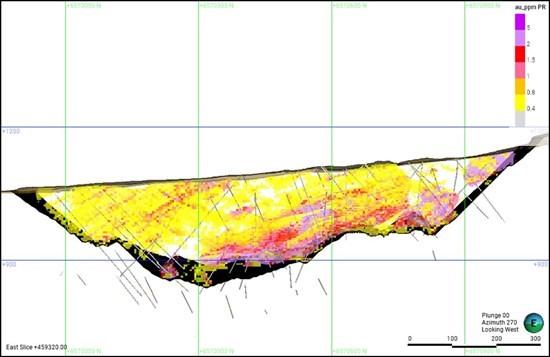
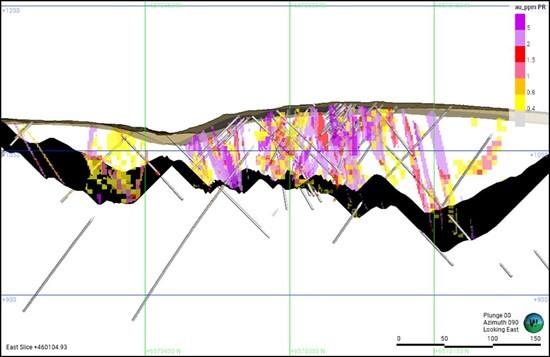
Figure 3. North-south vertical section through the Sable Area of the Taurus Deposit (see Figure 1 for location), looking east +/- 25 m along the trend of the dominant steeply dipping vein set.
The Company announces that (further to its news release dated April 16, 2025) in connection with the grant and award of stock options, restricted share units and deferred share units, the aggregate number of equity compensation securities was (i) 1,340,000 stock options; (ii) 1,047,400 restricted share units; and (iii) 600,000 deferred share units, with April 16, 2025 as the effective date of such grants and awards. The Company confirms that the terms of these compensation securities as disclosed in the Company’s April 16, 2025 news release remain unchanged.
Qualified Persons
Scott Zelligan, P.Geo., the independent Qualified Person (QP) as defined by NI43-101, has verified and approved the technical information related to the MRE in this news release.
Other technical information in this news release has been reviewed and approved by Jill Maxwell, P.Geo., Cassiar Gold Corp.’s VP Exploration, who is a Qualified Person as defined by National Instrument 43-101.
About Cassiar Gold Corp.
Cassiar Gold Corp. is a Canadian gold exploration company holding a 100% interest in its flagship Cassiar Gold Property located in British Columbia, Canada. The Cassiar Gold property spans 590 km2 and consists of two main project areas: Cassiar North, which hosts the Taurus Deposit area which hosts the resource reported here; and Cassiar South, which hosts numerous gold showings, historical workings, and exploration prospects. High-grade shear veins comprise the deposit style typical of the past-producing mines in the Cassiar South project area, holding the potential to host new parallel veins associated with high-grade mineralization, and extensions and fault offsets of past-producing vein systems.
The Company also holds a 100% interest in properties covering most of the Sheep Creek gold camp located near Salmo, British Columbia, Canada. The Sheep Creek gold district ranks as the third largest past-producing orogenic gold district in British Columbia with historical gold production of 742,000 ounces gold at an average grade of 14.7 g/t gold from 1900 to 1951. Minimal exploration work has been conducted since the 1950s.
Cassiar Gold Corp. acknowledges, respects, and supports the rights of Traditional First Nations in the lands and communities where we operate.
Hudbay Minerals Inc. (TSX:HBM) (NYSE: HBM) today released its ann... READ MORE
Strategic acquisition of an established operating gold mine, loca... READ MORE
Cerro de Pasco Resources Inc. (TSX-V: CDPR) (OTCQB: GPPRF) (FRA: ... READ MORE
The Garneau Titanium Project Features Ilmenite-Rich Boulder with ... READ MORE
ValOre Metals Corp. (TSX‐V: VO) (OTCQB: KVLQF) (Frankfurt: KEQ0... READ MORE


