


![]()
Cartier Resources Inc. (TSX-V: ECR) (FSE: 6CA) is pleased to announce the results of the Updated Mineral Resource Estimate on its 100% owned flagship Cadillac Project, located in Val-d’Or. The updated estimates include approximately 110,000 metres of drilling completed by Cartier from 2016 to 2024 as well as 420,000 metres drilling completed by previous mining companies. The MRE was independently prepared by PLR Resources Inc. and Evomine, specialists in mineral resource estimates and project evaluations, in accordance with National Instrument 43-101 – Standards of Disclosure for Mineral Projects and is dated December 17, 2025.
Strategic & Investment Significance Highlights of the Updated Mineral Resource Estimate
“The updated gold resource, incorporating both pit-constrained and underground scenarios, represents a new achievement and positions Cartier with a high degree of development flexibility at the Cadillac Project. This optionality enhances the project’s strategic value and will be further assessed through an updated PEA. Cadillac stands out as one of the few large-scale Quebec gold projects still delivering rapid resource growth, situated in a top-tier, pro-mining jurisdiction with established infrastructure and workforce. We look forward to advancing key value-creation milestones in 2026.” – Philippe Cloutier, President and CEO of Cartier.
“Since acquiring the project in 2016 and consolidating the east–west extensions in 2022, the Cartier team has systematically de-risked and enhanced the asset’s gold potential through consistent exploration success and a robust, standardized geological model. The ongoing 100,000-m drilling program is designed to test the property at a mining camp scale, support continued resource growth, and deliver meaningful exploration and blue-sky upside, positioning the project for further value-accretive discoveries.” – Ronan Deroff, Vice President Exploration of Cartier.
Upcoming Milestones
100,000 m drilling program (Q3 2025 to Q2 2027)
The ambitious 600-hole drilling program will both expand known gold zones (0 to 300 m deep) and test new shallow surface high-potential targets. The Company has implemented VRIFY’s AI-Assisted Mineral Discovery Platform (DORA) to guide exploration priorities and optimize drill targeting across the land package. The objective is to unlock the camp-scale, high-grade gold potential along the 15 km Cadillac and Héva Fault Zones.
Environmental baseline studies & economic evaluation of Chimo mine tailings (Q3 2025 to Q3 2026)
The studies will provide a comprehensive understanding of the current environmental conditions and implement operations that minimize environmental impact while optimizing the economic potential of the project. These studies will be supplemented by an initial assessment of the past-producing Chimo mine tailings to determine whether a quantity of gold can be extracted economically.
Metallurgical sampling and testwork program (Q4 2025 to Q1 2026)
The comprehensive program will characterize the mineralized material, gold recovery potential and validate optimal grind size defining the most efficient and cost-effective flowsheet. The data generated will directly support optimized project development and have the potential to significantly reduce both capital and operating costs, while also improving revenue generation and reducing the environmental footprint.
Preliminary economic assessment (2026)
Internal engineering studies have been initiated to validate a multitude of development scenarios that consider the updated MRE and current market environment. Following the selection of the most optimal scenario, a PEA will be completed which will also build upon the results of the metallurgical testwork program and the environmental baseline studies to unveil the updated development strategy and vision of the project.
Table 1: Results of the Updated Mineral Resource Estimate
| All sectors / Category |
Open Pit Resources | Underground Resources | Total | ||||||
| Cut-off Grade = 0.30g/t Au | Cut-off Grade = 1.00g/t Au | ||||||||
| Tonnes (t) | Grade (Au g/t) |
Gold (oz) | Tonnes (t) | Grade (Au g/t) | Gold (oz) | Tonnes (t) | Grade (Au g/t) |
Gold (oz) | |
| Measured | 1,770,000 | 2.16 | 123,300 | 4,210,000 | 2.80 | 379,300 | 5,988,000 | 2.61 | 502,600 |
| Indicated | 1,730,000 | 1.52 | 84,500 | 2,240,000 | 2.51 | 180,600 | 3,965,000 | 2.08 | 265,200 |
| Measured & Indicated | 3,500,000 | 1.84 | 207,800 | 6,450,000 | 2.70 | 559,900 | 9,953,000 | 2.40 | 767,800 |
| Inferred | 4,740,000 | 1.13 | 172,600 | 30,450,000 | 2.29 | 2,244,200 | 35,185,000 | 2.14 | 2,416,900 |
Table 2: Sensitivity analysis with different gold price assumptions
| Measured | Indicated | Inferred | |||||||||
| Gold Price Assumption ($/oz.) |
Cut-off Grade (Au g/t) |
Method | Tonnes (t) | Grade (Au g/t) |
Gold (oz) |
Tonnes (t) | Grade (Au g/t) |
Gold (oz) |
Tonnes (t) | Grade (Au g/t) |
Gold (oz) |
| 4,000 | 0.75 | Underground | 4,010,000 | 2.64 | 339,600 | 1,580,000 | 2.18 | 110,700 | 33,970,000 | 1.99 | 2,169,200 |
| 0.20 | Open pit | 2,600,000 | 2.02 | 169,300 | 3,500,000 | 1.29 | 144,900 | 15,600,000 | 0.98 | 491,300 | |
| – | Total | 6,607,000 | 2.40 | 508,900 | 5,084,000 | 1.56 | 255,600 | 49,576,000 | 1.67 | 2,660,500 | |
| 3,500 | 0.85 | Underground | 4,250,000 | 2.72 | 371,500 | 1,890,000 | 2.28 | 138,300 | 34,080,000 | 2.12 | 2,319,900 |
| 0.25 | Open pit | 2,130,000 | 2.02 | 138,500 | 2,740,000 | 1.42 | 124,900 | 7,490,000 | 1.05 | 251,900 | |
| – | Total | 6,382,000 | 2.49 | 509,900 | 4,627,000 | 1.77 | 263,200 | 41,571,000 | 1.92 | 2,571,800 | |
| 3,000 (base case) |
1.00 | Underground | 4,210,000 | 2.80 | 379,300 | 2,240,000 | 2.51 | 180,600 | 30,450,000 | 2.29 | 2,244,200 |
| 0.30 | Open pit | 1,770,000 | 2.16 | 123,300 | 1,730,000 | 1.52 | 84,500 | 4,740,000 | 1.13 | 172,600 | |
| – | Total | 5,988,000 | 2.61 | 502,600 | 3,965,000 | 2.08 | 265,200 | 35,185,000 | 2.14 | 2,416,900 | |
| 2,500 | 1.20 | Underground | 4,230,000 | 2.91 | 394,900 | 2,250,000 | 2.79 | 201,500 | 25,940,000 | 2.50 | 2,088,000 |
| 0.35 | Open pit | 1,190,000 | 2.43 | 93,300 | 1,050,000 | 1.68 | 56,700 | 2,810,000 | 1.28 | 115,400 | |
| – | Total | 5,421,000 | 2.80 | 488,200 | 3,296,000 | 2.44 | 258,200 | 28,746,000 | 2.38 | 2,203,400 | |
| 2,000 | 1.50 | Underground | 4,120,000 | 3.21 | 425,500 | 1,940,000 | 3.27 | 203,900 | 19,990,000 | 2.81 | 1,807,400 |
| 0.45 | Open pit | 370,000 | 2.92 | 34,800 | 530,000 | 1.86 | 31,600 | 1,470,000 | 1.58 | 74,600 | |
| – | Total | 4,494,000 | 3.19 | 460,300 | 2,472,000 | 2.96 | 235,500 | 21,461,000 | 2.73 | 1,882,000 | |
Figure 1: Plan View of Gold Resources by Gold Sectors
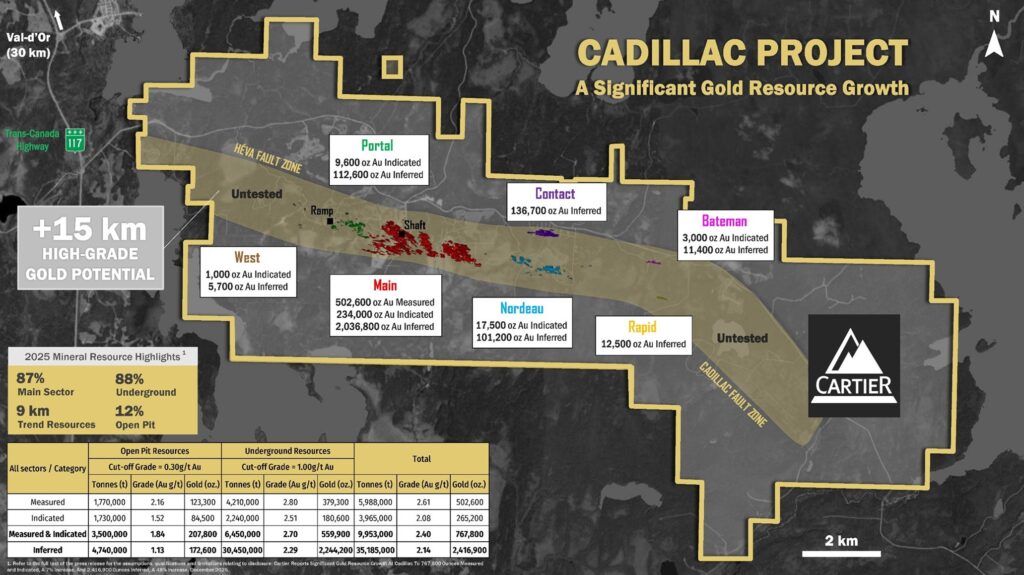
Figure 2: Long Section of Gold Resources by Category
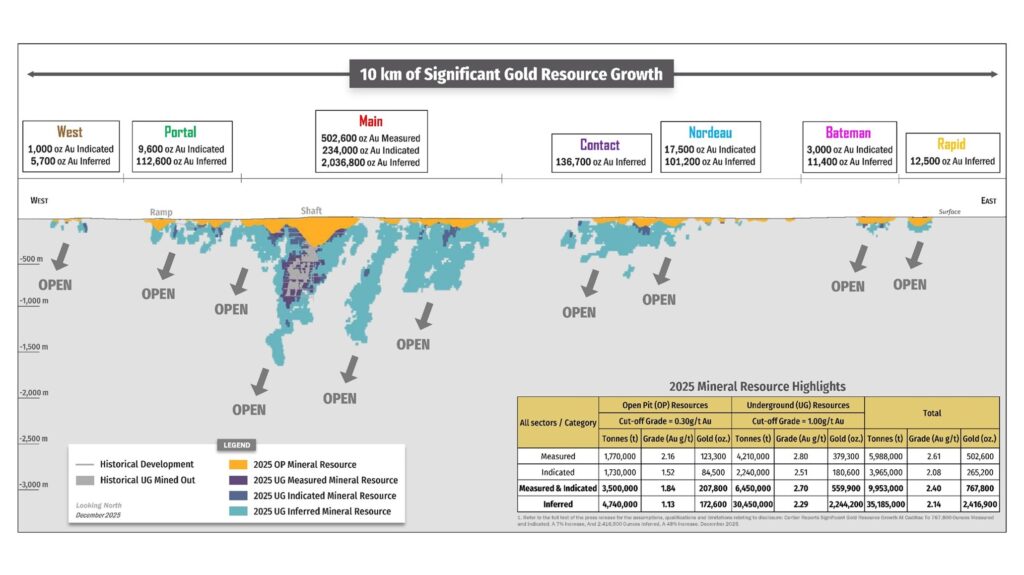
Figure 3: Significant Gold Resource Growth
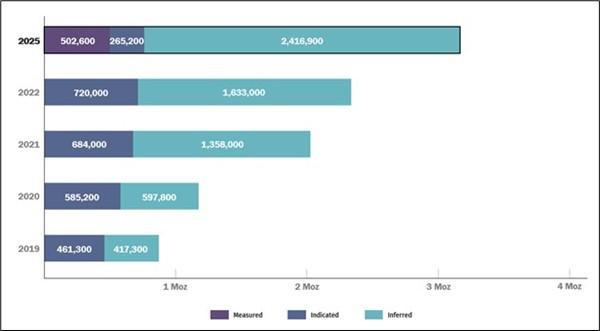
Table 3: General stope parameters used of the Mineral Resource Estimate
| Parameter | Unit | Value | ||||
| Selling | Base Case | |||||
| Gold price | USD/oz | 2,000.00 | 2,500.00 | 3,000.00 | 3,500.00 | 4,000.00 |
| Exchange Rate | CAD/USD | 1.40 | 1.40 | 1.40 | 1.40 | 1.40 |
| Royalty | % | 1.50 | 1.50 | 1.50 | 1.50 | 1.50 |
| Selling cost | USD/oz | 5.00 | 5.00 | 5.00 | 5.00 | 5.00 |
| Payability | % | 99.90 | 99.90 | 99.90 | 99.90 | 99.90 |
| Net selling price | CAD/oz | 2,748.35 | 3,437.16 | 4,125.97 | 4,814.79 | 5,503.60 |
| Operating costs | ||||||
| Mining cost | CAD/t mined | 90.00 | 90.00 | 90.00 | 90.00 | 90.00 |
| Process cost | CAD/t milled | 25.00 | 25.00 | 25.00 | 25.00 | 25.00 |
| General & administration cost | CAD/t milled | 10.00 | 10.00 | 10.00 | 10.00 | 10.00 |
| Total ore-based cost | CAD/t milled | 125.00 | 125.00 | 125.00 | 125.00 | 125.00 |
| Processing | ||||||
| Throughput (range) | tpd | 4,500.00 | 4,500.00 | 4,500.00 | 4,500.00 | 4,500.00 |
| Mill recovery | % | 93.10 | 93.10 | 93.10 | 93.10 | 93.10 |
| Mining | ||||||
| Block size | m | Sub-blocked | Sub-blocked | Sub-blocked | Sub-blocked | Sub-blocked |
| Minimum mining width Longhole | m | 2.50 | 2.50 | 2.50 | 2.50 | 2.50 |
| Dilution (HW & FW) | m | 0.00 | 0.00 | 0.00 | 0.00 | 0.00 |
| Stope height | m | 25.00 | 25.00 | 25.00 | 25.00 | 25.00 |
| Strike length | m | 8.25 | 8.25 | 8.25 | 8.25 | 8.25 |
| Cut-off grade | ||||||
| Marginal cut-off grade calculated | g/t | 1.52 | 1.21 | 1.01 | 0.87 | 0.76 |
| Marginal cut-off grade rounded | g/t | 1.50 | 1.20 | 1.00 | 0.85 | 0.75 |
Table 4: General pit parameters used of the Mineral Resource Estimate
| Parameter | Unit | Value | ||||
| Selling | Base Case | |||||
| Gold price | USD/oz | 2,000.00 | 2,500.00 | 3,000.00 | 3,500.00 | 4,000.00 |
| Exchange Rate | CAD/USD | 1.40 | 1.40 | 1.40 | 1.40 | 1.40 |
| Royalty | % | 1.50 | 1.50 | 1.50 | 1.50 | 1.50 |
| Selling cost | USD/oz | 5.00 | 5.00 | 5.00 | 5.00 | 5.00 |
| Payability | % | 99.90 | 99.90 | 99.90 | 99.90 | 99.90 |
| Net selling price | CAD/oz | 2,748.35 | 3,437.16 | 4,125.97 | 4,814.79 | 5,503.60 |
| Operating costs | ||||||
| Mining cost | CAD/t mined | 6.00 | 6.00 | 6.00 | 6.00 | 6.00 |
| Process cost | CAD/t milled | 25.00 | 25.00 | 25.00 | 25.00 | 25.00 |
| General & administration cost | CAD/t milled | 10.00 | 10.00 | 10.00 | 10.00 | 10.00 |
| Total ore-based cost | CAD/t milled | 35.00 | 35.00 | 35.00 | 35.00 | 35.00 |
| Processing | ||||||
| Throughput (range) | tpd | 4,500.00 | 4,500.00 | 4,500.00 | 4,500.00 | 4,500.00 |
| Mill recovery | % | 93.1 | 93.1 | 93.1 | 93.1 | 93.1 |
| Mining | ||||||
| Block size | m | 5x5x5 | 5x5x5 | 5x5x5 | 5x5x5 | 5x5x5 |
| Slope angle | ° | 50.0 | 50.0 | 50.0 | 50.0 | 50.0 |
| Cut-off grade | ||||||
| Marginal cut-off grade calculated | g/t | 0.43 | 0.34 | 0.28 | 0.24 | 0.21 |
| Marginal cut-off grade rounded | g/t | 0.45 | 0.35 | 0.30 | 0.25 | 0.20 |
Notes Accompanying the Mineral Resource Estimate
Conceptual Exploration Target
A significant Exploration Target was identified during the preparation of the MRE. This conceptual Exploration Target is integrated into the model used for the MRE, with the aim of facilitating future targeting and drill hole planning.
Highlights of the Exploration Target
Disclosure warnings in respect to an exploration target review
Qualified Person
The scientific and technical content of this press release has been prepared, reviewed and approved by Mr. Ronan Déroff, P.Geo., M.Sc., Vice President Exploration, who is a ″Qualified Person″ as defined by National Instrument 43-101 – Standards of Disclosure for Mineral Projects.
The independent qualified persons for the MRE, as defined by National Instrument 43-101 guidelines, is Pierre-Luc Richard, P.Geo., of PLR Resources Inc., with contributions from Stephen Coates, P.Eng., of Evomine Consulting for cut-off grade estimation and open pit and underground stope optimization solids.
About Cadillac Project
The Cadillac Project, covering 14,000 hectares along a 15-kilometre stretch of the Cadillac Fault, is one of the largest consolidated land packages in the Val-d’Or mining camp. Cartier’s flagship asset integrates the historic Chimo Mine and East Cadillac projects, creating a dominant position in a world class gold mining district. With excellent road access, year-round infrastructure and nearby milling capacity, the project is ideally positioned for rapid advancement and value creation.
About Cartier Resources Inc.
Cartier Resources Inc., founded in 2006 and headquartered in Val-d’Or (Quebec) is a gold exploration company focused on building shareholder value through discovery and development in one of Canada’s most prolific mining camps. The Company combines strong technical expertise, a track record of successful exploration, and a fully funded program to advance its flagship Cadillac Project. Cartier’s strategy is clear: unlock the full potential of one of the largest undeveloped gold landholdings in Quebec.
Hudbay Minerals Inc. (TSX:HBM) (NYSE: HBM) today released its ann... READ MORE
Strategic acquisition of an established operating gold mine, loca... READ MORE
Cerro de Pasco Resources Inc. (TSX-V: CDPR) (OTCQB: GPPRF) (FRA: ... READ MORE
The Garneau Titanium Project Features Ilmenite-Rich Boulder with ... READ MORE
ValOre Metals Corp. (TSX‐V: VO) (OTCQB: KVLQF) (Frankfurt: KEQ0... READ MORE


