


Bravo Mining Corp. (TSX-V: BRVO) (OTCQX: BRVMF), is pleased to report the results of its 2025 Mineral Resource Estimate at its 100% owned Luanga palladium + platinum + rhodium + gold + nickel deposit, located in the Carajás Mineral Province, Pará State, Brazil. The 2025 MRE shows substantial improvements over the previously reported 2023 MRE (See press release October 22, 2023) using the same metal prices and similar other assumptions.
Highlights of Bravo’s 2025 MRE at a 0.50 g/t PdEq1 cut-off grade:
“The delivery of our 2025 MRE update is a significant achievement by our team. We have exceeded our own expectations for resource growth in declared tonnes, grade and contained metal, with a considerable increase to the confidence levels in resource categories. The 2025 MRE firmly establishes our Luanga Project as one of the few large-scale, multi-million-ounce, open-pit PGM deposits available globally, in mining friendly, geopolitically favourable locations”, said Luis Azevedo, Chairman and CEO. “Centrally located in the Americas and within reach of major PGM consumers, Luanga also stands out for having access to all essential infrastructure for mining development and operations, including access to cost-efficient renewable power, highways, rail, ports and a skilled mining workforce. With strong community support, as evident in our successful recent public hearing for the permitting process, Bravo Mining is well positioned for continued success, complemented by our continuing copper exploration.”
_________________________________________________________________
1For grades by individual metals, see Table 1 below, where the footnotes also detail the basis of the PdEq1 calculation
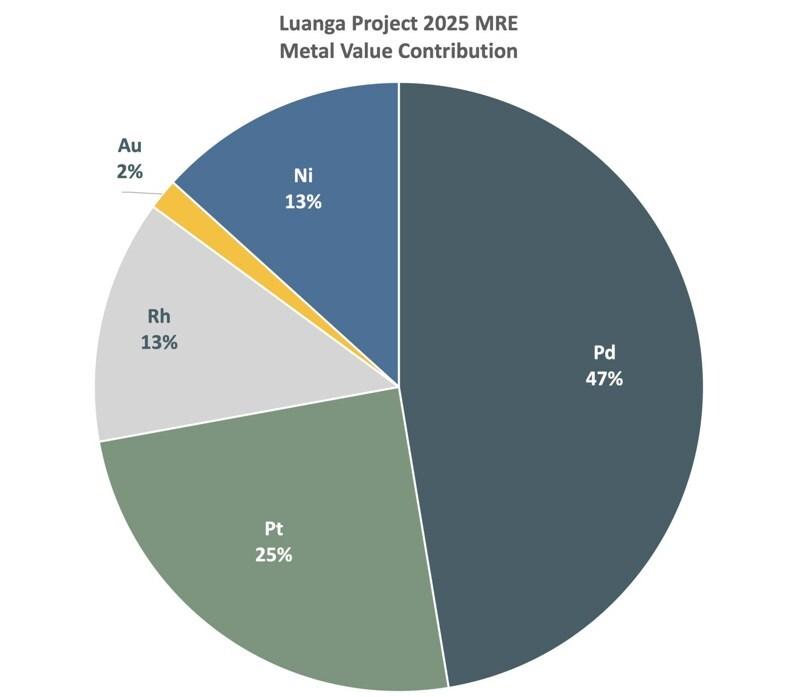
Figure 1: Metal Value Contribution Per Element in the 2025 MRE. (CNW Group/Bravo Mining Corp.)
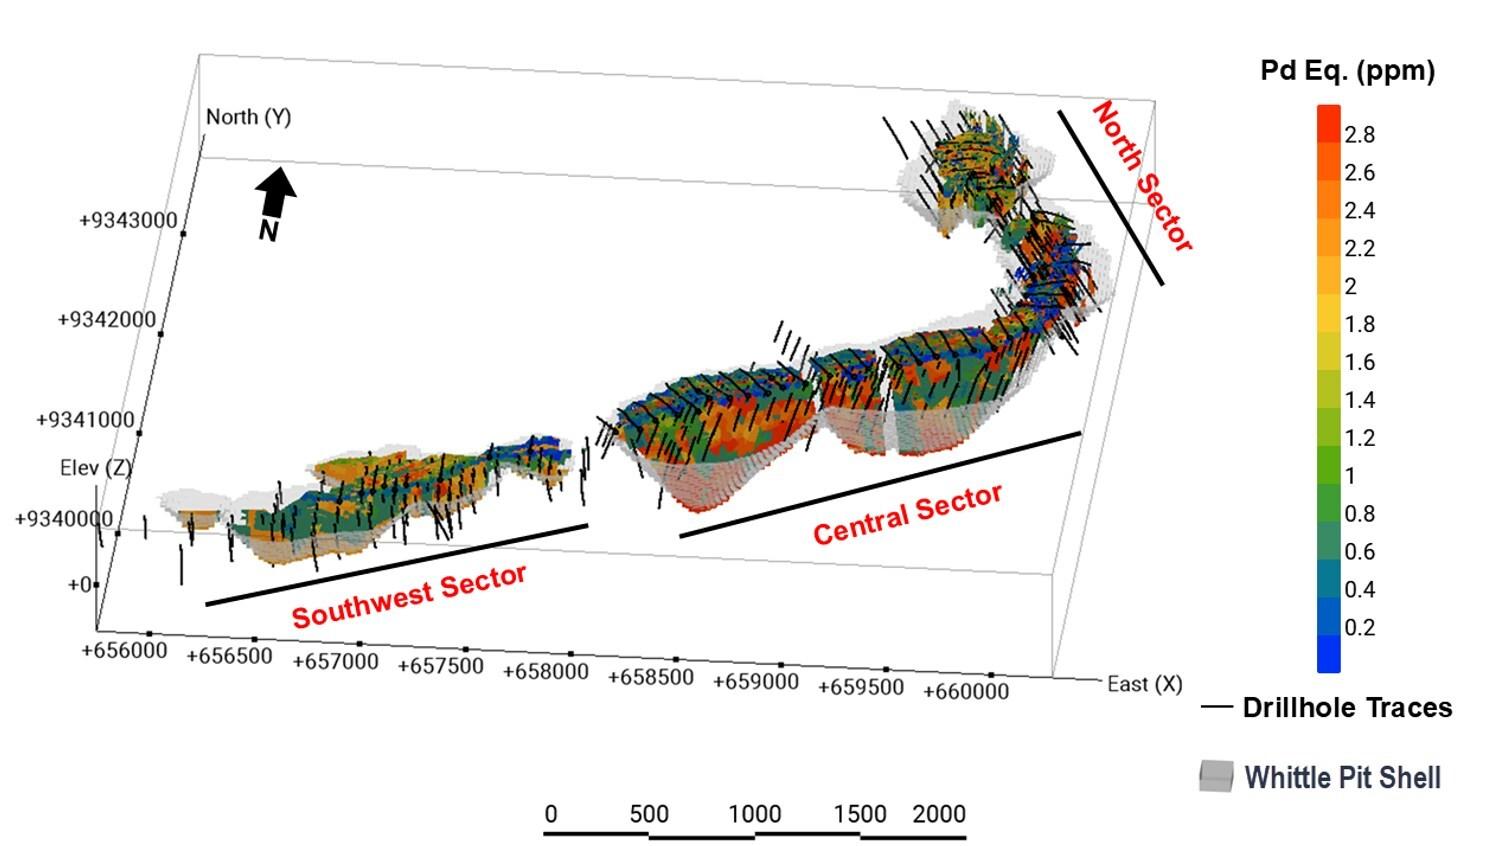
Figure 2: Oblique View of Luanga 2025 MRE PdEq1 grade distribution within constraining pit shell, over 8.1km of Strike. (CNW Group/Bravo Mining Corp.)

Figure 3: Oblique View of Luanga 2025 MRE within Constraining pit shell, showing resource classification distribution over 8.1km of Strike. (CNW Group/Bravo Mining Corp.)
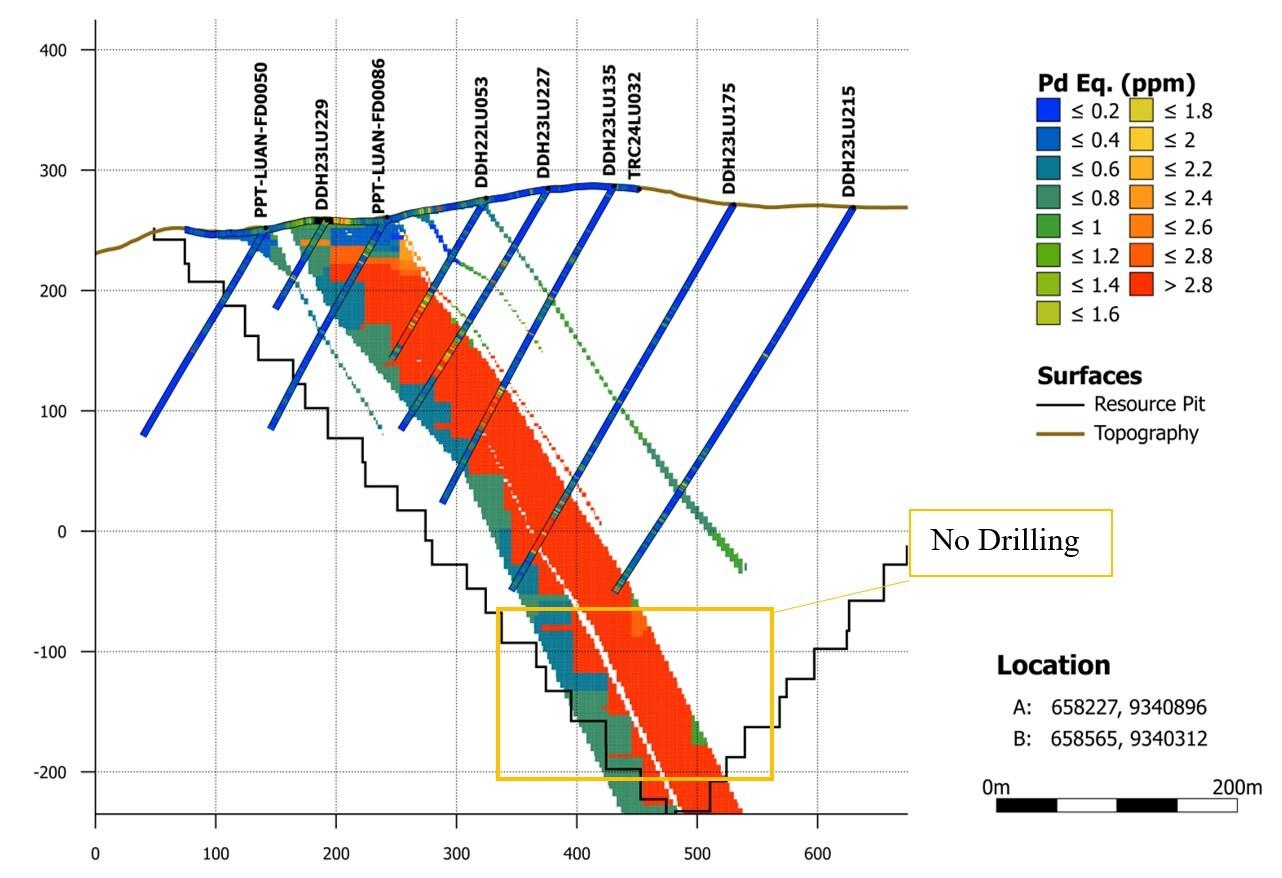
Figure 4: 2025 MRE Section Central Sector. Deepest part of the MRE, showing opportunity to convert additional high-grade Inferred blocks at depth in the MSZ, where blocks are supported by deeper drilling on adjacent sections. Mineralization remains open at depth. (CNW Group/Bravo Mining Corp.)
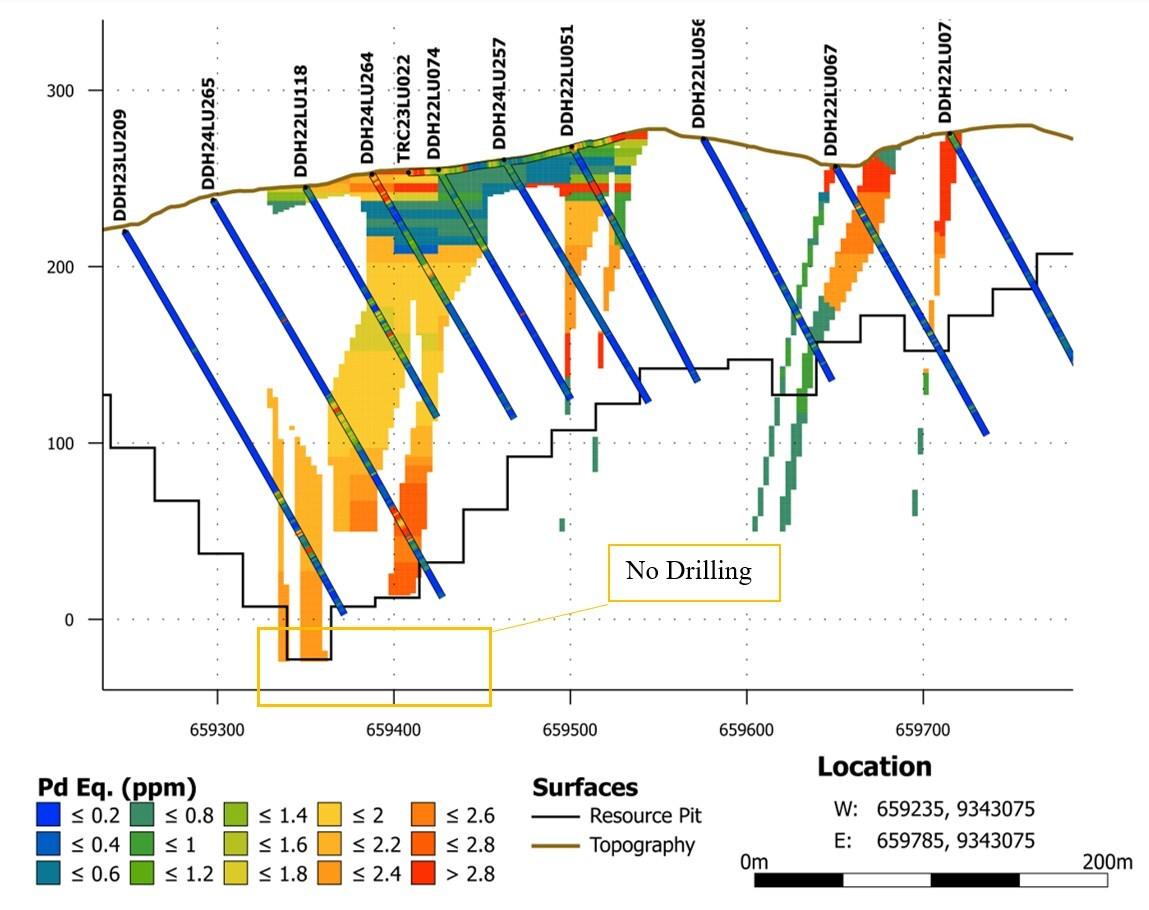
Figure 5: 2025 MRE Section Southwest Sector, showing MRE constraining pit shell reaching the limit of drilling data, and the presence of additional mineralized zones stratigraphically higher. (CNW Group/Bravo Mining Corp.)
2025 MRE Details:
Bravo’s 2025 pit constrained MRE has an effective date of February 18, 2025, and it is comprised of 158 Mt grading 2.04 g/t PdEq1 for a total of 10.4 Moz of PdEq1 in the Measured + Indicated category, and 78 Mt grading 2.01 g/t PdEq1 for 5.0 Moz PdEq1 in the Inferred category. Table 1 shows a breakdown of the MRE by tonnage, grade and metal content for each metal, weathering type, and resource classification category. Mineral resources that are not mineral reserves do not have demonstrated economic viability. There is no certainty that all mineral resources will be converted into mineral reserves. This MRE includes Inferred Mineral Resources which have had insufficient work to classify them as Indicated mineral resources. It is uncertain but reasonably expected that Inferred mineral resources could be upgraded to Indicated mineral resources with continued exploration.
Table 1: MRE Declaration at a Cut-off of 0.5g/t PdEq1*
| Resource Classification |
Weathering | Average Grades and Contained Metal Estimates | ||||||||||||
| Tonnes | PdEq1 | Pd | Pt | Rh | Au | Ni | ||||||||
| Mt | g/t | Oz | g/t | Oz | g/t | Oz | g/t | Oz | g/t | Oz | % | Tonnes | ||
| Measured | Oxide | 4 | 1.51 | 197 | 0.90 | 117 | 0.88 | 115 | 0.12 | 15 | 0.05 | 7 | — | — |
| High talc | — | — | — | — | — | — | — | — | — | — | — | — | — | |
| Fresh Rock | 32 | 2.06 | 2,144 | 0.97 | 1,009 | 0.67 | 694 | 0.08 | 88 | 0.04 | 46 | 0.11 | 35,282 | |
| Total | 36 | 2.00 | 2,340 | 0.96 | 1,126 | 0.69 | 809 | 0.09 | 104 | 0.04 | 53 | 0.10 | 35,282 | |
| Indicated | Oxide | 6 | 1.51 | 314 | 0.97 | 200 | 0.73 | 151 | 0.11 | 23 | 0.04 | 9 | — | — |
| High talc | 2 | 1.83 | 146 | 1.12 | 89 | 0.54 | 43 | 0.08 | 6 | 0.11 | 9 | 0.13 | 3,160 | |
| Fresh Rock | 113 | 2.09 | 7,599 | 0.99 | 3,583 | 0.59 | 2,133 | 0.09 | 318 | 0.05 | 193 | 0.14 | 156,406 | |
| Total | 122 | 2.06 | 8,058 | 0.99 | 3,872 | 0.59 | 2,326 | 0.09 | 348 | 0.05 | 210 | 0.13 | 159,566 | |
| Measured + Indicated |
Oxide | 10 | 1.51 | 510 | 0.94 | 317 | 0.79 | 266 | 0.11 | 38 | 0.04 | 15 | — | — |
| High talc | 2 | 1.83 | 146 | 1.12 | 89 | 0.54 | 43 | 0.08 | 6 | 0.11 | 9 | 0.13 | 3,160 | |
| Fresh Rock | 145 | 2.08 | 9,743 | 0.98 | 4,592 | 0.60 | 2,827 | 0.09 | 407 | 0.05 | 239 | 0.13 | 191,688 | |
| Total | 158 | 2.04 | 10,399 | 0.98 | 4,998 | 0.62 | 3,135 | 0.09 | 451 | 0.05 | 262 | 0.12 | 194,848 | |
| Inferred | Oxide | 3 | 1.57 | 130 | 0.88 | 73 | 1.04 | 86 | 0.13 | 11 | 0.05 | 4 | — | — |
| High talc | 0.1 | 1.76 | 5 | 1.08 | 3 | 0.53 | 2 | 0.07 | 0 | 0.10 | 0 | 0.14 | 133 | |
| Fresh Rock | 75 | 2.02 | 4,878 | 0.97 | 2,344 | 0.58 | 1,389 | 0.08 | 191 | 0.05 | 123 | 0.13 | 97,586 | |
| Total | 78 | 2.01 | 5,013 | 0.97 | 2,421 | 0.59 | 1,476 | 0.08 | 202 | 0.05 | 128 | 0.13 | 97,719 | |
* Notes:
Luanga Mineral Resource Estimate
The Luanga deposit mineral resource database consists of 531 drillholes (Bravo + historic drilling) inside the Luanga deposit, with 108,343 metres of drilling between 1992 to 2025. This database includes 107,516 metres of assayed drill intervals at an average interval of approximately 1m per assay interval.
All assayed drill interval lengths of core used in the mineralized domains are HQ diameter diamond drill core in the oxide and NQ2 diameter diamond drill core in fresh rock.
All historic data used for the MRE has been validated statistically to show no significant bias, either by twinned drillholes, extensive re-sampling and assaying of historic drill core, statistical comparison of historical data with Bravo drilling, and by field validation of collar locations. In addition, the MRE included sample assay results from 45 trenches for 8,714 metres and 9,355 assays at an average sampling interval approximately to 1m.
Thirteen mineralized style domains were generated based on position in deposit and geological and metallurgical behaviour, with most of the tonnage contained within the Main Sulphide Zone.
There are no known issues that materially affect the MRE, other than the usual risks faced by any mining project in Brazil or other jurisdictions, such as the risks and uncertainties inherent in mineral exploration and development, environmental, permitting, taxation, socio-economic, marketing, political factors or any additional risks listed in the Technical Report dated October 22nd, 2023, the Company’s Annual Information Form April 22nd, 2024 and “Forward-Looking Statements” section in this news release.
The metallurgical recovery assumptions for the 2025 MRE have been based on results generated from multiple phases of laboratory-scale metallurgical test work including approximately 150 flotation tests conducted for Bravo Mining (2022 – 2025) at independent laboratories in Brazil and Canada.
Oxide recoveries used in the MRE calculation are based on results generated from exploratory and detailed parameter leaching programs (2022 – 2024) performed for Bravo through independent laboratories in Brazil. Refer to Schedule 2 of this press release for further details.
Metal price assumptions were previously derived in the 2023 MRE from the 10-year trailing price averages to smooth out volatility and price cycle movement in each of these metals. For the 2025 MRE, the same pricing regime has been used, as there have been no significant changes in prices. This also allows for a direct comparison between the new 2025 MRE and the now superseded 2023 model.
The current 2025 MRE supersedes and replaces the previous estimate (2023), which should be no longer relied upon.
For illustration purposes, the pie chart below (Figure 1) shows the relative percentages of metal value contribution to the Luanga MRE using ‘grade x metallurgical recovery x metal price’ for each metal.
Based on recoveries and GE21’s estimates of costs, a cut-off grade (“COG“) of 0.5 g/t PdEq1 was determined for reporting the base case of the MRE. Refer to Schedule 1 of this press release for further details on the factors contributing to the COG estimate. A sensitivity analysis of the COG on the MRE, from 0.1 to 1.0 g/t PdEq1, in increments of 0.1 g/t is shown in Table 2.
Table 2: MRE Sensitivity (grade/tonnes/cut-off) with a 0.5g/t PdEq1 selected for the base case.
| MEASURED + INDICATED | INFERRED | ||||
| PdEq1
Cut-off grade |
Tonnes | Recovered Pd/Eq1 |
PdEq1
Cut-off grade |
Tonnes | Recovered Pd/Eq1 |
| (g/t) | Mt | (g/t) | (g/t) | Mt | (g/t) |
| 0.1 | 165 | 1.97 | 0.1 | 80 | 1.96 |
| 0.2 | 164 | 1.99 | 0.2 | 79 | 1.97 |
| 0.3 | 162 | 2.00 | 0.3 | 79 | 1.98 |
| 0.4 | 161 | 2.02 | 0.4 | 79 | 1.99 |
| 0.5 | 158 | 2.04 | 0.5 | 78 | 2.01 |
| 0.6 | 147 | 2.15 | 0.6 | 74 | 2.07 |
| 0.7 | 134 | 2.30 | 0.7 | 67 | 2.23 |
| 0.8 | 124 | 2.43 | 0.8 | 57 | 2.48 |
| 0.9 | 118 | 2.52 | 0.9 | 54 | 2.59 |
| 1.0 | 115 | 2.55 | 1.0 | 53 | 2.61 |
*Notes:
Mineral Resource growth potential
The Company believes that there is further potential to increase this updated MRE at Luanga, as follows:
About Bravo Mining Corp.
Bravo is a Canadian and Brazil-based mineral exploration and development company focused on advancing its PGM+Au+Ni Luanga Project, as well as our Cu-Au exploration opportunities in the world-class Carajás Mineral Province, Para State, Brazil.
Bravo is one of the most active explorers in Carajás. The team, comprising of local and international geologists and engineers, has a proven track record of PGM, nickel, and copper discoveries in the region and elsewhere. The individuals in the team have successfully taken a past IOCG greenfield project from discovery to development and production in the Carajás.
The Luanga Project is situated on mature freehold farming land and benefits from being located close to operating mines and a mining-experienced workforce, with excellent access and proximity to existing infrastructure, including road, rail, ports, and hydroelectric grid power. Bravo’s current Environmental, Social and Governance activities includes planting more than 30,000 high-value trees in and around the project area in the past 30 months, while hiring personnel and contracting services locally.
Schedule 1: Key Assumptions and Methods Used for the MRE
Variography and Interpolations
Grade estimation for sulphide material was completed using the E-type post-processing of the conditional TBS for each element and each domain. 50 simulations with 400 bands were performed. Raw Variography and raw histogram were validated according to the TBS simulation. No grade variables were capped. The simulations are compared and validated with the OK methodology and Nearest Neighbor Estimation.
The conditional TBS was performed in a block size of 2.5mx2.5mx2.5m and was upscaled for a parental block model of 25mx25mx5m. The parental block model was then sub-blocked with a minimum block size of 3.125m m x 3.125 m x 1.25 m. Grade estimation for oxide material was completed using the OK technique for each element and each domain in the parental block size.
Cut-off Grade
The PdEq1 COG of 0.5 g/t was calculated by taking the all-in cost (oxide and fresh rock) and dividing them by the value of one gram of Pd multiplied by metallurgical recovery. From this a global average COG of 0.5 g/t PdEq1 was calculated.
| COG (PdEq1) | ||
| Oxide | Units | |
| Costs | 14.0 | US$/t |
| DGV1 | 31.95 | US$/g |
| Cut-Off | 0.43 | PdEq1/ g/t |
| Downstream OPEX allowance | 14 | % |
| 2025 Cut-off | 0.49 | PdEq1/ g/t |
| High Talc | Units | |
| Costs | 16.0 | US$/t |
| DGV1 | 35.5 | US$/g |
| Cut-Off | 0.44 | PdEq1/ g/t |
| Downstream OPEX allowance | 14 | % |
| 2025 Cut-off | 0.50 | PdEq1/ g/t |
| Fresh | Units | |
| Costs | 16.0 | US$/t |
| DGV1 | 35.5 | US$/g |
| Cut-Off | 0.44 | PdEq1/ g/t |
| Downstream OPEX allowance | 14 | % |
| 2025 Cut-off | 0.50 | PdEq1/ g/t |
| Avg Cut-off | 0.5 | PdEq1/ g/t |
1 Deposit Grade Value (“DGV”) = (P-Pd/31.1035) * R-Pd
Where: P-Pd = Palladium Price in US$/oz,
R-Pd = Palladium Metallurgical Recovery
Classification of Mineral Resource
A study of spatial continuity for Pd was conducted using variography and conditional simulation to classify mineral resources.
This study established a continuity zone suitable to consider as “Measured Mineral Resources,” with a drilling grid of approximately 45m x 45m, requiring a minimum of 3 drillholes in perpendicular sections.
Establishing a continuity zone of “Indicated Mineral Resources” was considered with a drilling grid of approximately 75m x 75m, with a minimum of 2 drillholes in perpendicular sections. Subsequently, manual post-processing was undertaken to construct wireframes representing the volumes categorized as Measured and Indicated while considering the blocks within the resource pit shell. Any remaining blocks within the resource-limiting pit were classified as “Inferred Mineral Resources.”
Reasonable Prospect for Eventual Economic Extraction
The reported MRE is pit-constrained, using Whittle software to create a pit shell with reasonable prospects for eventual economic extraction. Relevant parameters used in the MRE are shown below the MRE table and include commodity prices used, metallurgical recoveries, geotechnical assumptions, and cost structures.
Further, no known environmental or community matters are likely to constrain the future extraction of the reported MRE.
Schedule 2: Metallurgical Analysis
Metallurgical recoveries used in the MRE calculation are as follows:
Fresh rock recoveries used in the 2025 MRE calculation are based on results generated from multiple phases of laboratory flotation testwork performed by Bravo (117 flotation tests) and three programs of historical flotation testwork, including two historical pilot plant tests. Results indicate that Luanga mineralization has the metallurgical character to potentially produce saleable PGM + sulphide Ni concentrates at grades in line with grades achieved for PGM operators in established jurisdictions around the world, including concentrate grades of ≥80g/t PGM, 5-10% Ni + Sulphur of 15–20%, at the feed grade range of 2g/t PGM.
Bravo testwork considered geospatially representative samples with feed grades ranging from 0.9 – 7.0 g/t PdEq1. Final concentrate grades produced in the Bravo test work ranged from 37–475 g/t PGM. Metallurgical recovery assumptions are based on target concentrate grade of 80g/t.
Input assumptions for the generation of the MRE constraining pit were derived from a grade-recovery curve based on relevant results generated from the 2022 – 2024 test work programs. Where applicable, specific recoveries have been assigned to geological domains that demonstrate materially different metallurgical character and performance relative to the general mineralization observed across the Luanga deposit.
Mini plant tests were also conducted to generate a wide spectrum of concentrate chemistries for pyrometallurgical evaluation. Metallurgical data generated from the mini plant tests were further incorporated into the MRE assumptions. The sample source for the mini plant were inherited, historical, large diameter diamond cores, drilled into a localized, high talc zone in the SW sector of the Luanga deposit. Recoveries achieved were broadly in line with current assumptions (73% 4E PGM) but due to high talc contamination, target concentrate grade was not achieved under the utilised circuit configuration (35g/t). Recovery assumptions for the high talc zone were domained separately, while recoveries for all other zones are based on an 80g/t concentrate.
The resultant reduced metallurgical recovery assumption of 51% (4E PGM) was assigned to the high talc domain.
Oxide recoveries used in the MRE calculation are based on results generated from two programs (2022 – 2024) of conventional leaching test work performed for Bravo.
The conceptual oxide processing flowsheet has been validated at each processing stage through testwork, including: PGM and Au solubility in the presence of cyanide at ambient temperature/pressure and within reasonable reagent dosage conditions; PGM and Au adsorption onto carbon; Final product generation as saleable high grade PGM ash residue (“ashing” or “ashed” is the burning of the loaded carbon for final mass reduction to an ultra-high grade ash residue) with an assayed average grade of 119,100g/t PGM (or 11.91% PGM). Bravo’s current data demonstrates a reasonable probability for economic recovery of PGM from oxide material at Luanga through conventional cyanide leaching, carbon-in-leach extraction, and high grade ‘ashed’ residue production. The recommendations for oxide metallurgical input into the MRE are based on laboratory-generated data for each stage of processing to a final product, from the Luanga 2022 – 2024 programs. Key factors that have contributed to successful recovery of PGM from oxide material include:
Details of the metallurgical programs and their results will be documented in the Technical Report prepared in accordance with NI 43-101, which will be filed under the Company’s SEDAR profile within 45 days of this news release.
Schedule 3: Geological Interpretation
The Luanga Complex is a 6km long and up to 3.5km wide (~18km²) mafic-ultramafic layered intrusion that belongs to the Neoarchean Large Igneous Province (“LIP”) of the Carajás Mineral Province. Host rocks of the Luanga Complex consist of highly foliated gneisses and migmatites of the Xingu Complex and mafic volcanics plus iron formations of the Grão Pará Group. The igneous layers have consistent steep dips to the SE in the Central and Southwestern portions of the complex, indicating that the layered sequence is tectonically overturned. The Luanga complex is up to 3,500m thick in the central portion of the complex, which is likely to represent the axial portion of the original magma chamber. Metamorphic assemblages are at the transition of greenschist to amphibolite facies and commonly replace the primary igneous minerals of the Luanga complex. This metamorphic alteration is heterogeneous, largely preserving primary textures, bulk rock compositions and the compositional domains of igneous minerals, thus allowing the identification of primary rocks throughout the intrusion. The layered sequence is subdivided based on the different type and/or proportion of cumulus minerals in three zones, Ultramafic Zone (“UZ”), Transition Zone (“TZ”) and Mafic Zone (“MZ”).
The UZ is up to 800m thick and consists of wehrlite (Olivine (“Ol”) + Clinopyroxene (“Cpx”) cumulates) and lesser dunite and Cpx. The contact of the UZ with the stratigraphically overlying TZ is indicated by a few meters thick upward transition from Cpx bearing cumulates to Opx bearing cumulates (orthopyroxenite (“Opx”) and minor harzburgite(“Hz”)) in the TZ. Typically, ultramafic rocks of the TZ are partially to extensively altered, consisting mainly of serpentinites. The UZ follows the stratigraphy of the Luanga complex but at the northern portion the UZ occurs as discordant irregular zones of variably altered ultramafic cumulates within host rocks.
The TZ consists of an up to 500m thick pile of interlayered ultramafic and mafic cumulate rocks. Interlayering of different rock types is a distinctive feature of the TZ. Cumulate rocks have variable textures, from adcumulate to orthocumulate, and variable assemblages of cumulus and intercumulus minerals. The most common rock types are Opx and lesser interlayered norite and Hz. Chromitite layers with variable thickness (commonly 10cm but up to 60cm) and textures occur mainly in the upper portions of the TZ and the lowermost portion of the MZ. Chromitites are fine- to medium-grained chromite cumulates with variably altered intercumulus plagioclase (“Pl”) and orthopyroxene.
The MZ, about 5km long and up to 1.5km thick, comprises a thick monotonous pile of noritic rocks. Norite (Opx + Pl cumulate) consists of medium-grained massive rocks variably altered to fine-grained aggregates consisting mainly of amphiboles (hornblende-actinolite), chlorite and epidote-group minerals. Minor interlayered ultramafic rocks in the MZ, including Opx and minor chromitite, have petrographic features like those described in the TZ.
The Luanga mineralized envelope is continuous along the arc-shaped structure of the mafic-ultramafic complex, striking for approximately 8.1km. The deposit is subdivided into three separate mineralized sectors, named North, Central and Southwestern. The mineralized envelope of the Luanga Complex hosts several PGM mineralized zones, including the Main Sulphide Zone (“MSZ”), which hosts the bulk of current mineral resources. Other mineralized zones are identified within the UZ, the TZ, as well as mineralization hosted in chromitites layers or lenses distributed within the TZ and the immediate contact with the overlying MZ.
Mineralized zones of the Luanga complex are grouped into six different styles of PGM mineralization: (1) MSZ; (2) Low Sulphide Zone (“LSZ”); (3) Chromite-associated Zone (“Chr-PGM”); (4) Ni-Rh Sulphide Zone (“Ni-Rh”); (5) Sulphide Zone (“SZ”) and (6) Massive Sulphides (“MASU”).
The bulk of the world’s PGM resources are mined from mafic-ultramafic layered intrusions, commonly from stratiform mineralized layers located near the transition from mafic to ultramafic cumulate rocks. Magmatic Ni-Cu-PGM sulphides formed by the accumulation of immiscible sulphide liquid, that scavenged chalcophile elements from a coexisting silicate magma. Textural relationships between sulphides and their host silicates are key evidence for their origin as immiscible sulphide liquids. The magmatic origin of the Luanga deposit is supported by textural and mineralogical features described in different styles of PGM mineralization, particularly the MSZ, Ni-Rh and SZ. In these different PGM zones, sulphide blebs consisting of pyrrhotite + pentlandite ± chalcopyrite are interstitial to cumulus olivine and/or pyroxene. In addition, sulphide blebs enclosed in cumulate crystals, as well as their rounded/corroded faces, provide unequivocal evidence for a magmatic origin of sulphides and PGM. Variable litho-chemical features in PGM zones located in distinct stratigraphic horizons of the Luanga complex, including different metal tenors, as well Pt/Pd and Rh/Pd ratios, indicate that several events of mineralization occurred during the magmatic evolution of the Luanga complex. The occurrence of several mineralized horizons in the Luanga complex, including PGM mineralization hosted in chromitites, has remarkable similarity with reef-type productive deposits (e.g., Bushveld and Stillwater).
The widespread alteration of rocks from the Luanga complex has partially disrupted their primary magmatic features. In the Luanga complex, magmatic silicates are partially altered and commonly occur as pseudomorphs. The magmatic sulphides have also been partially altered during the widespread alteration. The most common alteration of primary sulphides (pyrrhotite – pentlandite – chalcopyrite) consists of their replacement by magnetite and Fe-hydroxides. Because this alteration is heterogeneous at different scales (from mineral crystals up to several hundred meters thick zones) and largely preserves primary textures and compositions of cumulate rocks and PGM mineralized zones, magmatic features can be recognized throughout the layered intrusion.
Schedule 4: Assay Methodologies and QAQC
Samples follow a chain of custody between collection, processing, and delivery to the SGS Geosol laboratory in Parauapebas, state of Pará, Brazil. The drill core is delivered to the core shack at Bravo’s Luanga site facilities and processed by geologists who insert certified reference materials, blanks, and duplicates into the sampling sequence. Drill core is half cut and placed in secured polyurethane bags, then in security-sealed sacks before being delivered directly from the Luanga site facilities to the Parauapebas SGS Geosol laboratory by Bravo staff. Additional information about the methodology can be found on the SGS Geosol website (SGS) in their analytical guides. Information regarding preparation and analysis of historic drill core is also presented in the table below, where the information is known. Historical drilling used a similar QAQC procedure, and as described in the section “Luanga Mineral Resource Estimate”. Data generated by this work has been validated statistically to show no significant bias, prior to inclusion.
Quality Assurance and Quality Control (“QAQC“) is maintained internally at the lab through rigorous use of internal certified reference materials, blanks, and duplicates. An additional QAQC program is administered by Bravo using certified reference materials, duplicate samples and blank samples that are blindly inserted into the sample batch. If a QAQC sample returns an unacceptable value an investigation into the results is triggered and when deemed necessary, the samples that were tested in the batch with the failed QAQC sample are re-tested.
| Bravo SGS Geosol | ||||
| Preparation | Method | Method | Method | Method |
| For All Elements | Pt, Pd, Au | Rh | Sulphide Ni | Trace Elements |
| PRPCLI (85% at 200#) | FAI515 | FAI30V | AA04B | ICP40B |
| Historic Drill Assaying SGS Geosol | ||||
| Preparation | Method | Method | Method | Method |
| For All Elements | Pt, Pd, Au | Rh | TOTAL Ni | Trace Elements |
| Crushed to <200 mesh | FA30A | FA30B | ICP-117 | ICP-117 |
Hudbay Minerals Inc. (TSX:HBM) (NYSE: HBM) today released its ann... READ MORE
Strategic acquisition of an established operating gold mine, loca... READ MORE
Cerro de Pasco Resources Inc. (TSX-V: CDPR) (OTCQB: GPPRF) (FRA: ... READ MORE
The Garneau Titanium Project Features Ilmenite-Rich Boulder with ... READ MORE
ValOre Metals Corp. (TSX‐V: VO) (OTCQB: KVLQF) (Frankfurt: KEQ0... READ MORE


