Blackrock Silver Corp. (TSX-V: BRC) (OTCQX: BKRRF) (FSE: AHZ0) is pleased to report the results for its updated mineral resource estimate for its 100% owned Tonopah West project, located in West-Central Nevada within Nye and Esmeralda Counties, Nevada, United States. Tonopah West is conveniently situated directly adjacent to the town of Tonopah in Western Nevada, with highway US 95 crossing the Property, and the resource area lies exclusively within patented mining claims and fee lands. All amounts herein are presented in United States Dollars unless otherwise stated.
HIGHLIGHTS:
Table 1: Tonopah West Updated 2025 Mineral Resource Estimate
| AgEq cutoff g/t (1) |
Tonnes | Silver g/t |
Gold g/t |
AgEq g/t (2) |
Ounces of Silver | Ounces of Gold | Ounces of AgEq(3) | Classification(4) |
| 180 | 1,333,000 | 220.7 | 2.50 | 493.2 | 9,459,000 | 107,000 | 21,139,000 | Indicated |
| 180 | 5,138,000 | 215.1 | 2.85 | 525.9 | 35,536,000 | 470,000 | 86,880,000 | Inferred |
1 AgEq cutoff grade is based a total mining, processing and G&A cost of $129/tonne (see Table 2).
2 Silver Equivalent grade ratio used in this news release is 100:1 which is based on silver and gold prices of $27/ounce and $2,700/ounce, respectively, and recoveries for silver and gold of 87% and 95%, respectively. AgEq Factor= (Ag Price / Au Price) x (Ag Rec / Au Rec) or ($27/$2700) x (0.87/0.95) = 0.009158; g AgEq/t = g Ag/t + (g Au/t / AgEq Factor).
3 Rounding as required by reporting guidelines may result in apparent discrepancies between tonnes, grade, and contained metal content.
4 Mineral resources are not mineral reserves and do not have demonstrated economic viability. An Inferred Mineral Resource has a lower level of confidence than that applying to an Indicated Mineral Resource and must not be converted to a Mineral Reserve. It is reasonably expected that the majority of Inferred Mineral Resources could be upgraded to Indicated Mineral Resources with continued exploration.
5 The estimate of mineral resources may be materially affected by geology, environmental, permitting, legal, title, taxation, sociopolitical, marketing, or other relevant issues, although there are currently no known factors related to these issues which could materially affect these mineral resource estimates.
The Updated MRE was prepared in accordance with Canadian Institute of Mining, Metallurgy and Petroleum Definition Standards – For Mineral Resources and Mineral Reserves adopted by the CIM May 19, 2014, and in accordance with National Instrument 43-101 – Standards of Disclosure for Mineral Projects. The Updated MRE was prepared by RESPEC Company LLC (formerly Mine Development Associates) with an effective date of August 25, 2025.
Andrew Pollard, the Company’s President and Chief Executive Officer, stated, “As evidenced by the Updated MRE, the Company has delivered on its guidance for the M&I Conversion Program, delineating 1.333Mtonnes of indicated mineral resources while maintaining the high-grade (493 g/t AgEq) within the shallowest portion of the Tonopah West deposit. The Updated MRE shows the continuity of high grades within the tighter spaced drill pattern and is showing trends similar to those documented in the historic Victor and Ohio veins located to the east. This upgrade to the DPB South area gives the Company added confidence to pursue the permits required, refine the engineering designs and engage the talent for advancing the project to the next phase which includes an exploration decline, test mining and extracting a bulk sample.”
He continues, “The Company’s current exploration programs at Tonopah West are focused on the expansion opportunities to the northwest and east. The results from the recently completed northwestern expansion drilling programming and the currently active eastern expansion drilling program are intended to be incorporated into an updated mineral resource estimate and updated preliminary economic assessment of the Tonopah West deposit planned for Q1-2026.”
The Updated MRE is presented with block diluted grades. The AgEq block model grades are based on $27 per ounce of silver, $2,700 per ounce of gold, and 87% and 95% recoveries for silver and gold, respectively.
The Updated MRE is reported using a cutoff grade which was calculated from estimated underground mining costs and metallurgical recoveries to meet reasonable prospects for eventual economic extraction. Table 2 shows assumed mining, processing, and G&A costs.
Table 2: Tonopah West mining, processing and G&A costs at the listed gold and silver price
| Parameters Used | USD | Units | ||
| UG Mining | 83 | $/t Mined | ||
| Processing | 36 | $/t Processed | ||
| G&A | 10 | $/t Processed | ||
| Refining | 0.2 | $/oz Ag Produced | ||
| Silver Price | 27 | $/ounce | ||
| Gold Price | 2,700 | $/ounce | ||
| Total | 129 | $/t Processed | ||
| Effective AgEq cutoff | 180 | g/t Ag |
The Updated MRE on Tonopah West has been tabulated by four separate spatial areas or zones that make up the Property (Victor, DPB North, DPB South and Northwest). The areas are not materially different geologically but have been separated for logistical purposes in future mining scenarios.
Table 3: Tonopah West 2023 Updated Resource Estimate by Area
| Area | AgEq cutoff g/t (1) | Tonnes | Silver g/t |
Gold g/t |
AgEq g/t (2) |
Ounces of Silver | Ounces of Gold | Ounces of Silver Equivalent(3) | Classification(4) |
| Victor | 180 | 2,361,000 | 256.7 | 3.08 | 593.2 | 19,486,000 | 234,000 | 45,028,000 | Inferred |
| DPB North | 180 | 229,000 | 166.4 | 2.01 | 386.1 | 1,226,000 | 15,000 | 2,844,000 | Indicated |
| 180 | 1,482,000 | 214.8 | 2.99 | 540.9 | 10,234,000 | 142,000 | 25,767,000 | Inferred | |
| DPB South | 180 | 1,104,000 | 232.0 | 2.60 | 515.5 | 8,232,000 | 92,000 | 18,294,000 | Indicated |
| 180 | 500,000 | 82.7 | 2.70 | 377.2 | 1,328,000 | 43,000 | 6,061,000 | Inferred | |
| NW Step Out | 180 | 796,000 | 175.4 | 1.98 | 391.8 | 4,488,000 | 51,000 | 10,025,000 | Inferred |
| TOTAL | 1,333,000 | 220.7 | 2.50 | 493.2 | 9,459,000 | 107,000 | 21,139,000 | Indicated | |
| TOTAL | 5,138,000 | 215.1 | 2.85 | 525.9 | 35,536,000 | 470,000 | 86,880,000 | Inferred | |
1 AgEq cutoff grade is based a total mining, processing and G&A cost of $129/tonne (see Table 2).
2 Silver Equivalent grade ratio used in this news release is 100:1 which is based on silver and gold prices of $27/ounce and $2,700/ounce, respectively, and recoveries for silver and gold of 87% and 95%, respectively. AgEq Factor= (Ag Price / Au Price) x (Ag Rec / Au Rec) or ($27/$2700) x (0.87/0.95) = 0.009158; g AgEq/t = g Ag/t + (g Au/t / AgEq Factor).
3Rounding as required by reporting guidelines may result in apparent discrepancies between tonnes, grade, and contained metal content.
4 Mineral resources are not mineral reserves and do not have demonstrated economic viability. An Inferred Mineral Resource has a lower level of confidence than that applying to an Indicated Mineral Resource and must not be converted to a Mineral Reserve. It is reasonably expected that the majority of Inferred Mineral Resources could be upgraded to Indicated Mineral Resources with continued exploration.
5 The estimate of mineral resources may be materially affected by geology, environmental, permitting, legal, title, taxation, sociopolitical, marketing, or other relevant issues, although there are currently no known factors related to these issues which could materially affect these mineral resource estimates.
Recent Blackrock drilling which underpins the Updated MRE is summarized in Tables 4 and 5.
Table 4: Summary of Blackrock drilling to date summarized by metre
| Hole Type | Unit | 2020 | 2021 | 2022 | 2023 | 2024 | 2025 | Total |
| RC/Core | metres | 3,931.0 | 28,530.2 | 19,129.9 | 0 | 14,753.5 | 20,139.2 | 86,483.8 |
| Core | metres | 2,633.8 | 9,856.6 | 0 | 0 | 2,589.6 | 1,935.5 | 17,015.5 |
| RC/Core | metres | 22,110.2 | 30,722.3 | 4,748.8 | 0 | 411.5 | 3,445.8 | 61,438.5 |
| Total | 28,675.1 | 69,109.1 | 23,878.6 | 0 | 17,754.6 | 25,520.4 | 164,937.9 |
Table 5: Summary of Blackrock drilling to date summarized by hole count
| 2020 | 2021 | 2022 | 2023 | 2024 | 2025 | Total | |
| RC/Core | 6 | 47 | 33 | 0 | 39 | 54 | 179 |
| Core | 5 | 14 | 0 | 0 | 8 | 11 | 38 |
| RC | 42 | 54 | 9 | 0 | 1 | 9 | 115 |
| Total | 53 | 115 | 42 | 0 | 48 | 74 | 332 |
The Updated MRE includes 83 new drillholes (representing 33,248 metres of total aggregate drilling) completed in 2024-2025 by Blackrock since the Previous MRE. Blackrock drilling represents 96% of the drillholes contributing to the Updated MRE.
Recent drilling by the Company focused its efforts on collecting drillhole exploration data in key areas of the deposit, including high-density drilling in the DPB South area on 30 metre centers and step-out drilling in the Northwest zone to test mineralization continuity.
The Updated MRE is based on drillholes which are oriented between 90 to 50 degree inclinations from the surface, with up to three drillholes at different inclinations completed from the same drill pad. Drillholes are spaced approximately every 30 metres in the DPB South zone and 50 to 100 metres along sections with 50 metre distance between sections in DPB North and Northwest. At Victor, drillholes are spaced between approximately 25 to 50 metres apart along sections with the sections 50 to 100 metres apart.
The Updated MRE encompasses Victor, DPB North, DPB South, and Northwest zones. The Victor area is approximately 700-metres by 350-metres while the DPB North area is 500-metres by 600 metres, DPB South area is 800 metres by 700 metres, the Northwest area is 1300 metres by 100 metres.
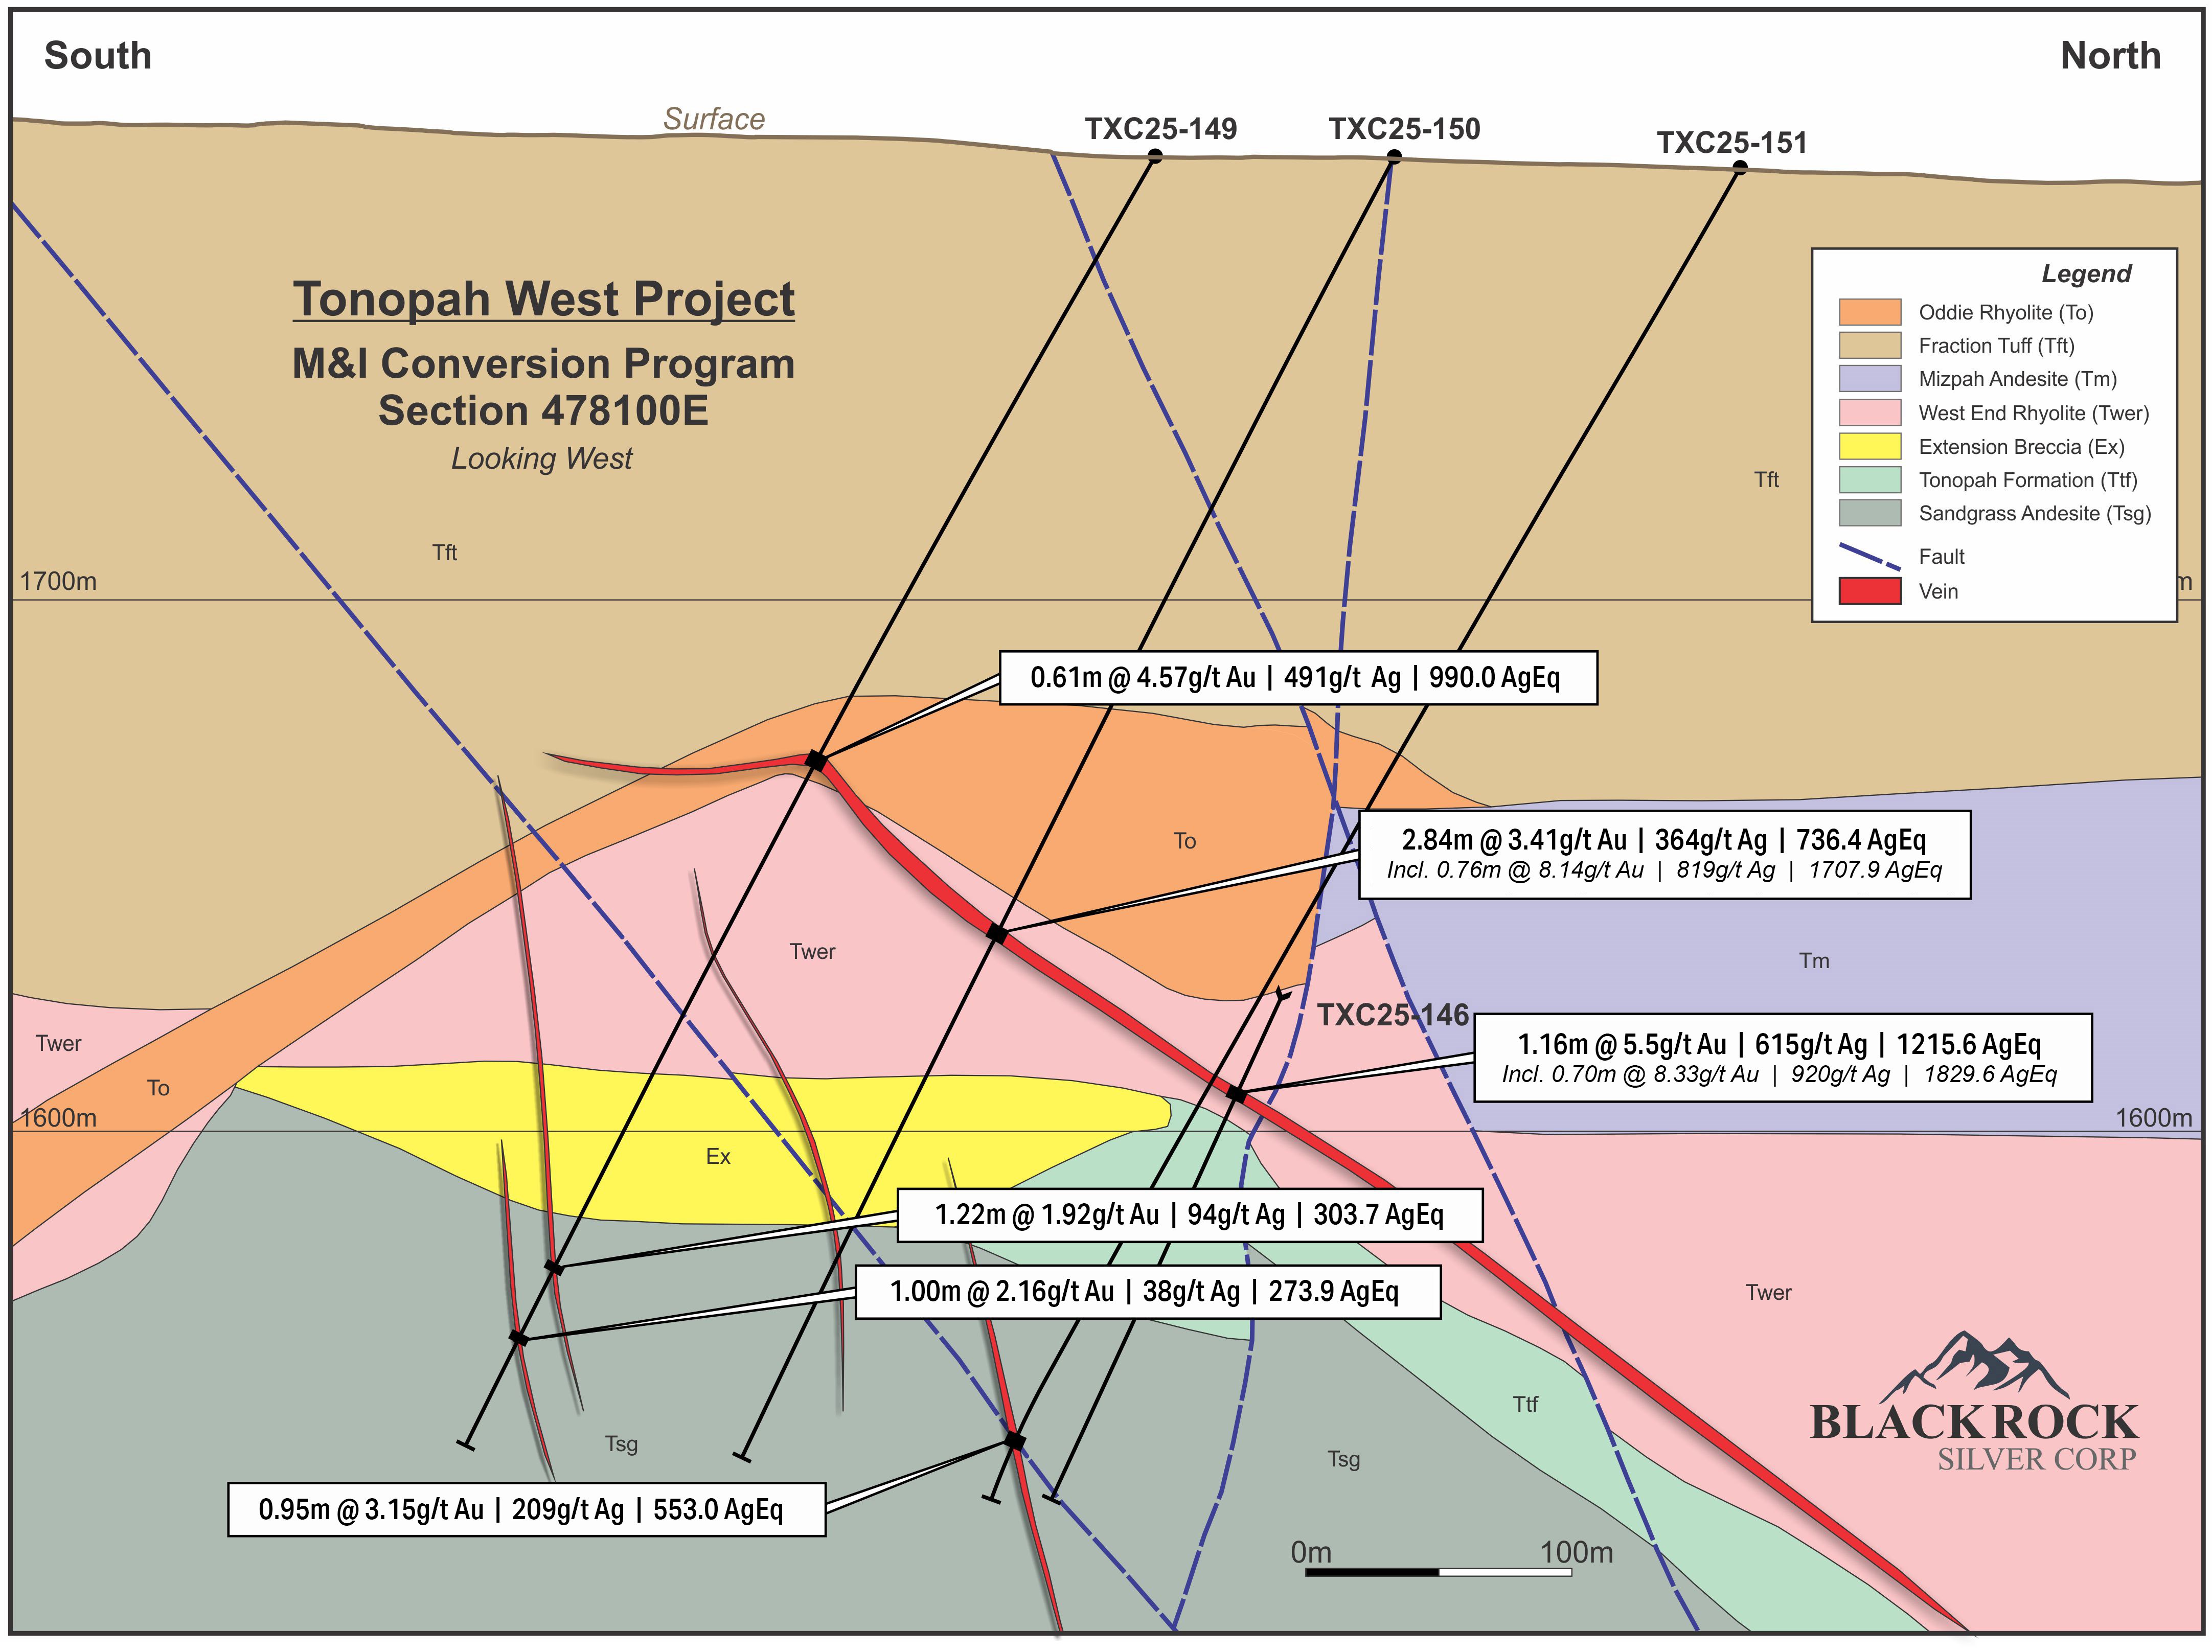
RESPEC was supplied with vein shapes on cross-sections and level-plans generated by Blackrock which were subsequently solidified into a three-dimensional geologic model. Mineralized vein thicknesses in the model ranged from 0.1 to 15.8 metres and averaged 3.0 metres. A representative cross-section of deposit geology and vein intercepts is provided in Figure 1. Silver and gold mineral resources were modelled and estimated as follows:
Figure 1: Representative Cross-Section Showing Geology and Mineralized Veins
To view an enhanced version of this graphic, please visit:
https://images.newsfilecorp.com/files/676/265525_ef20c5c7249798df_001full.jpg
Drillhole assay samples were composited within the mineralized domains. High-grade capping was completed on composite data and established using a statistical analysis for silver and gold. Silver was capped at 3,000 g/t, and gold was capped at 30 g/t.
Specific gravity test work was completed for 370 core samples. Results indicate an average density of 2.46 grams/cm3 for low-grade mineralized vein material, 2.53 grams/cm3 for mid- and high-grade mineralized vein material, and values ranging from 2.11-2.47 grams/cm3 for unmineralized wall rock, which varies by geologic formation.
RESPEC utilized Inverse Distance Cubed (ID3) interpolation for the estimation to obtain a localizing effect in the mid- and high-grade domains, and an Inverse Distance Squared (ID2) in the low-grade domains where mineralization is more diffuse. All estimates are based on a block dimension of 1 metre by 1 metre by 1 metre blocks.
The original deposit had been depleted by historical mining in the Victor area. Approximately 200,000 tonnes of material was removed from the Victor mineral resource estimate.
A cutoff grade for the reported resource of 180 g/t AgEq was selected based on assumed mining costs for underground methods along with processing and G&A costs (see Table 2). At a 180 g/t AgEq cutoff, the average grade of the indicated and inferred mineral resources comprising the Updated MRE is 493.4 g/t AgEq and 525.8 g/t AgEq, respectively.
A technical report is being prepared on the Updated MRE in accordance with NI 431-101 and will be available on the Company’s website and on SEDAR+ at www.sedarplus.ca within 45 days of the date of this news release.
Qualified Persons
The Updated MRE was prepared under the supervision of Mr. Jeffrey Bickel, CPG, an employee of RESPEC who is independent of the Company and a qualified person as defined under NI 43-101. Mr. Bickel has reviewed and approved the technical contents relating to the Updated MRE in this news release.
Blackrock’s exploration activities at Tonopah West are conducted and supervised by Mr. William Howald, Executive Chairman of Blackrock. Mr. William Howald, AIPG Certified Professional Geologist #11041, is a qualified person as defined under NI 43-101. Mr. William Howald has reviewed and approved the technical contents of this news release as related to exploration activities at Tonopah West.
Quality Assurance/Quality Control
Mr. Bickel has reviewed the sampling, assaying, and security procedures used at Tonopah West and it is his opinion that they follow industry standard procedures, and are adequate for the estimation of the current MRE and for use in preparing the Technical Report.
Mr. Bickel completed an audit of the database, verified data underpinning the MRE, visited the project site, and reviewed quality assurance and quality control data. He considers the assay data to be adequate for the estimation of the current MRE and for use in preparing the Technical Report.
2025 Precious Metals Summit
Blackrock will be attending the 2025 Precious Metals Summit (the “Summit”) in Beaver Creek, Colorado being held on September 9-12, 2025.
Blackrock’s President & Chief Executive Officer, Andrew Pollard, will be presenting at the Summit on Tuesday, September 9th at 1:00pm MT. The presentation will be webcast live (and available for replay), in addition to 1-on-1 meetings with institutional investors and corporates throughout the conference.
To view the webcast (and replay) please visit: https://www.gowebcasting.com/conferences/2025/09/09/precious-metals-summit
About Blackrock Silver Corp.
Backed by gold and silver ounces in the ground, Blackrock is a junior precious metal focused exploration and development company driven to add shareholder value. Anchored by a seasoned Board of Directors, the Company is focused on its 100% controlled Nevada portfolio of properties consisting of low-sulphidation, epithermal gold and silver mineralization located along the established Northern Nevada Rift in north-central Nevada and the Walker Lane trend in western Nevada.
Additional information on Blackrock Silver Corp. can be found on its website at www.blackrocksilver.com and by reviewing its profile on SEDAR at www.sedarplus.ca.
Broad Gold Mineralization Starts at Surface, Returning 1.86 g/t A... READ MORE
Lithium Africa Corp. (TSX-V: LAF) (FSE: 6MQ) (OTCQB: LTAFF) is pl... READ MORE
Drilling also returns 134.0 m of 0.65 g/t Au in the Lower Domain;... READ MORE
Copper Road Resources Inc. (TSX-V: CRD) is pleased to announce th... READ MORE
Brunswick Exploration Inc. (TSX-V: BRW) (OTCQB: BRWXF) (FRANKFUR... READ MORE