


Battle North Gold Corporation (TSX: BNAU) (OTCQX: BNAUF) announces a positive Feasibility Study1 for the shovel-ready Bateman Gold Project. All references to dollars herein are in Canadian dollars unless otherwise specified. Numbers in tables and diagrams may not add due to rounding.
Bateman Gold Project Feasibility Study Highlights:
Table 1: Economic analysis summary (estimates)
| Metrics | Gold Price Assumption Per Ounce (“oz”) | |
| US$1,525
(Base Case) |
US$1,900 | |
| After-tax Internal Rate of Return (“IRR“)(%) | 50.3% | 86.4% |
| After-tax Net Present Value2 (“NPV5%“) | $305.0 million | $531.4 million |
| After-tax Cumulative Life of Mine (“LOM“)
Free Cash Flow3 (“FCF“), Net of Initial Capital |
$418.5 million | $698.3 million |
| FX rate assumption (CAD$/US$) | 0.7407 | 0.7407 |
| NPV5%/Initial Capital ratio | 2.8 | 4.9 |
| Payback period | 3.6 years | 2.6 years |
| Remaining tax loss pools after LOM | $406.7 million | $143.1 million |
Table 2: LOM plan summary (Base Case estimates)
| Metrics | Total | Per Unit |
| Total LOM from Initial Production | 8.2 years | – |
| Commercial Production period4 (“CP“) | 7.0 years | – |
| Project construction start to Initial Production | 7 months | – |
| Project construction and ramp-up to CP (“Pre-CP“) | 21 months | – |
| LOM ore tonnes milled (including Pre-CP tonnes)(“LOM tonne“) | 3,562,572 | 1,208 tonnes per day (“tpd“) |
| CP ore tonnes milled (“CP tonne“) | 3,314,309 | 1,315 tpd |
| Dilution (external and backfill)(%)/mining recovery (%) | 16.6%/95.0% | – |
| LOM mill head grade5 | 5.54 g/t Au | – |
| Gold recoveries (%)/via gravity (%) | 95.0%/43.0% | – |
| LOM payable gold production (including Pre-CP oz)(“LOM oz“) | 602,987 oz | 73,835 oz/LOM year |
| Payable gold during Pre-CP (“Pre-CP oz“) | 47,829 oz | – |
| CP Payable gold production (“CP oz“) | 555,158 oz | 79,308/CP year |
Table 3: LOM Capital and Operating Costs Summary (Base Case estimates)
| Metrics | Total (millions) | Per Unit | Per Ounce |
| Capital costs: | |||
| (A) Initial Capital (including 10% contingency6)(Pre-CP) | $109.3 | – | – |
| (B) Pre-CP operating costs | $62.5 | $252/Pre-CP tonne | US$968/Pre-CP oz |
| (C) Royalties (3%) and other production taxes7 (Pre-CP) | $1.7 | $7/Pre-CP tonne | US$27/Pre-CP oz |
| (D) Proceeds from sale of Pre-CP oz @ US$1,525/oz | $98.4 | – | – |
| (E) Net Pre-CP operating cash flow: (D) – (B) – (C) | $34.2 | – | – |
| Net Pre-CP Capital: (A) – (E) | $75.1 | – | – |
| Projected Funding Requirement8 (@ US$1,525/oz) | $93.2 | – | – |
| (F) Sustaining Capital (CP) | $188.8 | $27 million/CP year | US$252/CP oz |
| (G) Total LOM capital expenditures: (A) + (F) | $298.1 | $37 million/LOM year | US$366/LOM oz |
| Operating costs: | |||
| Mining | $336.9 | $95/LOM tonne | US$414/LOM oz |
| Processing | $123.9 | $35/LOM tonne | US$152/LOM oz |
| Site G&A | $24.2 | $7/LOM tonne | US$30/LOM oz |
| (H) Total LOM operating costs | $485.0 | $136/LOM tonne | US$596/LOM oz |
| (I) Total commercial operating costs (CP): (H) – (B) | $422.5 | $127/CP tonne | US$564/CP oz |
| (J) Royalties (3%) and other production taxes7 (CP) | $37.2 | $11/CP tonne | US$50/CP oz |
| (K) Total Cash Costs (CP): (I) + (J) | $459.7 | $139/CP tonne | US$613/CP oz |
| (L) All-in sustaining costs9 (“AISC”)(CP): (F) + (K) | $648.5 | $196/CP tonne | US$865/CP oz |
| (M) All-in costs (“AIC”): (G) + (H) + (C) + (J) | $822.0 | $231/LOM tonne | US$1010/LOM oz |
| Tax loss pools: | |||
| Existing tax loss pools (N) | $703.5 | – | – |
| Tax loss pools utilized in the LOM plan (O) | $296.8 | – | – |
| Remaining tax loss pools after conceptual LOM (N) – (O) | $406.7 | – | – |
Key Takeaways from the Feasibility Study:
CEO Comment
Battle North President and CEO George Ogilvie, P.Eng., stated, “I am very pleased to deliver the maiden Feasibility Study for our shovel-ready Bateman Gold Project, which demonstrates the Project’s robust commercial viability as an operating mine in the prestigious Red Lake Gold Mining camp. At a US$1,525/oz gold price assumption, the Feasibility Study estimates LOM Free Cash Flow generation at $419 million, a 50.3% after-tax IRR, a $305 million after-tax NPV5%, C1 Cash Costs and AISC of US$613/oz and US$865/oz, respectively, during the Commercial Production period. There are few stand-alone projects in the world that are as substantially de-risked, with significant infrastructure, with a short timeline to Initial Production, in a safe jurisdiction, as the Bateman Gold Project. The Feasibility Study reflects a purposeful focus on rigor and prudence as the foundation for the prospective construction and operation of the Project. We believe the Feasibility Study is a well-designed, comprehensive plan assembled under the direction of a management team and consultants with successful and extensive underground mine operations experience.”
“I am proud of the Battle North team and the work that has been completed over the last several years to get the Project to this stage. Subject to Board review and approval, we will be tasked with initiating construction and bringing the Project to Commercial Production. We have commenced the development planning for the Bateman Gold Project, including a full risk assessment. We have strategies in place to mitigate ramp-up risks including targeting capital development of at least 9 months ahead of the mine plan, infill drilling the F2 Gold Deposit to 10 m drill centres, creating ramp access to increase shaft capacity, and installing an ammonia reactor in the wastewater treatment plant before operating the mill. Most importantly, we have an operating team with extensive experience in building, operating and turning around underground mines; the collective operating experience of the Battle North team will be a significant factor in ultimately achieving a successful ramp-up to Commercial Production.”
“We currently have $55 million of cash on our balance sheet that is dedicated to fund the development capital of the Project. We are also in advanced discussions with lenders to secure a debt facility to fund the remaining development capital and achieve a fully-funded Project.”
“Battle North is now well-positioned for near-term and long-term success: the Bateman Gold Project is poised for prospective development to Commercial Production, the Company is on track to deliver NI 43-101 Mineral Resource estimates at the McFinley and Pen Zones within the next six months, and we have commenced a regional exploration program of our Red Lake Properties. We are very pleased to have reached this important milestone for our shareholders, our employees, the community of Red Lake, and all of our other stakeholders.”
Underground Development: The Key to Successful Mining
The Project benefits from more than 14,000 m of extensive developed mine workings and related site infrastructure. The Project has an operational shaft down to 730 m below the surface, with loading pockets located at the 337 m and 685 m Levels. Most of the existing underground development, including lateral development, a partially completed ramp system, waste/ore passes, and ventilation raises, are located between 122 m and 305 m Levels.
The Feasibility Study contemplates an estimated 36,657 m of underground waste development (28,123 m lateral, 6,839 m ramp, and 1,695 m vertical) throughout the LOM plan. The increase in underground development metres compared to the 2019 PEA10 is attributed to higher estimated ore tonnes in the Feasibility Study LOM mine plan and additional lateral development to access the stopes as a result of additional engineering. The Feasibility Study contemplates an estimated 8,562 m of underground waste development, including raises for ventilation and a ramp to surface, for the 21-month Pre-CP period. The Pre-CP underground development metres are anticipated to provide access to an estimated 40 to 50 working stopes and up to 9 months of development flexibility ahead of mining, before Commercial Production is forecast to be declared. The Feasibility Study contemplates the use of contractors during the Pre-CP development with a transition to an owner-operated team during CP. The Feasibility Study assumes peak development rates of 24 m (or ~6 rounds) per day, with an average of 18.2 m (~5 rounds) per day LOM. Please see Diagram 1 for LOM underground development plan contemplated by the Feasibility Study.
Mining and Stope Information: A Robust Bulk Mining Operation
The Feasibility Study contemplates mining 403 stopes comprising more than an estimated 3.5 million tonnes of ore over the estimated LOM. Based on a US$1,375/oz gold price assumption, the stope shapes were designed using a blended 3.41 g/t Au mining cut-off grade (including Cut-and-Fill Talc stopes, where a 5.0 g/t Au mining cut-off grade was applied). The Company and its consultants identified an additional 100 stopes that fall below the 3.41 g/t Au mining cut-off grade assumed in the Feasibility Study (and are therefore not included) which could potentially be included in a future LOM plan with further engineering, infill diamond drilling, and utilizing a lower mining cut-off grade (based on a higher gold price assumption). The Feasibility Study reflects extensive geo-mechanical and geo-technical analysis towards the stope design and underground development planning, resulting in smaller average stopes sizes that require additional underground development metres when compared to the 2019 PEA10.
Four mining methods are contemplated by the Feasibility Study: Sub-Level Longhole (bulk mining, 64% LOM tonnes), Uppers (bulk mining, 16% LOM tonnes), Mass Blasting Raise Mining (“MBRM“) (bulk mining, 13% tonnes) and C&F (selective mining, 7% tonnes). Table 7 provides additional detail on these mining methods as contemplated by the LOM plan in the Feasibility Study. The amenability of Sub-Level Longhole and Uppers mining methods was demonstrated during the test trial mining program in 201811. An opportunity for the Project is the potential to expand the use of MBRM due to its minimal use of sub-level development and the ability to mine narrow widths (down to 1.2 m).
The Feasibility Study contemplates that mined ore will be mucked from the stope draw point, transported to Level re-mucks where it will be loaded into trucks for haulage to surface or to the 610 m Level truck dump/grizzly prior to being skipped to surface and stockpiled. Prior to mill processing, the stockpiled ore would be sent to the primary surface crusher and crushed to a size minimum size of 150 mm (or 6-inch minus), the optimal feed for the Semi-Autogenous mill.
The Feasibility Study estimates total LOM payable gold production of 602,987 oz over a period of 8.2 years, of which 47,829 ounces of production is estimated during the 21-month Pre-CP ramp-up period. Annual production during CP averages an estimated 79,308 oz per year over the 7-year CP period. Please see Diagram 2 for the LOM production profile under the Feasibility Study.
Mill Processing and TMF: Benefiting from Substantial Surface Infrastructure
The Project has an operational mill processing facility at site. The main components of the Project mill are a SAG grinding unit, Knelson gravity concentrators, a ball mill, and the carbon-in-leach circuit. The Project mill has an estimated top-end capacity throughput of 1,800 tpd at the current configuration with minor upgrades. Prospective further capital upgrades (primarily installing an additional ball mill) could potentially expand mill capacity up to an estimated 2,500 tpd. During the 2018 bulk sample processing program11, the existing Project mill achieved an average throughput of 1,540 tpd (based on a 22-hour mill availability) and gold recoveries of 95.1% (43.2% from gravity); the Feasibility Study assumes similar mill recovery estimates.
The Feasibility Study contemplates a 21-month ramp-up period to Commercial Production4, which commences in Year 1 of the LOM financial model in the Feasibility Study (See Table 8 for LOM financial model). The LOM plan in the Feasibility Study forecasts commencement of stockpiling ore shortly after the start of construction, with processing of stockpiles forecast to commence after 7 months of the Pre-CP period (i.e., in Year -2 stub year). The Feasibility Study assumes an application to amend the Project permits to a higher throughput rate of 1,800 tpd during the Pre-CP period in order to be able to operate above 1,250 tpd from Year 2 of CP.
The Project currently has an existing TMF and operating water treatment plant. The Feasibility Study includes the expansion of the TMF and addition of an ammonia treatment unit to the current water treatment plant.
Capital and Operating Costs Estimates
Please see Table 3 for a summary of the Feasibility Study capital and operating costs estimates. Please see Table 4 for more details on the Initial and Sustaining Capital estimates in the Feasibility Study.
Capital Costs
The Feasibility Study estimates total LOM capital expenditures are to be $298.1 million, comprised as follows:
Table 4: LOM Capital Costs estimates
| Capital item | Pre-CP (millions) |
CP (millions) |
| Underground development and infrastructure | $55.7 | $124.7 |
| Equipment lease | $5.4 | $50.3 |
| Surface and mill (including TMF, water treatment, crushers, camp upgrades, buildings, etc.) | $34.1 | $13.7 |
| EPCM Team | $3.6 | |
| Closure costs | – | $7.7 |
| Salvage | ($7.6) | |
| Contingency (10%) | $10.5 | – |
| Total Initial Capital | $109.3 | – |
| Total Sustaining Capital | – | $188.8 |
| Total LOM capital expenditures | $298.1 | |
| Pre-CP Production | ||
| Pre-CP operating costs | $62.5 | – |
| Royalties and other production taxes7 | $1.7 | |
| Proceeds from sale of Pre-CP oz @ US$1,525/oz | $98.4 | – |
| Net Pre-CP operating cash flow | $34.2 | – |
| Net Pre-CP Capital | $75.1 | – |
| Projected Funding Requirement8 | $93.2 | – |
The largest component of the LOM capital costs estimated in Feasibility Study are underground development expenditures. Including indirect costs, the Feasibility Study estimates that the average cost per underground development metre ranges between $5,000 to $6,000 per metre for lateral and ramp development. The Feasibility Study assumes equipment lease financing of the mining fleet throughout the LOM plan. The estimated increase in the Initial Capital “Surface and mill” segment compared to the 2019 PEA10 can be explained by the contemplated expansion of the TMF. The increase in the Initial and Sustaining Capital “Underground development and infrastructure” segment compared to the 2019 PEA10 is explained by the increase in estimated ore tonnes in the LOM plan and contemplated increase in underground development metres as a result of the geo-mechanical and geo-technical analysis.
Operating Costs
The Feasibility Study’s operating costs estimates during CP contemplate predominantly owner-operated rates. The largest component of operating costs is labour, which accounts for approximately 50-60% of the total costs. The predominant deployment of productive bulk mining methods in the LOM plan has translated into CP operating cash costs of $139 per tonne or US$613 per ounce, respectively. Please see Table 3 for a summary of the Feasibility Study’s operating costs estimates and Table 7 for the estimated cost per tonne of each mining method contemplated in its LOM plan.
Tax Loss Pools, Royalties, and Other Production Taxes
The Company currently has approximately $704 million of tax-deductible pools, tax losses, and tax credits available for deduction during CP. In the Feasibility Study, application of these tax loss pools is estimated to result in the payment of no income taxes against the estimated LOM net income generated by the Project under Base Case assumptions (see Table 6) and improve estimated LOM FCF by approximately $132 million. The Feasibility Study estimates that Battle North would have $407 million of unused federal and provincial tax loss pools at the end of the LOM Base Case economic assumptions. In the current gold price environment, it is projected that the $704 million of tax loss pools will be depleted during LOM plan.
The mineral claims that comprise the Project’s F2 Gold Deposit are subject to a 3% NSR (2.0% NSR payable to Franco-Nevada; 1.0% NSR payable to Royal Gold). Other production costs include estimated LOM community payments.
Feasibility Study Mineral Reserve and Mineral Resource Estimates
The Mineral Reserve and Mineral Resource estimate for the Project in the Feasibility Study is based on a 3.41g/t Au mining cut-off grade (except for C&F stopes, which are based a 5.0 g/t Au). See Table 5 for further details.
Table 5: Feasibility Study Mineral Reserve and Mineral Resource Estimate
| Category | Quantity (tonnes) | Grade (g/t Au) | Contained Gold (oz) |
| Proven Reserve | 339,227 | 5.76 | 62,830 |
| Probable Reserve | 3,223,337 | 5.52 | 572,009 |
| Total Reserves | 3,562,565 | 5.54 | 634,838 |
| Measured (M) | 391,000 | 6.50 | 81,700 |
| Indicated (I) | 1,115,000 | 7.49 | 268,600 |
| M + I Resource | 1,506,000 | 7.24 | 350,300 |
| Inferred Resource | 1,303,000 | 6.50 | 272,200 |
| Notes:
· Effective date is September 7, 2020. · The Feasibility Study Mineral Reserve estimates uses a break-even blended economic mining cut-off grade of 3.41 g/t Au based on assumptions of a gold price of US$1,375/oz, an exchange rate of US$/C$0.76, mining cash costs of $98/t, processing costs of $25/t, G&A and other (including exploration, refining, transport, and royalty costs) of $30/t, and mining recovery of 95%. · The Feasibility Study Mineral Resource estimates use a break-even economic cut-off grade of 3.0 g/t Au based on assumptions of a gold price of US$1,400/oz, an exchange rate of US$/C$ 0.74, mining cash costs of C$97/t, processing costs of C$33/t, G&A of C$18/t, sustaining capital C$20/t, refining, transport and royalty costs of C$59/oz, and average gold recoverability of 95%. · Reported from within an envelope accounting for mineral continuity. · All figures are rounded to reflect the relative accuracy of the estimates and totals may not add correctly. |
|||
The Feasibility Study Mineral Reserve and Mineral Resource estimate is entirely within the F2 Gold Deposit of the Project. The high-titanium basalt units represent the main host rock for gold mineralization, followed by the Felsic Intrusive Units. A small proportion of mining contemplated by the Feasibility Study is planned in the Ultramafic/Ultramafic Talc Units. The near-vertical orientation of the deposit and strong competency of the High-Ti Basalt Units are expected to mitigate external dilution, as was previously demonstrated by during the 2018 test trial mining program11. The F2 Gold Deposit remains open at depth and along strike.
Economics, Cash Flow Model and Valuation Sensitivities
The Feasibility Study demonstrates robust after-tax IRR and NPV5% estimates of 50.3% and $305.0 million, respectively, and LOM FCF (net of Initial Capital) of $418.5 million, using a Base Case gold price assumption of US$1,525/oz LOM. At US$1,900/oz, which is close to current spot prices, after-tax IRR, NPV5% and LOM FCF (net of Initial Capital) estimates increase significantly to 86.4%, $531.4 million, and $698.3 million, respectively. Please see Table 8 for the Feasibility Study LOM financial model. Please see Diagram 3 for an illustrative chart of the Feasibility Study’s estimates of Annual and Cumulative LOM FCF at US$1,525/oz and US$1,900/oz gold prices, respectively.
Sensitivities of the Feasibility Study estimates for Project after-tax IRR and NPV5% are provided for gold price and CAD/USD exchange rate estimates in Table 6 below. Other such sensitivities under different scenarios for LOM grade, throughput, capital and operating costs are provided in Diagram 4.
Table 6: Gold Price and CAD/USD Exchange Rate Sensitivities – After-Tax IRR (%) and NPV5% ($millions)
| CAD/USD
Rate |
Gold Price (US$/oz) | |||||||
| US$1,200 | US$1,325 | US$1,400 | US$1,525
Base Case |
US$1,600 | US$1,700 | US$1,900 | US$2100 | |
| 0.84 | 6%/$9 | 17%/$19 | 23%/$121 | 34%/$191 | 40%/$233 | 48%/ $289 | 64%/ $400 | 82%/ $510* |
| 0.80 | 12%/42 | 23%/$116 | 29%/$160 | 40%/$233 | 46%/$277 | 55%/ $336 | 73%/ $454 | 91%/ $552* |
| 0.7407
Base Case |
20%/$100 | 32%/$178 | 39%/$226 | 50%/$305 | 57%/$352 | 67%/ $416 | 86%/ $531* | 107%/ $622* |
| 0.70 | 27%/$143 | 39%/$227 | 46%/$278 | 59%/$361 | 66%/$412 | 76%/ $479 | 98%/ $582* | 120%/ $677* |
| 0.66 | 34%/$192 | 47%/$281 | 55%/$335 | 68%/$423 | 76%/$477 | 87%/ $535* | 110%/ $637* | 135%/ $737* |
| *Scenarios where entire the $704 million of tax loss pools are depleted | ||||||||
Implementation Plan: Mitigating Risks During Ramp-Up to CP
A construction decision on the Project remains subject to ongoing review and, ultimately, approval by the Company’s Board of Directors. However, in the interim, Battle North will be working to develop an implementation plan for development of the Project as contemplated by the Feasibility Study. The Company understands that bringing development-stage projects to Commercial Production entails numerous risks and, therefore, will also be focused on mitigating such associated risks and potential issues including those related to the construction of an underground mine and ramp-up to Commercial Production. Some of these risk mitigation factors and strategies are outlined below:
Optimization Opportunities
Battle North has identified the following opportunities to enhance the Feasibility Study, which the Company will evaluate in due course:
The Path Forward
Permitting, Consultation, Closure and Rehabilitation
The Company will qualify for the material permits required for an average production rate of 1,250 tpd upon the successful implementation of an ammonia treatment upgrade to the Project’s water treatment system and the installation of sceptic field bed systems throughout the site. At a future juncture, Battle North will evaluate the permit amendments required for the increased projected production rate. The Company believes the increased production rate envisaged in the Feasibility Study will not materially increase the surface area of the Project site, which could potentially simplify the permit amendment and associated consultation processes.
Rehabilitation measures have been designed using a precautionary approach targeting the long-term physical and environmental stability of the site in accordance with applicable legislation and the associated First Nations’ consultation process. The rehabilitation measures are intended to return the site to a productive land use that will not require long-term care and maintenance. The Feasibility Study estimates the end of LOM rehabilitation costs to be $7.7 million, offset by an estimated salvage value of material site assets at closure of $7.6 million.
The Company is continuing consultations with the impacted First Nations communities, and local municipalities. Battle North currently has Exploration Agreements in place with those First Nations communities and expects to commence IBA discussions soon.
Consultants and Technical Report
The Feasibility Study was conducted by T. Maunula & Associates Consulting Inc. a consulting practice independent of the Company. Since 2017, TMAC has worked closely with Battle North on its Mineral Resource estimation and its 2019 PEA10. The Company plans to file an updated technical report for the Project reflecting the Feasibility Study, prepared in accordance with National Instrument 43-101 of the Canadian Securities Administrators (“Technical Report“), on www.sedar.com within 45 days.
Qualified Persons and Quality Assurance and Quality Control
The content of this news release (other than tax matters) has been read, verified and approved by Michael Willett, P.Eng., Director of Projects and Isaac Oduro, P.Geo., Manager of Technical Services for Battle North, as well as Andrew Mackenzie, P.Eng. and Tim Maunula, P.Geo. for TMAC, both of whom are independent from the Company. All are Qualified Persons as defined by NI 43-101.
Underground drilling was conducted by Boart Longyear Drilling of Haileybury, Ontario and was supervised by the Battle North exploration team. All assays reported are uncut unless otherwise stated. All samples reported herein were performed by SGS Mineral Services of Red Lake, Ontario. All NQ core assays reported were obtained by fire assay with AA-finish or using gravimetric finish for values over 10.0 g/t Au.
Intercepts cited do not necessarily represent true widths, unless otherwise noted, however drilling is generally intersecting interpreted mineralized zones at angles between -30o and +30o. True width determinations are estimated at 65-80% of the core length intervals for the 305 m Level drilling, and estimated at 75-95% of the core length for the 610 and 685 m Level drilling. Battle North’s quality control checks include insertion of blanks, standards and duplicates to ensure laboratory accuracy and precision.
About Battle North Gold
Battle North Gold is a Canadian gold mine developer led by an accomplished management team with successful underground gold mine operations, finance, and capital markets experience. Battle North owns the significantly de-risked and shovel-ready Bateman Gold Project, located in the renowned Red Lake gold district in Ontario, Canada and controls the strategic and second largest exploration ground in the district. Battle North also owns a large gold exploration land package on the Long Canyon gold trend near the Nevada-Utah border in the United States. Battle North’s shares are listed on the Toronto Stock Exchange (BNAU) and the OTCQX markets (BNAUF). For more information, please visit our website at www.battlenorthgold.com.
Table 7: Mining methods contemplated for the Feasibility Study LOM Plan (Base Case estimates)
| Metrics | Sub-Level Longhole |
Uppers | MBRM | C&F (Ultramafic (“UM“) Talc) |
C&F (High-Ti Basalts, Felsics, UM) |
| Tonnes | 2,270,291 | 584,990 | 465,805 | 227,212 | 14,266 |
| LOM tonnes (%) | 63.7% | 16.4% | 13.1% | 6.4% | 0.4% |
| Total stopes | 141 | 141 | 52 | 63 | 6 |
| Average stope size (tonnes) | 16,101 | 4,149 | 8,958 | 3,607 | 2,378 |
| Average dimensions (m) (height/width/strike) |
40/5/24 | 16/5/19 | 42/4/22 | 16/4/16 | 10/5/16 |
| Total dilution (%)13 | 17% | 15% | 16% | 20% | 14% |
| Average diluted grade (after dilution & mining-loss) |
5.45 g/t Au | 5.40 g/t Au | 5.30 g/t Au | 7.24 g/t Au | 6.92 g/t Au |
| Mining cost per tonne (including indirect costs) |
$79 | $88 | $111 | $234 | $139 |
| Typical productivity rates for these mining methods (tpd) |
510 | 260 | 600 | 140 | 140 |

Table 8: Feasibility Study LOM Cash Flow Model (Base Case estimates) ; Pre-CP = Years -2 (9 month stub year) & -1; CP = Years 1 to 7; Mine closure and salvage = Year 8 (CNW Group/Battle North Gold Corporation)
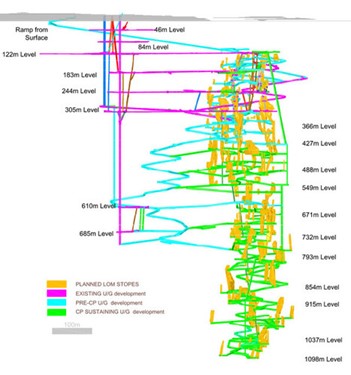
Diagram 1: Feasibility Study LOM Development plan – Looking North (CNW Group/Battle North Gold Corporation)

Diagram 2: Feasibility Study LOM Annual Production, Mill Head Grade, Capital and Operating Costs Profile (Base Case estimates) (CNW Group/Battle North Gold Corporation)
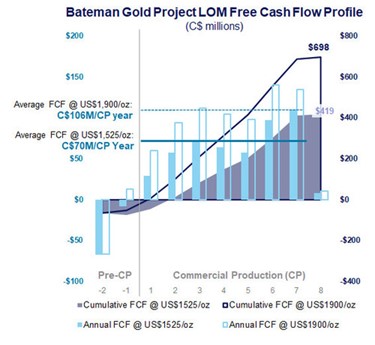
Diagram 3: Feasibility Study LOM Annual and Cumulative FCF Profile at Gold Price Scenarios of US$1,525/oz and US$1,900/oz (CNW Group/Battle North Gold Corporation)
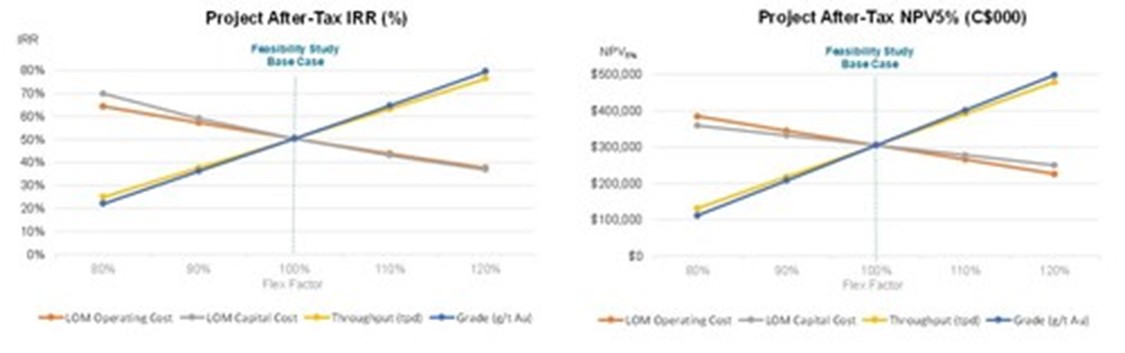
Diagram 4: Sensitivity Graphs – Impact of changes in LOM Capital Costs, Operation Costs, Throughput, and Grade on After-Tax IRR and NPV5% (CNW Group/Battle North Gold Corporation)
Silver Mountain Resources Inc. (TSX-V: AGMR) (OTCQB: AGMRF) is ... READ MORE
Mandalay Resources Corporation (TSX: MND) (OTCQB: MNDJF) announce... READ MORE
Collective Mining Ltd. (TSX: CNL) (OTCQX: CNLMF) (FSE: GG1) is pl... READ MORE
Significant copper and molybdenum intersections include: HM19: 11... READ MORE
Red Pine Exploration Inc. (TSX-V: RPX) (OTCQB: RDEXF) is pleased ... READ MORE


