


![]()
Aya Gold & Silver Inc. (TSX: AYA) (OTCQX: AYASF) is pleased to announce the results of its 2025 Boumadine Preliminary Economic Assessment for the Boumadine Project located in the Kingdom of Morocco. The PEA was prepared in accordance with National Instrument 43-101 – Standards of Disclosure for Mineral Projects by independent Qualified Persons, notably Lycopodium Minerals Canada Ltd and WSP Canada Inc. Please note that all financial figures in this press release are expressed in United States dollars, unless otherwise noted.
2025 PEA Highlights
Table 1: Boumadine Economic Highlights
| Base Case | Spot Prices 2 | |||||||||
| Project Economics | Units | Pre-tax | Post-tax | Post-tax | ||||||
| Gold Price | $/oz | $2,800 | $2,800 | $4,000 | ||||||
| Silver Price | $/oz | $30 | $30 | $48 | ||||||
| Initial Capital Expenditures | $M | $446 | $446 | $446 | ||||||
| AISC1 | $/oz AuEq | $1,021 | $1,021 | $1,068 | ||||||
| Net Present Value (NPV5%)1 | $B | 2.2 | 1.5 | 3.0 | ||||||
| Internal Rate of Return (“IRR”) | % | 69% | 47% | 77% | ||||||
| Payback | Years | 1.3 | 2.1 | 1.2 | ||||||
| NPV:Capex 3 | – | 5.0 | 3.3 | 6.6 | ||||||
| Revenue | $B | 7.0 | 7.0 | 10.1 | ||||||
| Free Cash Flow (FCF)1 | $B | 2.8 | 2.0 | 3.8 | ||||||
|
||||||||||
Robust Project Economics based on an 11-year mine life:
“The Boumadine PEA confirms a highly robust, capital-efficient project that is already significantly de-risked given its conventional flowsheet and high-value concentrates,” said Benoit La Salle, President and CEO. “With industry-leading low initial capex of $446 million, a post-tax NPV of $3.0 billion at spot prices and $1.5 billion under our base case prices, both delivering industry-leading returns on invested capital, Boumadine ranks among the most attractive undeveloped precious metal projects globally. Importantly, this PEA includes only the known mineralized zones on the Boumadine mining license, which represents a small portion of our total land package. With Boumadine‘s mining license already in place, we are advancing development while continuing to drill, unlocking the broader district-scale potential,” said Benoit La Salle, President & CEO.
Table 2: General Project Parameters
| Units | Year 1-5 | LOM | ||
| General | ||||
| Mine Life | Years | – | 11.1 | |
| Open Pit Strip Ratio1 | – | 19.4 | 20.9 | |
| Throughput Capacity | tpd | 8,000 | 8,000 | |
| Total Tonnes Processed | Mt | 13.9 | 31.1 | |
| Open-pit | Mt | 10.4 | 19.4 | |
| Underground | Mt | 3.5 | 11.6 | |
| 1. Strip Ratio is the ratio of waste to mineralized material in open pit production. | ||||
Table 3: Processing and Production Highlights
| Units | Year 1-5 | LOM | ||
| Processed Grade | ||||
| Gold | g/t | 3.15 | 2.43 | |
| Silver | g/t | 85.8 | 72.5 | |
| Zinc | % | 2.05 | 1.91 | |
| Lead | % | 0.66 | 0.70 | |
| AuEq | g/t | 4.76 | 3.85 | |
| AgEq | g/t | 443 | 358 | |
| Production | ||||
| Gold | koz | 1,351 | 2,337 | |
| Silver | koz | 36,894 | 69,874 | |
| Zinc | Mlbs | 468 | 975 | |
| Lead | Mlbs | 166 | 392 | |
| AuEq | koz | 2,006 | 3,643 | |
| AgEq | koz | 187,261 | 340,038 | |
| Avg. Annual AuEq Production | koz/y | 401 | 328 | |
| Avg. Annual AgEq Production | koz/y | 37,452 | 30,611 | |
| Recoveries | ||||
| Gold | % | 96.1% | 96.1% | |
| Silver | % | 96.4% | 96.4% | |
| Zinc | % | 74.7% | 74.7% | |
| Lead | % | 82.0% | 82.0% | |
Cautionary statement: Readers are cautioned that the PEA is preliminary in nature, it includes inferred Mineral Resources that are considered too speculative geologically to have economic considerations applied to them that would enable them to be categorized as mineral reserves, and there is no certainty that the PEA will be realized.
PEA Overview
Project Location
The Boumadine property is located in the Province of Errachidia, Kingdom of Morocco, approximately 220 kilometer east of the City of Ouarzazate and 70 km southwest of the City of Errachidia. Boumadine’s land package covers 339 km², with an additional 600 km² under exploration authorization, for a total area encompassing 31 permits and licenses. The Mineral Resource estimate underpinning this PEA is derived from an area of 32 km² within a single mining license, as illustrated in Figure 1.
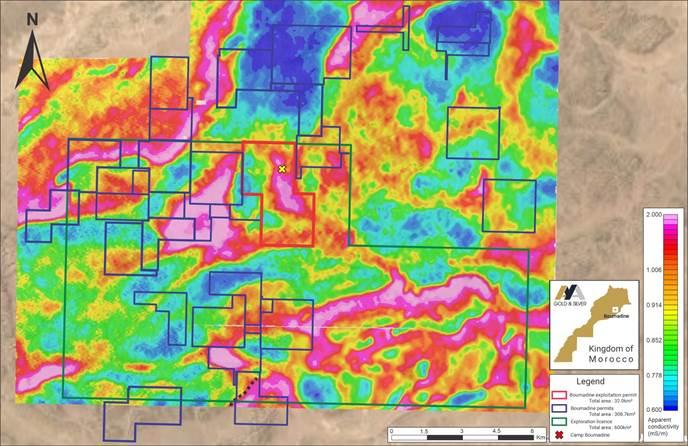
Figure 1: Map of Boumadine Mining Permits Overlaid with Apparent Conductivity at 175Hz
Mineral Resource Estimate
The MRE in the PEA is based on the “Technical Report and Updated Mineral Resource Estimate of the Boumadine Polymetallic Project, Kingdom Of Morocco”, published on March 31, 2025, which includes 142,268 m of drilling. Since then, Aya has completed approximately 130,000 m of drilling, which is not included in this MRE.
Table 4 : Boumadine MRE, as of February 24, 2025 (1-12)
| Cutoff | Tonnes | Average Grade | Contained Metal | |||||||||||||
| Ag | Au | Cu | Pb | Zn | AgEq | AuEq | Ag | Au | Cu | Pb | Zn | AgEq | AuEq | |||
| NSR US$/t | (kt) | (g/t) | (g/t) | (%) | (%) | (%) | (g/t) | (g/t) | (koz) | (koz) | (kt) | (kt) | (kt) | (koz) | (koz) | |
| Pit-constrained Indicated |
95 | 3,920 | 94 | 2.99 | 0.13 | 0.84 | 2.95 | 476 | 5.30 | 11,881 | 377 | 5 | 33 | 116 | 60,051 | 667 |
| Pit-constrained Inferred |
95 | 14,258 | 90 | 2.89 | 0.10 | 0.81 | 2.38 | 450 | 5.00 | 41,135 | 1,325 | 14 | 115 | 339 | 206,29 | 2,293 |
| Out-of-pit Indicated |
125 | 1,249 | 80 | 2.11 | 0.08 | 0.87 | 2.32 | 358 | 3.98 | 3,216 | 85 | 1 | 11 | 29 | 14,382 | 160 |
| Out-of-pit Inferred |
125 | 14,938 | 74 | 2.39 | 0.07 | 0.82 | 1.85 | 357 | 3.97 | 35,669 | 1,148 | 10 | 122 | 276 | 171,39 | 1,905 |
| Total Indicated |
95/ 125 |
5,169 | 91 | 2.78 | 0.12 | 0.85 | 2.80 | 448 | 4.98 | 15,097 | 462 | 6 | 44 | 145 | 74,433 | 827 |
| Total Inferred |
95/ 125 |
29,196 | 82 | 2.63 | 0.08 | 0.82 | 2.11 | 402 | 4.47 | 76,804 | 2,469 | 25 | 237 | 615 | 377,68 | 4,198 |
|
||||||||||||||||
Mining Operations
The PEA envisions a combined open pit and underground mining operation. The Boumadine LOM plan will consist of the simultaneous mining of several open pits in Central, North and South zones concurrent with underground operations that are scheduled between Year 2 and Year 11. The overall strategy is to achieve an average production rate to maintain a processing throughput of 8,000 tpd over the LOM.
The mine plan is shown in Figure 2 below.
Figure 2: 3D Plan of the open pit and UG stopes
The open pit mineral resource used in the LOM plan is contained within six (6) open pits (two in the south, three in the north, and one in the central area) over a strike length of 6 km and is mainly located above 350 m depth from surface. The open pit mining activity, including drill and blast, loading, and haulage is based on a contract-mining operation, with a mining capacity of 50 million tonnes of total material moved per year. Approximately 20 Mt of pre-stripping is expected during construction to ensure the ramp-up.
Underground mining will begin in year two of operations. Three distinct underground mines will be operated: the North, Central and South zones. The North and Central underground mines are independent from the open pits, with dedicated declines which will be developed from surface to access high-grade areas of the North and Central areas early in the LOM. The underground mining method will be longitudinal modified avoca long hole stoping. It is contemplated that all development will be executed by a mining contractor, while mineralized inventory mining activities will be carried out by Aya.
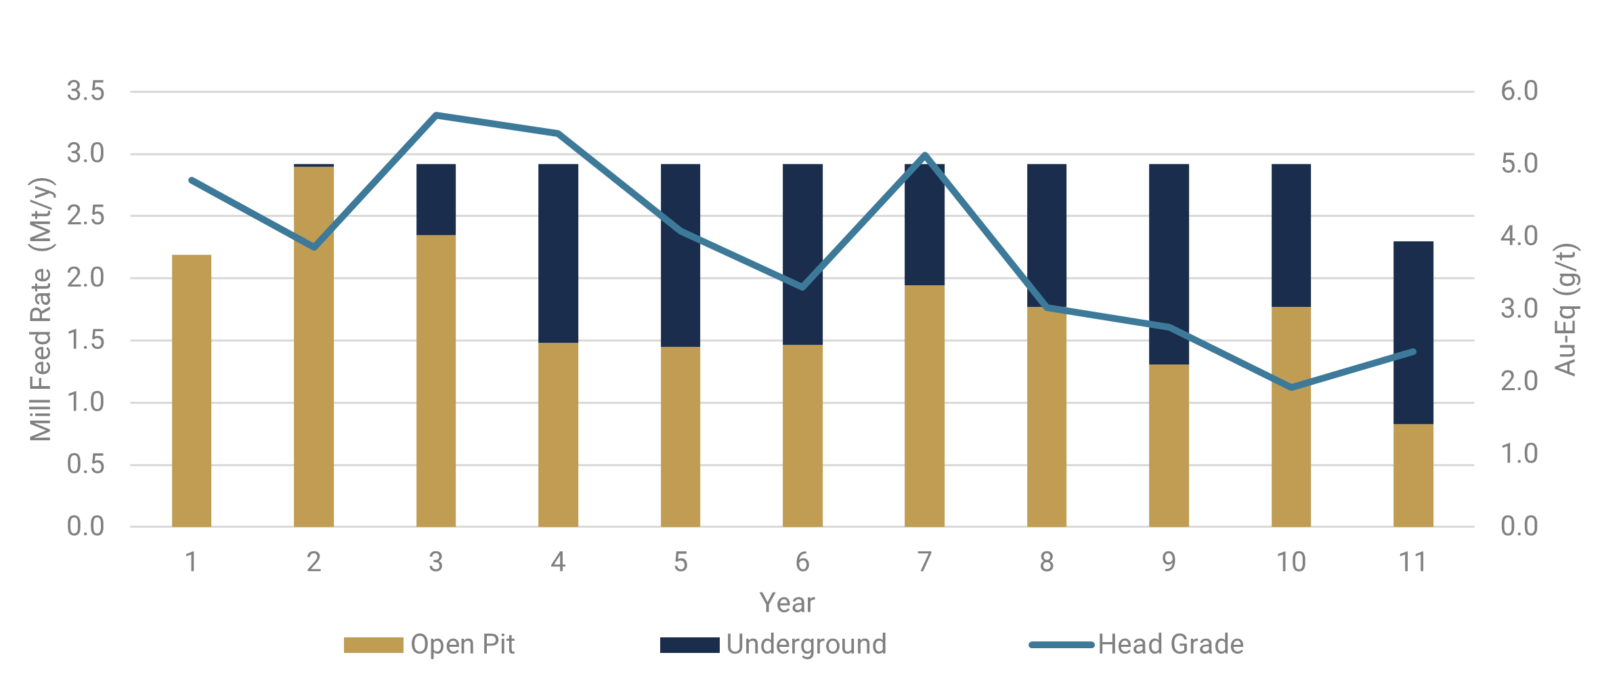
Figure 3: Boumadine Mill Feed by Mining Source
An average of 401 koz AuEq per year over the first 5 years of operations will be produced, with the majority of mineralized inventory coming from the open pits. Significant drilling has been completed since February 24, 2025, the effective date of the MRE, which is expected to contribute to resource upside to support higher levels of production towards the end of the expected mine life and to extend the overall LOM.
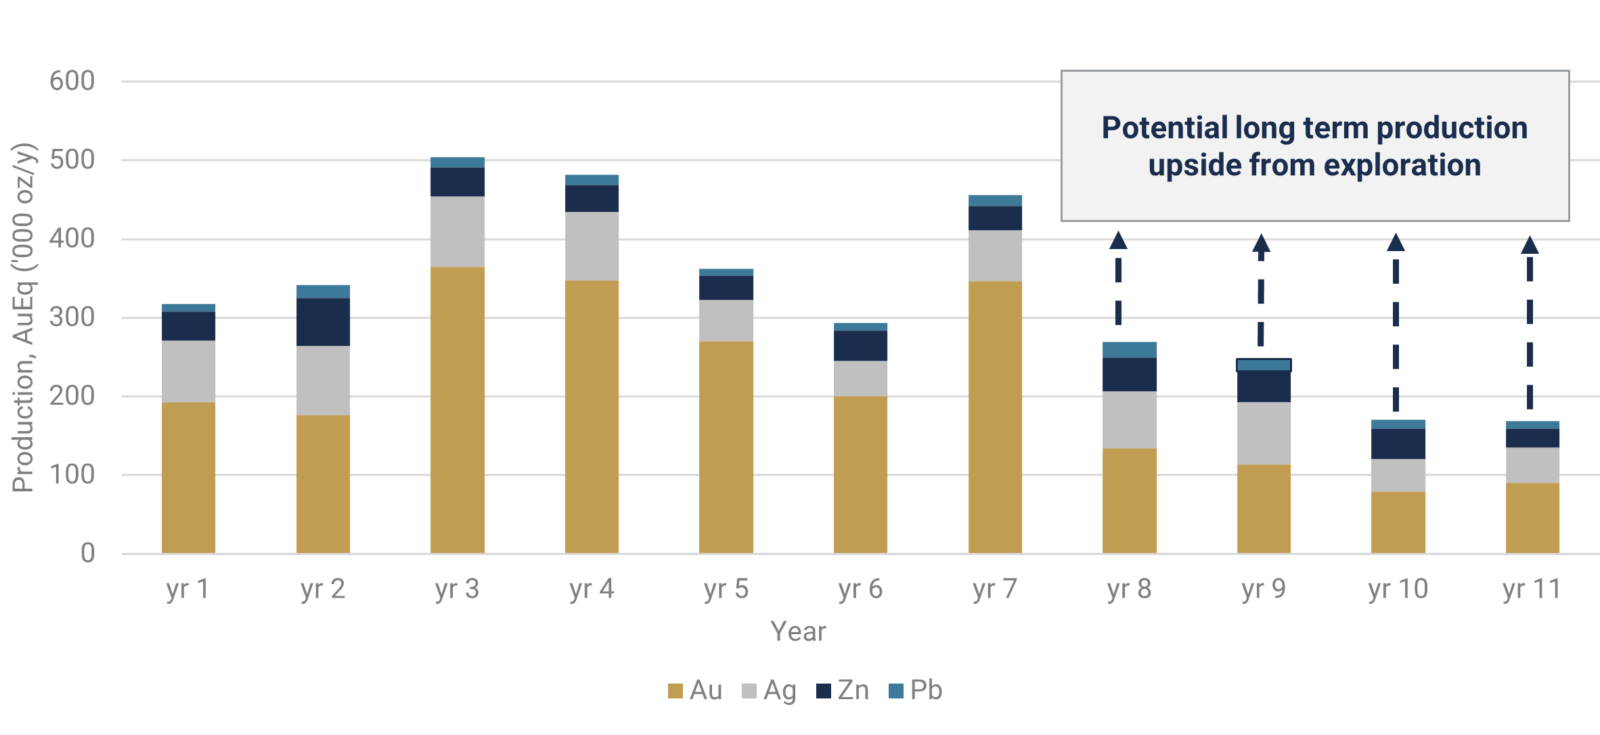
Figure 4: Boumadine Annual Production Profile
Processing
The flotation plant will process 8,000 tpd, for an annual throughput capacity of 2.9 Mt per year. The mine plan prioritizes strong feed grades to the mill during the initial years of production. During Years 1 to 5, high-grade material is processed, with an average grade of 4.76 g/t AuEq. From Year 8 onward, lower-grade, stockpiled material will be processed. Production during the first five years averages approximately 401koz AuEq annually.
A conventional flotation plant is planned for processing, with crushing, grinding and three flotations circuits to produce separate, saleable concentrates of zinc, lead, and pyrite. All three concentrates contain payable silver and gold. The comminution circuit consists of a primary jaw crusher, stockpile, and a semi-autogeneous mill and ball mill grinding circuit. The 6.1 MW SAG mill and 6.1 MW ball mill in closed circuit with hydrocyclones will produce a ground material with a P80 of 58 microns (µm).
Both the lead and zinc circuits consist of rougher flotation, classification, regrinding, and cleaner flotation to produce high value concentrates. The pyrite flotation circuit includes a rougher flotation circuit. All concentrates require thickening and filtration for transportation. The lead concentrate will be shipped in big bags while the zinc and pyrite concentrates will be shipped in bulk. Flotation tailings will be thickened and stored in a tailings storage facility.
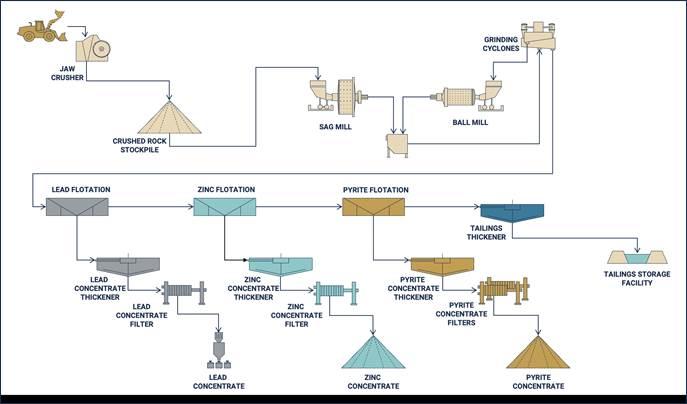
Figure 5: Simplified Processing Flowsheet
Figure 6: 3D rendering of proposed processing plant
Metallurgy
Extensive metallurgical testwork, led by SGS Lakefield between 2018 and 2025, is the foundation of the PEA and confirms a conventional flotation-based flowsheet with excellent metallurgical performance. The program included composite and variability samples, locked-cycle flotation tests, and comprehensive crushing and grinding studies, which validated the process efficiency and repeatability across mineralized domains. Total flotation recoveries are: 96.1% for gold, 96.4% for silver, 74.7% for zinc and 82.0% for lead.
Flotation demonstrates strong recoveries and concentrates quality, supporting a robust development scenario centered on concentrate sales. Complementary roaster and leaching testwork on the pyrite concentrate, conducted over several years, has also confirmed oxidation and precious metal recovery potential, suggesting a path for a roaster expansion in the future. Lab scale test results showed a total processing recovery (lead and zinc flotation, then pyrite flotation, roasting and leaching) up to 79% for gold and 85% for silver, with an average recovery of 63% for gold and 80% for silver.
The combination of high recoveries, conventional processing, and multiple commercialization pathways positions Boumadine as a technically sound and highly economic development project with significant long-term upside.
Tailings Management
The tailings storage facility is designed to accommodate approximately 18.5 Mt of flotation tailings generated over the LOM. The TSF is expected to be a valley-storage facility, utilizing the natural topography of the area and will be formed by a single earth-filled embankment, with a total footprint including the tailings deposition area of 70 ha. The TSF will be fully lined and contained with downstream phased construction, as per international standards, reiterating our commitment to the Global International Standards on Tailing Management.
The design contemplates a five-phase staged construction approach, with each phase expanding the facility every two years. This approach reduces initial capital requirements, optimizes sustaining capital expenditures over the LOM, and enhances operational flexibility and environmental performance. The design also considers water management strategies for both the operational and closure phases. Process water from the TSF will be reclaimed and recycled to the plant to minimize freshwater consumption. Ongoing technical studies and field investigations will inform future refinement the design.
Infrastructure
A comprehensive logistics assessment was conducted in collaboration with a Moroccan based logistics company specializing in bulk transportation. The logistics study evaluated multiple transportation alternatives, including road, and rail to Boumadine. The base case selected for the PEA involves contractor operated road haulage of concentrate on national roadways to the Port of Nador-West, approximately 640 km from Boumadine. Capital costs included in the PEA includes warehousing facilities for concentrate storage at the port.
In addition to the transport network, the Project will require the construction of a dedicated 72-km electrical power line and substation to provide reliable grid power. The cost associated with the electrical infrastructure was evaluated by the state-owned utility, ONEE, and is included in the overall capital cost estimate.
Water supply
Water will be sourced from nearby towns and water wells. Treated city wastewater from several treatment plants will be pumped to the mine to be used for mineral processing. Additionally, several water dams are present in the region and the possibility to add a pipeline to one of these dams as a secondary water source will be evaluated in the feasibility study.
Capital Expenditures
The project capital cost estimate was compiled by Lycopodium, with input from WSP for mining, Epoch for the TSF and local firms for water supply, logistics and power.
Initial capital expenditures are estimated at $446M, including a contingency of $96M. These costs are summarized in Table 5. The total construction period is estimated to be two years. Average annual sustaining capital over the LOM is estimated to be $30M, which includes underground mine development costs.
Table 5: Capital Expenditures
| Capital Expenditures ($M) | Initial | Sustaining | Total | ||
| Direct Costs | 288 | 340 | 628 | ||
| Open Pit Mining | 54 | 58 | 112 | ||
| Underground Mining | – | 250 | 250 | ||
| Processing Plant | 167 | – | 167 | ||
| Shipping Infrastructure | 11 | – | 11 | ||
| Electrical Line | 17 | – | 17 | ||
| Raw Water Supply | 30 | – | 30 | ||
| Tailings Storage Facility | 9 | 22 | 31 | ||
| TSF Closure Costs | – | 9 | 9 | ||
| Indirect Costs | 63 | – | 63 | ||
| Subtotal | 351 | 340 | 691 | ||
| Contingency | 96 | – | 96 | ||
| Total | 446 | 340 | 786 | ||
The Boumadine PEA capital cost estimate is based on a contractor mining model, reflecting the lower upfront capital requirements and added fleet flexibility needed to support the pre-production ramp-up. Similarly, the start of underground mining activities has been scheduled to follow the start-up of operations, deferring a portion of the capital expenditures and simplifying the start of the mining operations.
Operating Costs
The PEA outlines an average cash cost of $109/t milled, or $928/oz AuEq produced. The AISC is estimated at $1,021/oz AuEq produced, positioning the project competitively within the industry cost curve. Operating cost estimates in Table 6 have been developed from first principles and benchmarked against comparable projects with similar mining methods, processing flowsheets, and geographic location. Concentrate-related costs, including refining, transportation, penalties, and treatment charges, are fully incorporated into the financial model. A 3% royalty to the state-owned Office National des Hydrocarbures et des Mines is included and taxes have been applied in accordance with current legislation.
Table 6: Operating Cost Breakdown
| Operating Costs | Year 1-5 | LOM | ||
| Cost per Tonne Milled | ||||
| Mining | $/t milled | 48.93 | 42.83 | |
| Processing | $/t milled | 17.28 | 17.28 | |
| G&A | $/t milled | 5.43 | 5.58 | |
| Tailings, Environmental and Water Management | $/t milled | 0.46 | 0.48 | |
| Total On-site Operating Costs | $/t milled | 72.10 | 66.16 | |
| Product shipping | $/t milled | 38.70 | 35.56 | |
| Royalties | $/t milled | 8.52 | 6.75 | |
| Mining Tax | $/t milled | 0.36 | 0.32 | |
| Total Cash Cost | $/t milled | 119.68 | 108.78 | |
| OP Sustaining Capital | $/t milled | 3.06 | 1.87 | |
| UG Sustaining Capital | $/t milled | 7.95 | 8.06 | |
| TSF Sustaining Capital | $/t milled | 0.95 | 1.01 | |
| Total Costs including Sustaining | $/t milled | 131.65 | 119.72 | |
| Operating Cost per Ounce | ||||
| Total Cash Costs1 | $/oz AuEq | 827 | 928 | |
| Total AISC2 | $/oz AuEq | 910 | 1021 | |
|
||||
Concentrate Marketing
Aya has marketed and received three potential off-take agreements for the concentrates from Boumadine, providing preliminary terms for lead, zinc, and pyrite. The pyrite concentrate has generated strong attention due to its gold and silver grade and high sulfur content. Rising global demand for sulfuric acid—driven by fertilizer, chemical, and battery metals has tightened supply and improved pricing and offtake conditions for sulfur-rich feedstocks.
Table 7 highlights concentrate grades, and average payables per metal.
Table 7: Concentrate Grade, Recovery and Payables Summary
| Gold | Silver | Zinc | Lead | ||
| Grade | g/t | g/t | % | % | |
| Processed Grade | 2.43 | 73 | 1.91 | 0.70 | |
| Lead Concentrate | 29.9 | 1,892 | – | 29.6 | |
| Zinc Concentrate | 1.0 | 134 | 57.4 | – | |
| Pyrite Concentrate | 4.8 | 84 | – | – | |
| Recovery | % | % | % | % | |
| Lead Concentrate | 23.8 | 50.4 | – | 82 | |
| Zinc Concentrate | 1.0 | 4.6 | 74.7 | – | |
| Pyrite Concentrate | 71.4 | 41.4 | – | – | |
| Global Recovery | 96.1 | 96.4 | 74.7 | 82.0 | |
| Payable | 69% | 77% | 85% | 90% | |
Proposals received support the payables used in the PEA financial model, including gold and silver credits across all concentrates. Terms are comparable between offers and within current industry values. The average payable for all metals is 73% on an AuEq basis.
Economic Analysis
The PEA provides an after-tax NPV5% of $1.5 billion, an IRR of 47% and a payback period of 2.1 years from first production at base case consensus long-term gold price of $2,800/oz. The economic model also incorporates price assumptions of $30/oz silver, $1.20/lb zinc and $1.00/lb lead.
Table 8: Project Economics Summary
| Project Economics | Units | Base Case | ||
| Pre-tax | Post-tax | |||
| Gold Price | $/oz | 2,800 | 2,800 | |
| Silver price | $/oz | 30 | 30 | |
| Zinc | $/lb | 1.20 | 1.20 | |
| Lead Price | $/lb | 1.00 | 1.00 | |
| NPV5% | $B | 2.2 | 1.5 | |
| IRR | % | 69% | 47% | |
| Payback | Years | 1.3 | 2.1 | |
| NPV: Capex | – | 5.0 | 3.3 | |
| Revenue LOM | $B | 7.0 | – | |
| EBITDA LOM | $B | 3.4 | – | |
| Cumulative FCF LOM | $B | 2.8 | 2.0 | |
| Avg. Annual Revenue | $M/y | 629 | – | |
| Avg. Annual EBITDA | $M/y | 308 | – | |
| Avg. Annual FCF | $M/y | 254 | 176 | |
|
||||
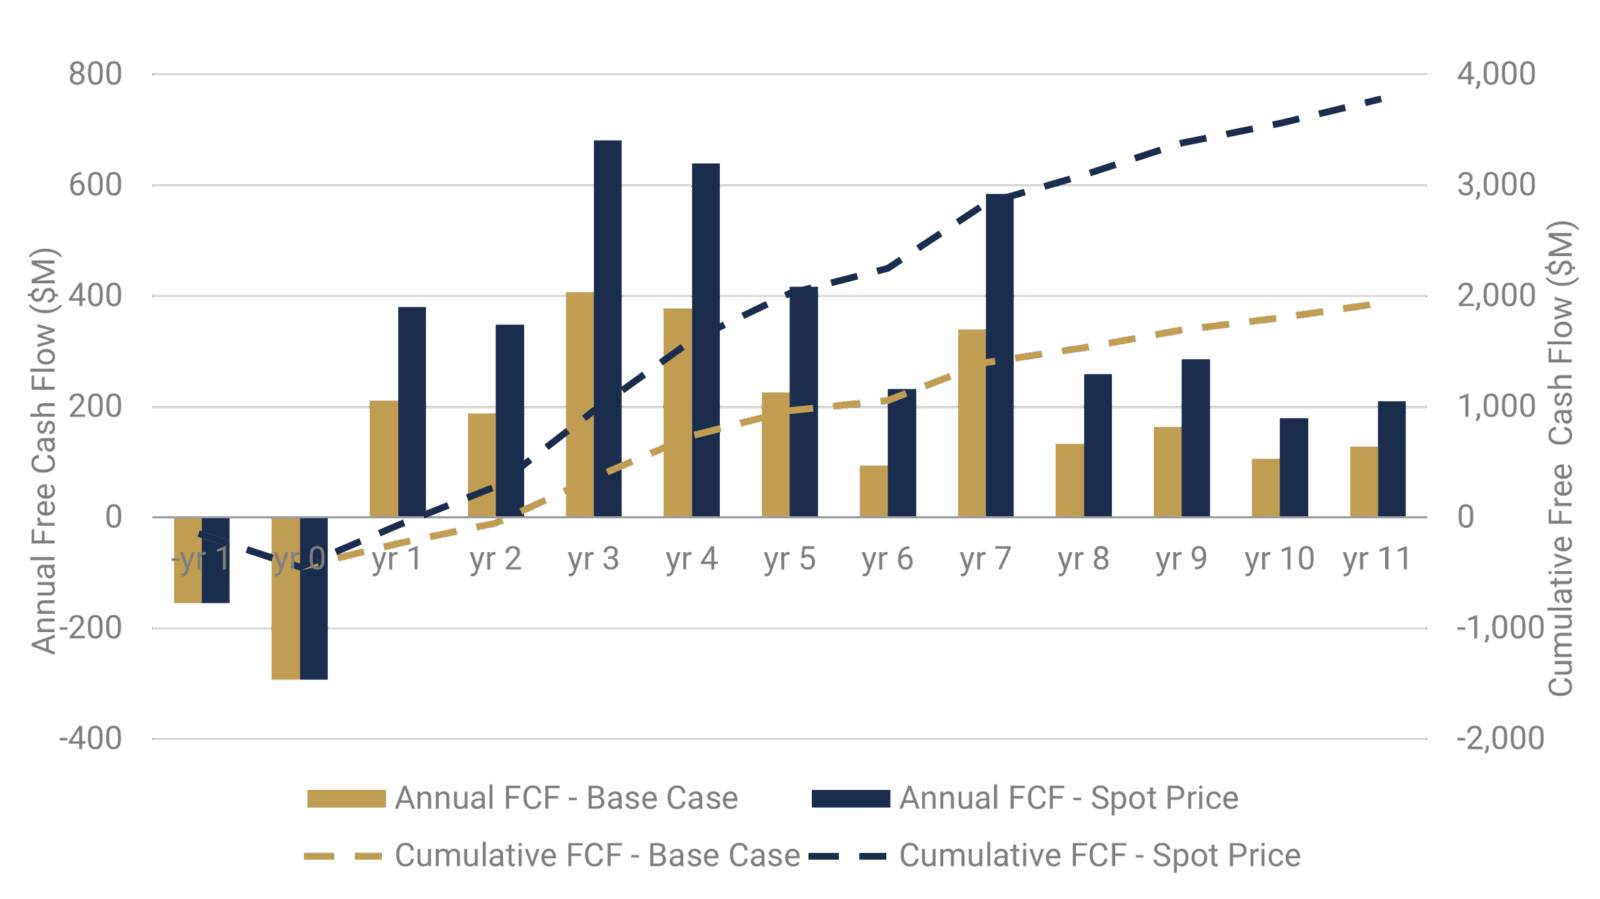
Figure 7: Annual Free Cash Flow over the LOM
Sensitivity Analysis
Table 9 presents the sensitivity of after-tax IRR and NPV5%, with varying gold and silver prices. It should be noted that sensitivities apply to the financial model only; pit selection, cut-off grade and processing schedules are based on a $2,200/oz gold price and would likely be redesigned.
Table 9: Sensitivity Analysis to Commodity Prices of Gold and Silver
| Parameter | Units | Downside | Base Case | Spot Prices1 | Upside1 | Upside1 | |
| Commodity Price Sensitivity | |||||||
| Gold Price | $/oz | 2,000 | 2,800 | 4,000 | 7,000 | 17,250 | |
| Silver Price | $/oz | 20 | 30 | 48 | 80 | 200 | |
| NPV5% Pre-Tax | $M | 803 | 2,224 | 4,479 | 9,581 | 27,451 | |
| NPV5% Post-Tax | $M | 490 | 1,475 | 2,963 | 6,330 | 18,123 | |
| IRR Pre-Tax | % | 36% | 69% | 107% | 174% | 337% | |
| IRR Post-Tax | % | 22% | 47% | 77% | 128% | 256% | |
| LOM Revenue | $M | 5,162 | 6,991 | 9,896 | 16,464 | 39,473 | |
| LOM EBITDA | $M | 1,693 | 3,418 | 6,156 | 12,346 | 34,032 | |
| FCF-Unlevered (Pre-Tax) | $M | 1,049 | 2,824 | 5,642 | 12,012 | 34,331 | |
| FCF-Unlevered (Post-Tax) | $M | 714 | 1,958 | 3,818 | 8,022 | 22,751 | |
| Payback Period (Pre-Tax) | Years | 2.3 | 1.3 | 0.7 | 0.4 | 0.1 | |
| Payback Period (Post-Tax) | Years | 3.1 | 2.1 | 1.2 | 0.6 | 0.2 | |
| NPV5%:CAPEX (Post-Tax) | – | 1.1 | 3.3 | 6.6 | 14.2 | 40.6 | |
| 1. Assumed Spot Prices as of 31/10/2025. Upside gold price assumptions referenced from Michael Oliver (October 2025) and Pierre Lassonde, Wealthion podcast, October 2, 2025 — $7,000/oz and $17,250/oz, respectively. | |||||||
Exploration Potential at Boumadine
Significant potential exists to expand mineralization beyond the limits of the current PEA study. The Boumadine Main Trend (5.4 km), Tizi Zone (2.0 km), and Imariren Zone (1.2 km) remain open in all directions, highlighting strong opportunities for resource growth. Follow-up drilling is also planned at the newly discovered 8 km Asirem trend, underscoring the broader scale of the mineralized system. A 140,000-metre drilling program is underway, with roughly half focused on extending and infilling the known trends and the remainder directed toward greenfield exploration. This program is designed to expand the mineralized footprint beyond the PEA boundaries and to define additional zones that could support future development phases.
Next Steps
Upon completion of the PEA, the following actions are required to successfully advance the project:
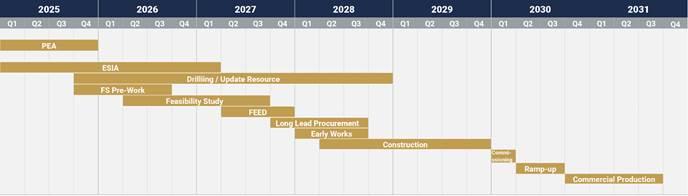
Figure 8: Preliminary Schedule for Boumadine Project Development from PEA to Commercial Production
Conference Call Details
Aya will host a live webinar today to discuss the results with analysts, shareholders, and investors at 10:00 a.m. ET, which will be followed by a live Q&A session.
Participants may join the event via webcast at the following link: https://www.icastpro.ca/t9bhpo.
Aya encourages all participants to register in advance.
A replay will be available following the webinar through the same link or in the “Events” section of the Corporation’s website at www.ayagoldsilver.com.
Qualified Persons
The scientific and technical information contained in this press release has been reviewed for accuracy, compliance with National Instrument 43-101, and approved by Preetham Nayak P.Eng, Senior Study Manager for Lycopodium Minerals Canada Ltd, Benjamin Berson, P.Eng, Lead Mining Engineer for WSP and Eugene Puritch, P.Eng, FEC, CET from P&E Consultants Inc, Raphael Beaudoin, P. Eng, Vice-President, Operations, and by David Lalonde, B. Sc, P. Geo, Vice-President Exploration, each a Qualified Person as defined in NI 43-101, for accuracy and compliance with National Instrument 43-101.
The independent Qualified Persons for the PEA, as defined by NI 43-101, are
Technical Report
The complete NI 43-101 Technical Report pertaining to the PEA will be filed within 45 days and will be available on Aya’s website and on SEDAR+ (www.sedarplus.ca).
The PEA is preliminary in nature, and it includes inferred Mineral Resources that are considered too speculative geologically to have the economic considerations applied to them that would enable them to be categorized as mineral reserves, and, as such, there is no certainty that the PEA results will be realized.
About Aya Gold & Silver Inc.
Aya Gold & Silver Inc. is a rapidly growing, Canada-based silver producer with operations in the Kingdom of Morocco.
The only TSX-listed pure silver mining company, Aya operates the high-grade Zgounder Silver Mine and is exploring its properties along the prospective Anti-Atlas Fault, several of which have hosted past-producing mines and historical resources.
Aya’s management team has been focused on maximizing shareholder value by anchoring sustainability at the heart of its operations, governance, and financial growth plans.
For additional information, please visit Aya’s website at www.ayagoldsilver.com.
Or contact
| Benoit La Salle, FCPA, MBA President & CEO Benoit.lasalle@ayagoldsilver.com |
Alex Ball VP, Corporate Development & IR alex.ball@ayagoldsilver.com |
Hudbay Minerals Inc. (TSX:HBM) (NYSE: HBM) today released its ann... READ MORE
Strategic acquisition of an established operating gold mine, loca... READ MORE
Cerro de Pasco Resources Inc. (TSX-V: CDPR) (OTCQB: GPPRF) (FRA: ... READ MORE
The Garneau Titanium Project Features Ilmenite-Rich Boulder with ... READ MORE
ValOre Metals Corp. (TSX‐V: VO) (OTCQB: KVLQF) (Frankfurt: KEQ0... READ MORE


