


Aura Minerals Inc. (NASDAQ: AUGO) (TSX: ORA) (B3: AURA33) announces that it has filed its audited consolidated financial statements and management discussion and analysis for the period ended June 30, 2025. The full version of the Financial and Operational Results can be viewed on the Company’s website at www.auraminerals.com, on SEDAR+ at www.sedarplus.ca. or on SEC www.sec.gov.
“In Q2, we achieved another record-high Adjusted EBITDA of US$106 million, driven by higher production and gold price of US$3,185 / Oz, bringing our last twelve months (LTM) Adjusted EBITDA to US$344 million at an average gold price of US$2,812 / Oz. Additionally, Aura reached significant milestones, including the publication of the Preliminary Economic Assessment (PEA) for Era Dorada, the signing of a purchase agreement for MSG, and a successful IPO on Nasdaq. We also approved our quarterly dividend payment, delivering a 7.4% yield return to our shareholders over the LTM, inclusive of share buybacks. Looking ahead, we expect commercial production at Borborema, the completion of the MSG acquisition in Q3, and to meet our production and cost guidance for the year.” Commented Rodrigo Barbosa President and CEO of Aura.
Operational & Financial Headlines Q2 2025 and H1 2025
| (US$ thousand) | Q2 2025 | Q1 2025 | % | Q2 2024 | % | H1 2025 | H1 2024 | % | ||||||||
| Total Production (GEO) | 64,033 | 60,087 | 7 | % | 64,327 | -0 | % | 124,120 | 132,514 | -6 | % | |||||
| Total Sales (GEO) | 62,452 | 60,491 | 3 | % | 63,258 | -1 | % | 122,943 | 132,344 | -7 | % | |||||
| Net Revenue | 190,436 | 161,804 | 18 | % | 134,411 | 42 | % | 352,240 | 266,489 | 32 | % | |||||
| Gross Profit | 103,939 | 78,428 | 33 | % | 51,308 | 103 | % | 182,367 | 97,989 | 86 | % | |||||
| Gross Margin | 55 | % | 48 | % | 6 p.p. | 38 | % | 16 p.p. | 52 | % | 37 | % | 15 p.p. | |||
| EBITDA | 106,224 | 81,479 | 30 | % | 53,208 | 100 | % | 187,703 | 109,398 | 72 | % | |||||
| EBITDA Margin | 56 | % | 50 | % | 542 p.p. | 40 | % | 1619 p.p. | 53 | % | 41 | % | 1224 p.p. | |||
| Net Income | 8,147 | (73,249 | ) | n.a. | (25,775 | ) | -132 | % | (65,102 | ) | (34,992 | ) | n.a. | |||
| Net Income Margin | 4 | % | -45 | % | n.a. | -19 | % | -122 | % | -18 | % | -13 | % | n.a. | ||
| Adjusted Net Income¹ | 36,834 | 26,903 | 37 | % | 9,414 | 291 | % | 63,737 | 22,980 | 177 | % | |||||
| Adjusted Net Income Margin | 19 | % | 17 | % | 3 p.p. | 7 | % | 176 | % | 18 | % | 9 | % | 9 p.p. | ||
| Cash Cost (US$/GEO) | 1,146 | 1,149 | -0 | % | 1,080 | 6 | % | – | 1,040 | -100 | % | |||||
| All In Sustaining cost (US$/GEO) | 1,449 | 1,461 | -1 | % | 1,328 | 9 | % | 1,455 | 1,307 | 11 | % | |||||
| Operating Cash Flow | 60,420 | 41,229 | 47 | % | 53,612 | 13 | % | 83,867 | 79,464 | 6 | % | |||||
| Net Debt/LTM EBITDA | 0.8x | 0.9x | -0.1x | 0.8x | 0.0x | 0.8x | 0.8x | 0.0x | ||||||||
| CAPEX | 50,327 | 51,725 | -3 | % | 23,575 | 113 | % | 102,052 | 53,278 | 92 | % | |||||
| 1. Adjusted Net Income of Q1 2025 does not consider deffered taxes over non-monetary items. | ||||||||||||||||
Except as otherwise noted in this document, references herein to “US$” or and “$” are to thousands of United States dollars
Headlines
OTHER UPDATES:
U.S. Public Offering: In July 2025, Aura concluded its U.S. Initial Public Offering (“IPO”) of 8,100,510 common shares, at a public offering price of US$24.25 per common share. Aura raised around US$196 million. The common shares were listed on the Nasdaq Global Select Market under the ticker symbol “AUGO” and began trading on July 16, 2025. The U.S. listing is part of Aura’s strategy to unlock value for our shareholders, improve liquidity of its common shares, as well as strengthen and diversify its shareholder base through broader access to global capital markets.
Borborema Ramp-Up and First once sold: Borborema Project (“Borborema”) started its ramp-up phase on schedule and on budget, with the mine and plant currently in operation, and it produced in Q2 2025 totaled 2,577 GEO following the project’s first gold pour. Borborema is poised to become a cornerstone asset for Aura, anticipated to deliver the second highest annual gold production among the Company’s five operating mines. Built in just 19 months with zero lost time incidents, the project exemplifies Aura’s commitment to developing simple, scalable, and efficient operations. It also sets a benchmark in ESG performance, incorporating renewable energy sources and utilizing grey water from the local municipality. Aura believes that Borborema remains on track to declare commercial production by the end of Q3 2025.
Acquisition of MSG (Mineração Serra Grande Gold) Mine in Goiás, Brazil: In June 2025, Aura announced the acquisition from AngloGold all of the issued and outstanding securities of Mineração Serra Grande S.A. (“MSG”), owner of the MSG gold mine located in Crixás, in the state of Goiás, Brazil. In consideration for the acquisition of MSG, Aura will pay to AngloGold: (i) an upfront cash consideration of US$ 76 million on closing subject to certain working capital adjustments as at the closing date; plus (ii) deferred consideration payments equivalent to a 3% net smelter returns participation over the currently identified Mineral Resource of MSG (inclusive of the Mineral Reserve) payable quarterly. The Transaction excludes certain current subsidiaries of MSG, which hold assets that do not form part of MSG’s mining operations or Mineral Resources and Mineral Reserves. These subsidiaries will be spun off from MSG prior to the closing of the Transaction. The closing of the Transaction is expected to happen by Q3 2025, and no later than Q4 2025.
Preliminary Economic Assessment for the Era Dorada Project: In June 2025, Aura filed a Preliminary Economic Assessment for the Company’s wholly owned Era Dorada Project, in the United States in accordance with S-K 1300 and NI 43.101. The PEA indicated Mineral Resources of 1.9 million ounces of gold, assuming 6.35 million tonnes at 9.31 grams per tonne. The total production of approximately 1.4 million ounces of gold over a 17 years Life of Mine, and with average production of 91k ounces of gold for the first 4 years. Regarding CAPEX, the PEA presented a total initial implementation capex of approximately US$264 million with a payback in approximately 3.5 years after the beginning of the operation.
Exercise of Options to Acquire 100% of the Pé Quente and Carajás Projects
Aura has exercised its options to acquire 100% ownership of the Pé Quente and Carajás Projects in Brazil, as previously announced in press releases dated February 27, 2023 and May 22, 2024. These transactions reinforce Aura’s commitment to growing its resource base and exploration and development pipeline across key jurisdictions in the Americas.
Investment in Altamira Gold Corp. through a Private Placement: In July 2025, Aura entered into a subscription agreement with Altamira Gold Corp., acquiring 6,000,000 units at C$0.10 per unit in a non-brokered private placement, totaling C$600,000. Each unit comprises one common share and one-half of a share purchase warrant, exercisable at C$0.15 per share until June 30, 2027. Prior to this, Aura held 24,000,000 shares and 24,000,000 warrants (11.3% non-diluted, 20.3% fully diluted, as per November 2023). Post-transaction, Aura holds 30,000,000 shares and 27,000,000 warrants (11.3% non-diluted, 19.5% fully diluted). The units were acquired directly from Altamira for investment purposes due to its exploration potential.
2.1 Total Production and Sales (GEO)
| English | ||||||||||||||||
| (GEO) | Q2 2025 | Q1 2025 | % | Q2 2024 | % | H1 2025 | H1 2024 | % | ||||||||
| Production | 64,033 | 60,087 | 7 | % | 64,327 | -0 | % | 124,120 | 132,514 | -6 | % | |||||
| Aranzazu | 22,281 | 20,456 | 9 | % | 24,692 | -10 | % | 42,737 | 49,693 | -14 | % | |||||
| Apoena | 8,219 | 8,876 | -7 | % | 9,912 | -17 | % | 17,095 | 22,017 | -22 | % | |||||
| Minosa | 18,039 | 17,654 | 2 | % | 19,142 | -6 | % | 35,693 | 38,328 | -7 | % | |||||
| Almas | 12,917 | 13,101 | -1 | % | 10,580 | 22 | % | 26,018 | 22,475 | 16 | % | |||||
| Borborema | 2,577 | 0 | n.a. | 0 | % | n.a. | 257700 | % | 0 | % | n.a. | |||||
| (GEO) | Q2 2025 | Q1 2025 | % | Q2 2024 | % | H1 2025 | H1 2024 | % | ||||||||
| Sales | 62,452 | 60,491 | 3 | % | 63,258 | -1 | % | 122,943 | 132,344 | -7 | % | |||||
| Aranzazu | 22,290 | 20,456 | 9 | % | 24,683 | -10 | % | 42,746 | 49,786 | -14 | % | |||||
| Apoena | 8,219 | 9,408 | -13 | % | 8,258 | -0 | % | 17,627 | 21,118 | -17 | % | |||||
| Minosa | 17,836 | 17,526 | 2 | % | 19,738 | -10 | % | 35,362 | 38,966 | -9 | % | |||||
| Almas | 12,917 | 13,101 | -1 | % | 10,580 | 22 | % | 26,018 | 22,475 | 16 | % | |||||
| Borborema | 1,190 | 0 | n.a. | 0 | n.a. | 1,190 | 0 | n.a. | ||||||||
Applies the metal sale prices in Aranzazu realized during Q2 2025: Copper price = US$4.39/lb; Gold Price = US$3,293/oz; Silver Price = US$34.27/oz.
Total production in Q2 2025 reached 64,033 gold equivalent ounces (“GEO”), 7% higher than Q1 2025 and in line compared to the same period last year at current metal prices, mainly due to negative impact from the copper-to-GEO conversion at Aranzazu. At constant metal prices, production increased by 9% when compared to both Q1 2025 and Q2 2024. The result was mainly attributable to stronger operational performance at Aranzazu, which posted higher metallurgical recoveries and improved head grades for all metals, on both an annual and quarterly basis
During the quarter, Aura commenced operations at Borborema — anticipated to be one of the Company’s largest and lowest cash cost operations. In the quarter, Borborema’s preliminary production totaled 2,577 GEO, following the project’s first gold pour. The project was completed on schedule, within 19 months, and on budget and Aura expects to achieve to declare Borborema commercial production by the end of Q3 2025.
In the first half of 2025, production reached 124,120 GEO, representing a 6% decline at current metal prices. At constant prices — which neutralize the effect of copper price fluctuations in the GEO conversion at Aranzazu — this reflects an increase over the 122,259 GEO produced in H1 2024. . At current metal prices, production in Q2 2025 was consistent with Q2 2024, and year-to-date production represents 47% of the lower end and 41% of the upper end of the full-year guidance. This performance reinforces the Company’s confidence in meeting its 2025 targets, especially considering that Borborema is still in the ramp-up phase. Excluding Borborema, total production to date accounts for 52% of the lower bound and 47% of the upper bound of the guidance range.
2.2. Net Revenue
| (US$ thousand) | Q2 2025 | Q1 2025 | % | Q2 2024 | % | H1 2025 | H1 2024 | % | |||
| Aranzazu | 62,508 | 50,262 | 24 | % | 49,240 | 27 | % | 112,770 | 93,402 | 21 | % |
| Apoena | 26,711 | 26,353 | 1 | % | 18,992 | 41 | % | 53,064 | 44,999 | 18 | % |
| Minosa | 55,776 | 48,062 | 16 | % | 41,962 | 33 | % | 103,838 | 79,609 | 30 | % |
| Almas | 41,751 | 37,127 | 12 | % | 24,217 | 72 | % | 78,878 | 48,479 | 63 | % |
| Borborema | 3,690 | – | n.a | – | n.a | 3,690 | – | n.a. | |||
| Total | 190,436 | 161,804 | 18 | % | 134,411 | 42 | % | 352,240 | 266,489 | 32 | % |
In Q2 2025, the Company reported Net Revenue of US$190.4 million, representing a 42% increase year-over-year and an 18% increase compared to Q1 2025. The strong performance was primarily driven by the higher metal prices, particularly gold, with the average realized gold price increasing by 44%, from US$2,208/oz in Q2 2024 to US$3,185/oz in Q2 2025. Copper prices also contributed positively, with the average realized copper price increasing by 5%, from US$4.26/lb in Q2 2024 to US$4.46/lb in Q2 2025.
With this result, Net Revenues reached US$352,240 in H1 2025, an increase of 32% when compared to the same period of 2024. The result was mainly driven by higher gold prices, higher sales at Almas and the start of the Borborema Project. In H1 2025, average net realized prices reached US$2,986, a 42% increase when compared to H2 2024; and average copper prices reached US$4.36/lb, a 5% increase when compared to H2 2024.
2.3. Cash Cost and All in Sustaining Costs
| (US$/GEO) | Q2 2025 | Q1 2025 | % | Q2 2024 | % | H1 2025 | H1 2024 | % | ||||||||
| Cash Cost | 1,146 | 1,149 | -0 | % | 1,080 | 6 | % | 1,147 | 1,040 | 10 | % | |||||
| Aranzazu | 1,110 | 1,164 | -5 | % | 958 | 16 | % | 1,136 | 942 | 21 | % | |||||
| Apoena | 1,168 | 1,228 | -5 | % | 1,252 | -7 | % | 1,200 | 940 | 28 | % | |||||
| Minosa | 1,178 | 1,149 | 3 | % | 1,094 | 8 | % | 1,164 | 1,140 | 2 | % | |||||
| Almas | 1,167 | 1,069 | 9 | % | 1,203 | -3 | % | 1,118 | 1,176 | -5 | % | |||||
| Borborema | 936 | 0 | n.a. | 0 | n.a. | 936 | – | n.a. | ||||||||
| All-in Sustaining Cost | 1,449 | 1,461 | -1 | % | 1,328 | 9 | % | 1,455 | 1,307 | 11 | % | |||||
| Aranzazu | 1,514 | 1,545 | -2 | % | 1,206 | 26 | % | 1,529 | 1,235 | 24 | % | |||||
| Apoena | 1,751 | 2,041 | -14 | % | 1,958 | -11 | % | 1,906 | 1,500 | 27 | % | |||||
| Minosa | 1,292 | 1,249 | 3 | % | 1,159 | 12 | % | 1,271 | 1,223 | 4 | % | |||||
| Almas | 1,364 | 1,195 | 14 | % | 1,434 | -5 | % | 1,279 | 1,428 | -10 | % | |||||
| Borborema | 1,441 | 0 | n.a. | 0 | n.a. | 1,441 | – | n.a. | ||||||||
For the second quarter of 2025, the Company’s Cash Cost was US$1,146/GEO, an increase of 6% over Q2 2024 and in line with Q1 2025, even with the preliminary production of Borborema. Year-on-year, the increase in cash cost was mainly attributed to the increase in costs at Aranzazu, mainly due to impact from the copper-to-GEO conversion in production. At constant Q2 2024 metal prices, Cash Costs decreased by 4%. Quarter-over-quarter, cost improvements at Aranzazu and Apoena were sufficient to offset higher costs at Almas, which faced a decrease in grades as anticipated in the mine sequencing plan.
In H1 2025, Cash Cost averaged US$1,147/oz, representing a 10% increase compared to the same period in 2024, the increase was primarily driven by the impact of the copper-to-GEO conversion at Aranzazu and lower production at Apoena, as expected. At constant H1 2024 metal prices, Cash Costs increased by 2%
The consolidated All-in Sustaining Cost (AISC) was US$1,449 per GEO, representing a 9% increase compared to Q2 2024 and a 1% decrease versus Q1 2025, in line with the cash cost trend. When calculated using constant metal prices from Q2 2024, AISC for the quarter would have been US$1,312 per GEO, a decrease of 1%. In H1 2025, AISC was US$1,455, a 11% increase compared to H1 2024. At constant H1 2024 metal prices, AISC increased by 3%.
2.4. Gross Income
| (US$ thousand) | Q2 2025 | Q1 2025 | % | Q2 2024 | % | H1 2025 | H1 2024 | % | ||||||||
| Net Revenue | 190,436 | 161,804 | 18 | % | 134,411 | 42 | % | 352,240 | 266,489 | 32 | % | |||||
| Cost of goods sold | (86,497 | ) | (83,376 | ) | 4 | % | (83,103 | ) | 4 | % | (169,873 | ) | (168,500 | ) | 1 | % |
| Cost of production | (44,470 | ) | (44,919 | ) | -1 | % | (36,203 | ) | 23 | % | (89,389 | ) | (75,062 | ) | 19 | % |
| Cost of production – Contractors | (17,529 | ) | (15,467 | ) | 13 | % | (22,356 | ) | -22 | % | (32,996 | ) | (42,380 | ) | -22 | % |
| Change in inventory (cash) | (9,550 | ) | (9,126 | ) | 5 | % | (9,762 | ) | -2 | % | (18,676 | ) | (20,167 | ) | -7 | % |
| Depreciation and amortization | (14,948 | ) | (13,864 | ) | 8 | % | (14,782 | ) | 1 | % | (28,812 | ) | (30,891 | ) | -7 | % |
| Gross Profit | 103,939 | 78,428 | 33 | % | 51,308 | 103 | % | 182,368 | 97,989 | 86 | % | |||||
| Gross Margin | 55 | % | 48 | % | 6 p.p. | 38 | % | 1641 p.p. | 52 | % | 37 | % | 15 p.p. | |||
The increase in Net Revenue coupled with the Company’s rigorous cost control – with an increase of 4% on Cost of goods sold compared to the same quarter of 2024 – led to a Gross Profit at the quarter of US$130.9 million in Q2 2025, with a Gross Margin of 55%, compared to the Gross Profit of US$51.3 million in Q2 2024 and US$78.4 million in Q1 2025.
In H1 2025, Gross Profit reached US$182.4 million, higher than US$98.0 million in H1 2024, also explained by 32% increase in net revenue and only 1% at costs of goods sold.
2.5.Operating Expenses
| (US$ thousand) | Q2 2025 | Q1 2025 | % | Q2 2024 | % | H1 2025 | H1 2024 | % | ||||||||
| Gross Profit | 103,939 | 78,428 | 33 | % | 51,308 | 103 | % | 182,367 | 97,989 | 86 | % | |||||
| Operational Expenses | (12,998 | ) | (11,012 | ) | 18 | % | (10,482 | ) | 24 | % | (24,010 | ) | (20,703 | ) | 16 | % |
| General and administrative expenses | (11,284 | ) | (9,636 | ) | 17 | % | (7,156 | ) | 58 | % | (20,920 | ) | (15,014 | ) | 39 | % |
| Care-and-maintenance expenses | – | – | n.a. | (375 | ) | n.a. | – | (796 | ) | n.a. | ||||||
| Exploration expenses | (1,714 | ) | (1,376 | ) | 25 | % | (2,951 | ) | -42 | % | (3,090 | ) | (4,893 | ) | -37 | % |
| Operating income | 90,941 | 67,416 | 35 | % | 40,826 | 123 | % | 158,357 | 77,286 | 105 | % | |||||
Operating Expenses totaled US$13.0 million in the quarter, 18% higher than Q1 2025 and 24% higher than Q2 2024. The result for the quarter was mainly impacted by higher General & Administrative (G&A) expenses, driven by increased professional and consulting fees, as well as audit cost adjustments primarily related to the Company’s U.S. listing. In H1 2025, there was a 16% increase in Operational Expenses due to a 39% increase in G&A, partially offset by a 37% reduction in Exploration Expenses.
Exploration expenses totaled US$1.7 million in Q2 2025, a 25% increase compared to Q1 2025 and 42% reduction from Q2 2024. Exploration activities in the quarter were concentrated in Almas and Minosa. In Matupá, efforts were focused on expanding reserves in regions close to X1, Pé Quente and other strategic areas. In Carajás, exploration work successfully confirmed copper mineralization, significantly expanding the mineral potential of the region. In H1 2025, the reduction of the Q2 2025 partially compensated the higher expenses in Q1 2025, closing the semester with a 37% reduction, in line with the Company’s plan and due to the capitalization of exploration expenses in certain targets.
The Company thus ended Q2 2025 with Operating Income of US$90.9 million, compared to an Operating Income of US$40.8 million in Q2 2024, also higher compared to the Operating Income of Q1 2025 of US$67.4 million, which reflects a positive result of higher gross profit.
2.6. Adjusted EBITDA
| (US$ thousand) | Q2 2025 | Q1 2025 | % | Q2 2024 | % | H1 2025 | H1 2024 | % | ||||||||
| Operating Income | 90,941 | 67,416 | 35 | % | 40,826 | 123 | % | 158,357 | 77,286 | 105 | % | |||||
| Depreciation and Amortization | 15,283 | 14,063 | 9 | % | 15,346 | -0 | % | 29,346 | 31,553 | -7 | % | |||||
| Adjusted EBITDA | 106,224 | 81,479 | 30 | % | 56,172 | 89 | % | 187,703 | 109,398 | 72 | % | |||||
| Adjusted EBITDA Margin | 56 | % | 50 | % | 5 p.p. | 42 | % | 14 p.p. | 53 | % | 41 | % | 12 p.p. | |||
Adjusted EBITDA reached a new all-time high of US$106.2 million in Q2 2025, marking the fourth consecutive quarterly record for Aura. The Company’s ongoing commitment to improving asset productivity and maintaining disciplined cost control enabled it to fully capture the benefit of rising metal prices. As a result, Adjusted EBITDA doubled compared to Q2 2024 and grew 30% over Q1 2025.
The year-over-year improvement was primarily driven by strong cost control – only 4% increase – and higher gold and copper prices. This result was also noted on the EBITDA margin gain of 14 p.p. Compared to Q1 2025, the increase in Adjusted EBITDA was supported not only by stronger metal prices and also by a 3% increase in sales volume.
In H1 2025, the Company maintained stable Cost of Goods Sold compared to H1 2024. Combined with the positive impact of higher metal prices, this led to an Adjusted EBITDA of US$187.7 million, a 72% increase over the same period last year. As a result, the Adjusted EBITDA margin expanded to 53%, up from 41% in H1 2024.
2.7. Financial Result
| (US$ thousand) | Q2 2025 | Q1 2025 | % | Q2 2024 | % | H1 2025 | H1 2024 | % | ||||||||
| EBIT | 90,941 | 67,416 | 34.9 | % | 40,826 | 123 | % | 158,357 | 77,286 | 105 | % | |||||
| Financial Result | (59,630 | ) | (121,611 | ) | -51.0 | % | (45,102 | ) | 32 | % | (181,241 | ) | (79,197 | ) | 129 | % |
| Accretion expense | (1,134 | ) | (1,666 | ) | -31.9 | % | (1,573 | ) | -28 | % | (2,800 | ) | (3,106 | ) | -10 | % |
| Lease interest expense | (161 | ) | (1,595 | ) | -89.9 | % | (2,012 | ) | -92 | % | (1,756 | ) | (4,021 | ) | -56 | % |
| Interest expense on debts | (6,098 | ) | (5,755 | ) | 6.0 | % | (4,121 | ) | 48 | % | (11,853 | ) | (8,338 | ) | 42 | % |
| Finance cost on post-employment benefit | (747 | ) | (338 | ) | 121.0 | % | (467 | ) | 60 | % | (1,085 | ) | (834 | ) | 30 | % |
| Unrealized gain (loss) on gold hedges | (24,304 | ) | (100,210 | ) | -75.7 | % | (11,558 | ) | 110 | % | (124,514 | ) | (33,226 | ) | 275 | % |
| Realized gain (loss) on gold hedges | (11,703 | ) | (6,036 | ) | 93.9 | % | – | n.a. | (17,739 | ) | – | n.a. | ||||
| Gain (loss) on other derivative transactions | (1,305 | ) | (1,827 | ) | -28.6 | % | – | n.a. | (3,132 | ) | – | n.a. | ||||
| Change in liability measures at fair value | (4,025 | ) | (2,359 | ) | 70.6 | % | (954 | ) | 322 | % | (6,384 | ) | (3,587 | ) | 78 | % |
| Foreign exchange (gain) loss | (2,462 | ) | (3,176 | ) | -22.5 | % | (11,184 | ) | -78 | % | (5,638 | ) | (13,274 | ) | -58 | % |
| Derivative fee | – | – | n.a. | (13,522 | ) | n.a. | – | (13,522 | ) | n.a. | ||||||
| Loss on settlement of liability with equity instruments | (8,768 | ) | – | n.a. | – | n.a. | (8,768 | ) | – | n.a. | ||||||
| Other finance costs | (297 | ) | (430 | ) | -30.9 | % | (140 | ) | n.a. | (727 | ) | (571 | ) | 27 | % | |
| Interest Income | 1,374 | 1,781 | -22.9 | % | 429 | 220 | % | 3,155 | 1,282 | 146 | % | |||||
| Other gains (losses) | 61 | (754 | ) | n.a. | 1 | n.a. | (693 | ) | (593 | ) | 17 | % | ||||
| Income/ (Loss) before income taxes | 31,372 | (54,949 | ) | n.a. | (4,275 | ) | n.a. | (23,577 | ) | (2,504 | ) | 842 | % | |||
The Company’s Financial Result in Q2 2025 was US$(59.6) million, following on from the US$(121.6) million loss in Q1 2025, impacted by:
Most of Aura’s outstanding gold collars (225,996 Ozs out of about 234,598 Ozs) are associated with the future production of the Borborema Project and will expire between Jul/2025 and Jun/2028. As previously disclosed, about 80% of the production of the first 3 years of the Borborema Project is hedged at ceiling prices of US$2,400.
2.8. Net Income
| (US$ thousand) | Q2 2025 | Q1 2025 | % | Q2 2024 | % | H1 2025 | H1 2024 | % | ||||||||
| Income/ (Loss) before income taxes | 31,372 | (54,949 | ) | n.a. | (4,275 | ) | n.a. | (23,577 | ) | (2,504 | ) | 841.6 | % | |||
| Total taxes | (23,225 | ) | (18,300 | ) | 27 | % | (21,500 | ) | 8 | % | (41,525 | ) | (32,488 | ) | 28 | % |
| Current income tax (expense) | (29,551 | ) | (20,814 | ) | -42 | % | (14,612 | ) | 102 | % | (50,365 | ) | (24,755 | ) | 103 | % |
| Deferred income tax (expense) recovery | 6,326 | 2,514 | -152 | % | (6,888 | ) | -192 | % | 8,840 | (7,733 | ) | n.a. | ||||
| Income/(Loss) for the period | 8,147 | (73,249 | ) | n.a. | (25,775 | ) | -132 | % | (65,102 | ) | (34,992 | ) | n.a. | |||
| Net Margin | 4 | % | -45 | % | n.a. | -19 | % | -122 | % | -18 | % | -13 | % | n.a. | ||
| Unrealized loss with derivative gold collars | (24,304 | ) | (100,210 | ) | n.a. | (11,558 | ) | 110 | % | (124,514 | ) | (33,226 | ) | 275 | % | |
| Gain (loss) on foreign exchange | (2,462 | ) | (3,176 | ) | 22 | % | (11,184 | ) | -78 | % | (5,638 | ) | (13,274 | ) | -58 | % |
| Deferred taxes on non-monetary items | 6,847 | 3,234 | n.a. | (12,447 | ) | -155 | % | 10,081 | (11,472 | ) | n.a. | |||||
| Loss on settlement of liability with equity instruments | (8,768 | ) | – | n.a. | – | n.a. | (8,768 | ) | – | n.a. | ||||||
| Adjusted Net Income | 36,834 | 26,903 | 37 | % | 9,414 | 291 | % | 63,738 | 22,980 | 177 | % | |||||
Net Income in Q2 2025 was US$8.1 million, an increase when compared to a Net Loss of US$(25.8) in Q2 2024 and US$(73.2) in Q1 2025. This improvement vs. Q2 2024 and Q1 2025 was mainly due to the improvement in the Operating Income during Q2 2025. In addition, compared to Q1 2025, there was a decrease in Finance Costs in the quarter, related to a lower unrealized loss on gold hedges in Q2 2025, which resulted from mark-to-market (MTM) adjustments on open hedge positions, driven by increase in gold price between the start and the end of the quarter
In H1 2025, Net Loss reached US$(65.1), also mainly due to mark-to-market (MTM) adjustments on open hedge positions, driven by increase in gold price between the start and the end of the semester.
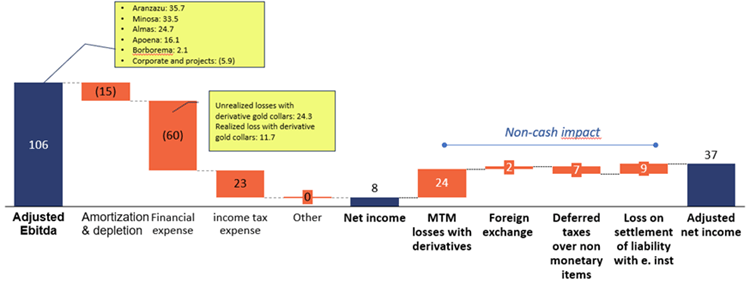
Adjusted Net Income
As result of increase in the Company’s Operating Income, adjusted net income in Q2 2025 was US$36.8 million in the period, compared to US$9.4 million in Q2 2024, excluding:
Managerial view – Adjusted EBITDA to Adjusted Net Income Q2 2025 Bridge (US$ million)
3.1 Aranzazu
| (US$ thousand) | Q2 2025 | Q1 2025 | % | Q2 2024 | % | H1 2025 | H1 2024 | % | ||||||||
| Production at Constant Prices (GEO)¹ | 22,281 | 19,017 | 17 | % | 19,337 | 15 | % | 41,298 | 39,439 | 5 | % | |||||
| Production at Current Prices (GEO) | 22,281 | 20,456 | 9 | % | 24,692 | -10 | % | 42,737 | 49,693 | -14 | % | |||||
| Sales (GEO) | 22,290 | 20,456 | 9 | % | 24,683 | -10 | % | 42,746 | 49,786 | -14 | % | |||||
| Cash Cost (US$/GEO) | 1,110 | 1,164 | -5 | % | 958 | 16 | % | 1,136 | 942 | 21 | % | |||||
| AISC (US$/GEO) | 1,514 | 1,545 | -2 | % | 1,206 | 26 | % | 1,529 | 1,235 | 24 | % | |||||
| Net Revenue | 62,508 | 50,262 | 24 | % | 49,240 | 27 | % | 112,770 | 93,402 | 21 | % | |||||
| Cost of goods sold | (31,021 | ) | (30,282 | ) | 2 | % | (29,266 | ) | 6 | % | (61,303 | ) | (58,130 | ) | 5 | % |
| Gross Profit | 31,487 | 19,980 | 58 | % | 19,974 | 58 | % | 51,467 | 35,272 | 46 | % | |||||
| Expenses | (2,310 | ) | (2,483 | ) | -7 | % | (2,588 | ) | -11 | % | (4,793 | ) | (5,010 | ) | -4 | % |
| G&A | (1,516 | ) | (1,774 | ) | -15 | % | (932 | ) | 63 | % | (3,290 | ) | (2,244 | ) | 47 | % |
| Exploration expenses | (794 | ) | (709 | ) | 12 | % | (1,656 | ) | -52 | % | (1,503 | ) | (2,766 | ) | -46 | % |
| EBIT | 29,177 | 17,497 | 67 | % | 17,386 | 68 | % | 46,674 | 30,262 | 54 | % | |||||
| Adjusted EBITDA | 35,684 | 24,387 | 46 | % | 23,012 | 55 | % | 60,254 | 41,502 | 45 | % | |||||
| Financial Result | (4,292 | ) | (606 | ) | 608 | % | (832 | ) | 416 | % | (4,898 | ) | (1,675 | ) | 192 | % |
| Financial expenses | (3,762 | ) | (34 | ) | n.a. | (201 | ) | n.a. | (3,796 | ) | (748 | ) | 407 | % | ||
| Other revenue/expenses | (530 | ) | (572 | ) | -7 | % | (631 | ) | -16 | % | (1,102 | ) | (927 | ) | 19 | % |
| EBT | 24,885 | 16,891 | 47 | % | 16,554 | 50.3 | % | 41,776 | 28,587 | 46.1 | % | |||||
| Total taxes | (12,532 | ) | (7,383 | ) | 70 | % | (6,814 | ) | 84 | % | (19,915 | ) | (11,230 | ) | 77 | % |
| Current income tax (expense) | (13,035 | ) | (6,431 | ) | n.a. | (7,796 | ) | 67 | % | (19,466 | ) | (12,291 | ) | 58 | % | |
| Deferred income tax (expense) recovery | 503 | (952 | ) | n.a. | 982 | -49 | % | (449 | ) | 1,061 | n.a. | |||||
| Net Income | 12,353 | 9,508 | 30 | % | 9,740 | 27 | % | 21,861 | 17,357 | 26 | % | |||||
Applies the metal sale prices in Aranzazu realized during Q2 2025: Copper price = US$4.39/lb; Gold Price = US$3,293/oz; Silver Price = US$34.27/oz.
In the second quarter of 2025, Aranzazu production reached 22,281 GEO, representing an increase of 9%, at current prices, and 17% at constant prices, when compared to the previous quarter, resulting from higher grades and better recoveries, despite the increase in gold prices which negatively impacted the conversion to GEO. When compared to Q2 2024, production decreased by 14% due to the sharp increase in gold prices between the periods which also impacted GEO conversion. At constant prices, Aranzazu production increased by 15%, also due to higher grades and a recovery improvement.
Aranzazu’s Net Revenue totaled US$62.5 million for Q2 2025, 24% higher than Q1 2025. Net Revenue grew 27% compared to Q2 2024, driven by higher metal prices. In H1 2025, the Net Revenue of Aranzazu reached US$112.8 million, a 21% increase compared to H1 2024.
The Cash Cost was US$1,110/GEO for the quarter, 5% lower than Q1 2025 and 16% higher than Q2 2024. In H1 2025, Cash Cost increased by 21%, with a total of US$1,136/GEO in the semester. Aranzazu`s AISC was US$1,514 in the quarter, representing a 26% increase compared to the same period last year mainly due to differences in metal prices. At constant metal prices, AISC decreased by 3% when compared to Q2 2024. The decrease in AISC versus last year is a result from higher grades and recoveries, in line with planned mine sequencing, partially offset by higher investments in primary development and tailing dams. In H1 2025, the AISC was US$1,248, an increase of 1% compared to the same period in 2024 at same metal prices.
The cost discipline aligned with better productivity drove the Adjusted EBITDA to US$35.7 million in Q2 2025, 46% higher than Q1 2025 and 55% higher than Q2 2024. In H1 2025, Adjusted EBITDA reached US$60.1 million, an increase of 45% over H2 2024. Aranzazu’s Net Income totaled US$12.3 million in Q2 2025, a 27% increase compared to Q2 2024, and US$21.9 million in H1 2024.
3.2 Apoena
| (US$ thousand) | Q2 2025 | Q1 2025 | % | Q2 2024 | % | H1 2025 | H1 2024 | % | ||||||||
| Production (GEO) | 8,219 | 8,876 | -7 | % | 9,912 | -17 | % | 17,095 | 22,017 | -22 | % | |||||
| Sales (GEO) | 8,219 | 9,408 | -13 | % | 8,258 | -0 | % | 17,627 | 21,118 | -17 | % | |||||
| Cash Cost (US$/GEO) | 1,168 | 1,228 | -5 | % | 1,252 | -7 | % | 1,200 | 940 | 28 | % | |||||
| AISC (US$/GEO) | 1,751 | 2,041 | -14 | % | 1,958 | -11 | % | 1,906 | 1,500 | 27 | % | |||||
| Net Revenue | 26,711 | 26,353 | 1 | % | 18,992 | 41 | % | 53,064 | 44,999 | 18 | % | |||||
| Cost of goods sold | (14,270 | ) | (15,104 | ) | -6 | % | (15,814 | ) | -10 | % | (29,374 | ) | (31,749 | ) | -7 | % |
| Gross Profit | 12,441 | 11,249 | 11 | % | 3,178 | 291 | % | 23,690 | 13,250 | 79 | % | |||||
| Expenses | (998 | ) | (1,425 | ) | -30 | % | (1,150 | ) | -13 | % | (2,423 | ) | (2,175 | ) | 11 | % |
| G&A | (936 | ) | (1,301 | ) | -28 | % | (785 | ) | 19 | % | (2,237 | ) | (1,427 | ) | 57 | % |
| Care & maintenance expenses | – | – | n.a. | (243 | ) | n.a. | – | (578 | ) | n.a. | ||||||
| Exploration expenses | (62 | ) | (124 | ) | -50 | % | (122 | ) | -49 | % | (186 | ) | (170 | ) | 9 | % |
| ARO | – | 1,330 | n.a. | – | n.a. | 1,330 | – | n.a. | ||||||||
| EBIT | 11,443 | 9,824 | 16 | % | 2,028 | 464 | % | 21,267 | 11,075 | 92 | % | |||||
| Adjusted EBITDA | 16,151 | 13,516 | 19 | % | 7,541 | 114 | % | 29,697 | 23,046 | 29 | % | |||||
| Financial Result | (1,453 | ) | (6,567 | ) | -78 | % | (2,708 | ) | -46 | % | (8,020 | ) | (6,350 | ) | 26 | % |
| Financial expenses | (1,497 | ) | (6,636 | ) | -77 | % | (2,798 | ) | -46 | % | (8,133 | ) | (6,440 | ) | 26 | % |
| Other revenue/expenses | 44 | 69 | -36 | % | 90 | n.a. | 113 | 90 | 26 | % | ||||||
| EBT | 9,990 | 3,257 | 207 | % | (680 | ) | n.a. | 13,247 | 4,725 | 180 | % | |||||
| Total taxes | (1,211 | ) | 1,342 | n.a. | (2,788 | ) | -57 | % | 131 | (3,507 | ) | n.a. | ||||
| Current income tax (expense) | (862 | ) | (663 | ) | 30 | % | (986 | ) | -13 | % | (1,525 | ) | (1,882 | ) | -19 | % |
| Deferred income tax (expense) recovery | (349 | ) | 2,005 | n.a. | (1,802 | ) | -81 | % | 1,656 | (1,625 | ) | n.a. | ||||
| Net Income | 8,779 | 4,599 | 91 | % | (3,468 | ) | n.a. | 13,378 | 1,218 | 998 | % | |||||
In the second quarter of 2025, Apoena production was in line with expectations and at 8,219 GEO, a 17% decrease from Q2 2024, primarily due to the mine’s investment phase focusing on opening the Nosde Phase III pit, and lower ore grades as result. Compared to Q1 2025, production decreased 7%, consistent with the mine plan, as lower-grade ore was mined. Despite this decrease, production remains in line with the Company’ full year 2025 expectations. Pre-stripping activities are underway while we push back the Nosde and Lavrinha mines to regain access to higher volume and higher grades by end of 2026 at Nosde Phase III.
Apoena’s Net Revenue totaled US$26.7 million for Q2 2025, in line with Q1 2025. Compared to Q2 2024, the significant increase of 41% mainly due to the higher gold price, offsetting the lower production. In H1 2025, Apoena reached a Net Revenue of US$53.1 million, an increase of 18% compared to H1 2024.
The Cash Cost was US$1,168/GEO for the quarter, a 5% decrease versus Q1 2025 and 7% lower than Q2 2024. Apoena’s AISC was US$ 1,751/GEO in Q2 2025, a drop of 14% versus Q1 2025 and a decrease of 11% compared to Q2 2024, mainly driven by increase in the proportion of costs capitalized as expansion capex, related to the Nosde pit. In H1 2025, the AISC was US$1,906, an increase of 27% compared to the same period in 2024, which was expected considering the mine sequencing. Despite the ongoing investments in expansion, which have temporarily impacted production, the focus on cost control combined with higher gold prices drove Adjusted EBITDA to US$16.1 million in Q2 2025, up 114% compared to Q2 2024 and 19% higher than Q1 2025. In H1 2025, Adjusted EBITDA reached US$29.7 million, an increase of 29% over H2 2024.
Apoena’s net income totaled US$8.8 million in Q2 2025, a 91% increase over Q1 2025 and a significant improvement from the net loss of US$3.5 million recorded in Q2 2024 resulting in a net income of US$13.4 million in the H1 2025, an increase of 998% when compared to H1 2024.
3.3 Minosa
| (US$ thousand) | Q2 2025 | Q1 2025 | % | Q2 2024 | % | H1 2025 | H1 2024 | % | ||||||||
| Production (GEO) | 18,039 | 17,654 | 2 | % | 19,142 | -6 | % | 35,693 | 38,328 | -7 | % | |||||
| Sales (GEO) | 17,836 | 17,526 | 2 | % | 19,738 | -10 | % | 35,362 | 38,966 | -9 | % | |||||
| Cash Cost (US$/GEO) | 1,178 | 1,149 | 3 | % | 1,094 | 8 | % | 1,164 | 1,140 | 2 | % | |||||
| AISC (US$/GEO) | 1,292 | 1,249 | 3 | % | 1,159 | 12 | % | 1,271 | 1,223 | 4 | % | |||||
| Net Revenue | 55,776 | 48,062 | 16 | % | 41,962 | 33 | % | 103,838 | 79,609 | 30 | % | |||||
| Cost of goods sold | (22,056 | ) | (21,476 | ) | 3 | % | (23,171 | ) | -5 | % | (43,532 | ) | (47,213 | ) | -8 | % |
| Gross Profit | 33,720 | 26,586 | 27 | % | 18,791 | 79 | % | 60,306 | 32,396 | 86 | % | |||||
| Expenses | (1,430 | ) | (1,371 | ) | 4 | % | (1,242 | ) | 15 | % | (2,801 | ) | (2,392 | ) | 17 | % |
| G&A | (1,166 | ) | (1,135 | ) | 3 | % | (1,242 | ) | -6 | % | (2,301 | ) | (2,391 | ) | -4 | % |
| Exploration expenses | (264 | ) | (236 | ) | 12 | % | – | n.a. | (500 | ) | (1 | ) | n.a. | |||
| EBIT | 32,290 | 25,215 | 28 | % | 17,549 | 84 | % | 57,505 | 30,004 | 92 | % | |||||
| Adjusted EBITDA | 33,533 | 26,856 | 25 | % | 19,120 | 75 | % | 60,646 | 32,796 | 85 | % | |||||
| Financial Result | (1,189 | ) | (1,556 | ) | -24 | % | (2,064 | ) | -42 | % | (2,745 | ) | (4,426 | ) | -38 | % |
| Financial expenses | (1,442 | ) | (1,312 | ) | 10 | % | (1,661 | ) | -13 | % | (2,754 | ) | (3,836 | ) | -28 | % |
| Other revenue/expenses | 253 | (244 | ) | n.a. | (403 | ) | n.a. | 9 | (590 | ) | n.a. | |||||
| EBT | 31,101 | 23,659 | 31 | % | 15,485 | 101 | % | 54,760 | 25,578 | 114 | % | |||||
| Total taxes | (7,425 | ) | (6,218 | ) | 19 | % | (4,948 | ) | 50 | % | (13,643 | ) | (8,743 | ) | 56 | % |
| Current income tax (expense) | (7,774 | ) | (6,611 | ) | 18 | % | (4,936 | ) | 57 | % | (14,385 | ) | (8,508 | ) | 69 | % |
| Deferred income tax (expense) recovery | 349 | 393 | -11 | % | (12 | ) | n.a. | 742 | (235 | ) | n.a. | |||||
| Net Income | 23,676 | 17,441 | 36 | % | 10,537 | 125 | % | 41,117 | 16,835 | 144 | % | |||||
In the second quarter of 2025, Minosa produced 18,039 GEO, up 2% when compared to the previous quarter, resulting from higher grades processed during the quarter due to mine sequencing. When compared to the same quarter last year, production decreased by 6%, primarily due to lower stacking volumes in Q2 2025, impacted by higher rainfall levels during the period and was in line with the Company’s expectations.
Net Revenue totaled US$55.8 million in Q2 2025, up 16% from Q1 2025, due to higher gold prices and sales volumes, while in comparison to Q2 2024 it grew 33%, mainly due to the increase in the price of gold over the period. In H1 2025, Net Revenue reached US$103.8 million, 30% higher than H1 2024.
The Cash Cost was US$1,178/GEO in Q2 2025, 3% higher than Q1 2025 and 8% higher than Q2 2024, due to lower production as result of the lower stacking volumes. In H1 2025, Cash Cost was US$1,164/GEO, 2% increase compared to H1 2024, due to lower grades and slightly higher mine costs. Considering these effects, All-In Sustaining Cost totaled US$1,292/GEO for the quarter, an increase of 3% compared to Q1 2025 and 12% compared to Q2 2024.
The Adjusted EBITDA totaled US$33.5 million in Q2 2025, up 84% versus Q2 2024, reflecting the positive impact of a strong cost control and higher gold prices, while it was up 25% versus Q1 2025. In H1 2025, Adjusted EBITDA reached US$60.4 million, an increase of 84%. Minosa’s Net Income totaled US$23.7 million for the quarter, up 125% in Q2 2024 and 36% in Q1 2025, resulting in a Net income of US$ 41.1 million in the H1 2025.
3.4 Almas
| (US$ thousand) | Q2 2025 | Q1 2025 | % | Q2 2024 | % | H1 2025 | H1 2024 | % | ||||||||
| Production (GEO) | 12,917 | 13,101 | -1 | % | 10,580 | 22 | % | 26,018 | 22,475 | 16 | % | |||||
| Sales (GEO) | 12,917 | 13,101 | -1 | % | 10,580 | 22 | % | 26,018 | 22,475 | 16 | % | |||||
| Cash Cost (US$/GEO) | 1,167 | 1,069 | 9 | % | 1,203 | -3 | % | 1,118 | 1,176 | -5 | % | |||||
| AISC (US$/GEO) | 1,364 | 1,195 | 14 | % | 1,434 | -5 | % | 1,279 | 1,428 | -10 | % | |||||
| Net Revenue | 41,751 | 37,127 | 12 | % | 24,217 | 72 | % | 78,878 | 48,479 | 63 | % | |||||
| Cost of goods sold | (18,036 | ) | (16,514 | ) | 9 | % | (14,851 | ) | 21 | % | (34,550 | ) | (31,407 | ) | 10 | % |
| Gross Profit | 23,715 | 20,613 | 15 | % | 9,366 | 153 | % | 44,328 | 17,072 | 160 | % | |||||
| Expenses | (1,898 | ) | (1,040 | ) | 83 | % | (930 | ) | 104 | % | (2,938 | ) | (1,997 | ) | 47 | % |
| G&A | (1,475 | ) | (803 | ) | n.a. | (930 | ) | 59 | % | (2,278 | ) | (1,997 | ) | 14 | % | |
| Exploration expenses | (423 | ) | (237 | ) | 78 | % | – | n.a. | (660 | ) | – | n.a. | ||||
| EBIT | 21,817 | 19,573 | 11 | % | 8,436 | 159 | % | 41,390 | 15,075 | 175 | % | |||||
| Adjusted EBITDA | 24,709 | 22,205 | 11 | % | 11,019 | 124 | % | 47,136 | 21,062 | 124 | % | |||||
| Financial Result | (4,468 | ) | (3,746 | ) | 19 | % | (3,391 | ) | 32 | % | (8,214 | ) | (4,506 | ) | 82 | % |
| Financial expenses | (4,448 | ) | (3,740 | ) | 19 | % | (3,394 | ) | 31 | % | (8,188 | ) | (4,487 | ) | 82 | % |
| Other revenue/expenses | (20 | ) | (6 | ) | n.a. | 3 | -767 | % | (26 | ) | (19 | ) | n.a. | |||
| EBT | 17,349 | 15,827 | 10 | % | 5,045 | 244 | % | 33,176 | 10,569 | 214 | % | |||||
| Total taxes | (1,226 | ) | (4,757 | ) | -74 | % | (6,404 | ) | -81 | % | (5,983 | ) | (8,317 | ) | n.a. | |
| Current income tax (expense) | (7,101 | ) | (5,998 | ) | 18 | % | (894 | ) | 694 | % | (13,099 | ) | (2,074 | ) | 532 | % |
| Deferred income tax (expense) recovery | 5,875 | 1,241 | 373 | % | (5,510 | ) | n.a. | 7,116 | (6,243 | ) | n.a. | |||||
| Net Income | 16,123 | 11,070 | n.a. | (1,359 | ) | -1286 | % | 27,193 | 2,252 | 1108 | % | |||||
During Q2 2025, Almas produced 12,917 GEO, consistent with Q1 2025 (13,101 GEO). Compared to Q2 2024, production increased by 22%, driven by the plant expansion and improved mine performance, reflecting the benefits of the transition to the new mine contractor during Q2 2024.
Net Revenue was US$41.7 million in Q2 2025, 72% higher than Q2 2024, impacted by higher sales and metal prices. Versus Q1 2025, Net Revenue was up 12%, mainly driven by a significant increase in the price of gold. In H1 2025, Net Revenue was US$78.9 million, a 63% increase compared to H1 2024, resulting from the higher volumes sold and prices increased.
The Cash Cost was US$1,167/GEO in Q2 2025, 3% lower than Q2 2024, due to the higher production volumes which offset the higher strip ratio, and lower grades. Compared to Q1 2025, The Cash Cost increased 9%, resulting from a grade reduction already expected by the mine segmentation. Almas’ AISC was US$1,364/GEO for the quarter, 5% lower compared to Q2 2024, primarily driven by improved operational performance as discussed before along with lower Capex during the quarter. Versus Q1 2025, AISC increased 14%. In H1 2025, the AISC was US$1,364, a decrease of 5% compared to the same period in 2024, mainly as result of the successful change in mine contractor during Q2 2024.
Adjusted EBITDA totaled US$24.7 million in Q2 2025, more than doubled of the Q2 2024 result, driven by plant expansion, improved operating performance, higher volumes processed and an increase in the price of gold. Compared with the Q1 2025, the Adjusted EBITDA was 11% higher than Q1 2025, explained by higher gold prices in the period. In H1 2025, Adjusted EBITDA was US$47.1 million, 123% higher than H1 2024.
Almas’ Net Income was US$16.1 million in Q2 2025, compared to US$11.1 in Q1 2025, also higher than the Loss of Q2 2024 of US$(1.4) million.
3.5 Borborema
| (US$ thousand) | Q2 2025 | H1 2025 | ||
| Production (GEO) | 2,577 | 2,577 | ||
| Sales (GEO) | 1,190 | 1,190 | ||
| Cash Cost (US$/GEO) | 936 | 936 | ||
| AISC (US$/GEO) | 1,441 | 1,441 | ||
| Net Revenue | 3,690 | 3,690 | ||
| Cost of goods sold | (1,114 | ) | (1,114 | ) |
| Gross Profit | 2,576 | 2,576 | ||
| Expenses | (378 | ) | (378 | ) |
| G&A | (378 | ) | (378 | ) |
| Exploration expenses | – | – | ||
| EBIT | 2,198 | 2,198 | ||
| Adjusted EBITDA | 2,084 | 2,084 | ||
| Financial Result | (4,971 | ) | (4,971 | ) |
| Financial expenses | (4,982 | ) | (4,982 | ) |
| Other revenue/expenses | 11 | 11 | ||
| EBT | (2,773 | ) | (2,773 | ) |
| Total taxes | (309 | ) | (309 | ) |
| Current income tax (expense) | – | – | ||
| Deferred income tax (expense) recovery | (309 | ) | (309 | ) |
| Net Income | (3,082 | ) | (3,082 | ) |
The Borborema production in Q2 2025 totaled 2,577 GEO following the project’s first gold pour. The Borborema Project has begun the ramp-up phase on schedule and to budget. The Company expects to achieve commercial production by the third quarter of 2025. Borborema is set to become one of Aura’s flagship assets, expected to produce the second-highest annual gold volumes from among the five operations. Constructed in just 19 months and with no lost-time incidents, the project reinforces Aura’s commitment to developing lean, scalable, efficient operations.
On August 30, 2023, Aura released a Feasibility Study indicating an expected production of 748,000 ounces of gold over an 11.3-year LOM, with the potential for even greater production from a deposit with over 2,000,000 ounces of Measured and Indicated Mineral Resources. The original Feasibility Study for the Borborema project, using a gold price of US$1,712 per ounce, projected total gold production of 812,000 ounces, with an NPV of US$182 million and IRR of 21.9%. The leveraged IRR with 50% debt was calculated at 40.8%, with an operating payback of 3.2 years. Sensitivity analysis using a gold price of US$2,600 per ounce, while maintaining all the other assumptions of the Feasibility Study, shows the NPV increasing to US$537 million, while the IRR rises to 41.8%, the leveraged IRR reaches 81.4% and the payback period improves to 1.7 years.
| (US$ mil) | Q2 2025 | Q1 2025 | % | Q2 2024 | % | H1 2025 | H1 2024 | % | ||||||||
| Adjusted EBITDA | 106,224 | 81,479 | 30 | % | 56,172 | 89 | % | 187,703 | 109,398 | 72 | % | |||||
| (+) Exploration Expenses | 1,714 | 1,376 | 25 | % | 2,951 | -42 | % | 3,090 | 4,893 | -37 | % | |||||
| (-) Sustaining Capex | (15,151 | ) | (10,174 | ) | 49 | % | (6,740 | ) | 125 | % | (28,342 | ) | (17,200 | ) | 65 | % |
| (+/-) ∆ Working Capital and Others | 7,024 | (17,996 | ) | n.a. | (8,499 | ) | -183 | % | (12,020 | ) | (23,499 | ) | n.a. | |||
| (-) Income Taxes Paid | (22,570 | ) | (16,874 | ) | 34 | % | (2,136 | ) | 957 | % | (39,444 | ) | (11,434 | ) | 245 | % |
| (-) Lease Payments | (5,122 | ) | (4,239 | ) | 21 | % | (4,273 | ) | 20 | % | (9,361 | ) | (8,680 | ) | 8 | % |
| (-) Realized Losses on Gold Hedges | (11,699 | ) | (6,036 | ) | 94 | % | – | n.a. | (17,759 | ) | – | n.a. | ||||
| Recurring Free Cash Flow | 60,420 | 27,536 | 119 | % | 37,475 | 61 | % | 83,867 | 53,478 | 57 | % | |||||
Recurring Free Cash Flow for the quarter was US$60.4 million, 119% higher than Q1 2025 and 61% higher than Q2 2024. Compared to Q1 2025, the result is mainly explained by a lower consumption of the working capital and compared to Q2 2024, an additional effect of lower exploration expenses. Both periods were also impacted by an important increase in Adjusted EBITDA, driven especially by higher metal prices. In H1 2025, Free Cash Flow was US$83.9 million, 57% higher than H1 2024.
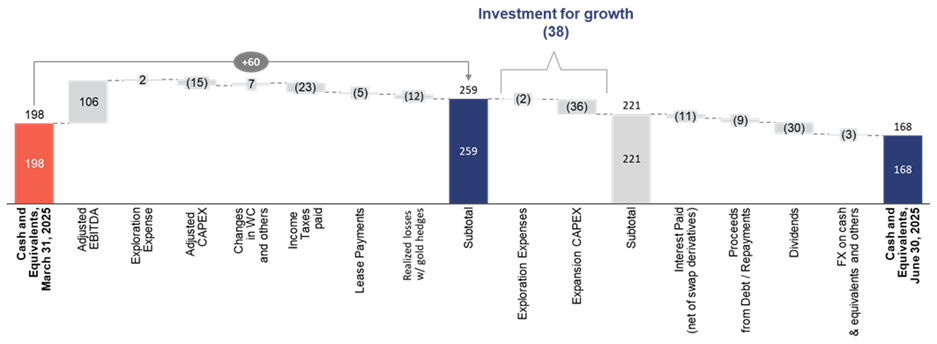
The chart below shows the change in cash position for the three months ending June 30, 2025, from a management perspective:
Changes to the Cash Position Q1 2025 vs. Q2 2025 – Managerial View (US$ Million)
Changes to the Cash Position Q4 2024 vs. Q2 2025 – Managerial View (US$ Million)
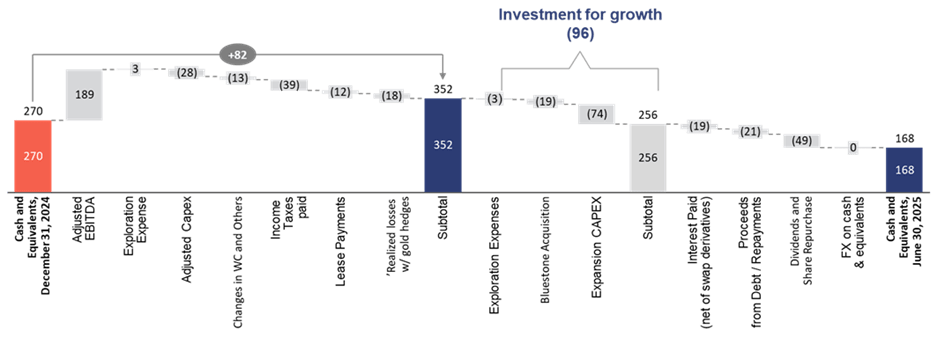
Note: Adjusted Capex includes Exploration and Expansion Capex.
The Company’s consolidated Capex for Q2 2025 totaled US$50.3 million. The main investment headlines for the quarter include:
Total gross debt (short and long-term portion) was US$453,893 at the end of Q2 2025, a decrease when compared to $467,687 at the end of Q1 2025. This decrease was mainly driven by the reduction of US$13,794 due to the settlement of Nemesia SARL debt.
The Company’s cash position remains comfortable, closing out the year at US$167.9 million, despite investment in the expansion of our operations, annual income tax payments and dividend payments. Net Debt was US$280,560 by Q2 2025, due to capex of US$50,327, mostly related to payments related to the construction of the Borborema Project and dividends payment of US$29,811. These impacts were partially offset by the higher cash generation during the quarter
Net Debt Breakdown
| (US$ thousand) | Q2 2025 | Q1 2025 | % | Q2 2024 | % | ||
| Short term debts | 78,786 | 100,853 | -22 | % | 98,004 | -20 | % |
| Long term debts | 375,107 | 366,834 | 2 | % | 236,413 | 59 | % |
| Gross debt | 453,893 | 467,687 | -3 | % | 334,417 | 36 | % |
| Cash | 167,938 | 198,066 | -15 | % | 191,963 | -13 | % |
| Restric Cash | – | – | n.a. | – | n.a. | ||
| Almas Debentures Swap | 5,395 | 2,320 | 133 | % | 45 | 11889 | % |
| Net Debt | 280,560 | 271,941 | 3 | % | 142,499 | 97 | % |
| Net Debt/LTM EBITDA | 0.81x | 0.92x | -0.12x | 0.79x | 0.02x | ||
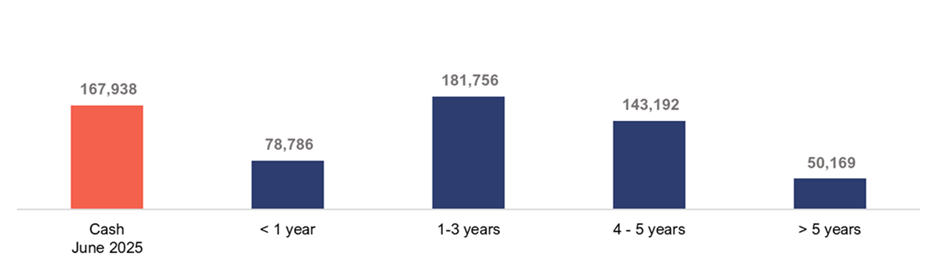
The table below shows the debt amortization timeline:
Debt Amortization Timeline (US$ thousand)
7 Guidance vs. Actual1
The Company is on track to achieve the 2025 Guidance, including Production, Cash Cost, All-in Sustaining Cost and CAPEX, as shown in the results below:
| Gold equivalent ounces production (‘000 GEO) – 2025 | |||||||
| Lower Bound | Upper Bound | H1 2025 A | H1 2025 at Guidance metal prices | % | |||
| Minosa | 64 | 73 | 36 | 36 | 55% – 49% | ||
| Apoena | 29 | 32 | 17 | 17 | 59% – 53% | ||
| Aranzazu | 88 | 97 | 43 | 48 | 49% – 44% | ||
| Almas | 51 | 58 | 26 | 26 | 51% – 45% | ||
| Total ex-Borborema | 233 | 260 | 122 | 127 | 52% – 47% | ||
| Borborema | 33 | 40 | 3 | 3 | 8% – 6% | ||
| Total | 266 | 300 | 124 | 129 | 47% – 41% | ||
|
Cash Cost per equivalent ounce of gold produced – 2025 |
|||||||
| Lower Bound | Upper Bound | H1 2025 A | H1 2025 at Guidance metal prices | % | |||
| Minosa | 1,108 | 1,219 | 1,178 | 1,178 | 106% – 97% | ||
| Apoena | 1,258 | 1,384 | 1,168 | 1,168 | 93% – 84% | ||
| Aranzazu | 1,029 | 1,132 | 1,110 | 950 | 108% – 98% | ||
| Almas | 1,013 | 1,114 | 1,167 | 1,167 | 115% – 105% | ||
| Borborema | 1,084 | 1,232 | 936 | 936 | 86% – 76% | ||
| Total | 1,078 | 1,191 | 1,146 | 1,080 | 96% – 106% | ||
|
|
|||||||
| AISC per equivalent ounce of gold produced – 2025 | ||||||||
| Lower Bound | Upper Bound | H1 2025 A | H1 2025 at Guidance metal prices | % | ||||
| Minosa | 1,263 | 1,364 | 1,279 | 1,279 | 101% – 94% | |||
| Apoena | 2,425 | 2,619 | 1,906 | 1,906 | 79% – 73% | |||
| Aranzazu | 1,348 | 1,455 | 1,532 | 1,295 | 114% – 105% | |||
| Almas | 1,113 | 1,202 | 1,279 | 1,279 | 115% – 106% | |||
| Borborema | 1,113 | 1,304 | 1,186 | 1,186 | 107% – 91% | |||
| Total | 1,374 | 1,492 | 1,456 | 1,367 | 98% – 106% | |||
|
|
||||||||
| Capex (US$ million) – 2025 | ||||||
| Low – 2025 | High – 2025 | H1 2025 A | % | |||
| Sustaining | 40 | 47 | 22 | 55% – 47% | ||
| Exploration | 10 | 13 | 6 | 60% – 45% | ||
| New projects + Expansion | 99 | 106 | 74 | 75% – 70% | ||
| Total | 149 | 167 | 102 | 61% – 68% | ||
____________________________
1 Key Factors:
The Company’s future profitability, operating cash flow and financial position will be directly related to prevailing gold and copper prices. Key factors that influence the price of gold and copper include, among others, the supply and demand for gold and copper, the relative strength of currencies (especially the US dollar) and macroe7conomic factors, such as current and future expectations for inflation and interest rates. Management believes that the economic environment in the short and medium term should remain relatively favorable with respect to commodity prices, albeit with continued volatility.
To reduce the risks associated with commodity prices and currency volatility, the Company will continue to assess and deploy hedging programs. For more information on this subject, please refer to the Reference Form.
Other key factors influencing profitability and operating cash flows are: production levels (affected by grades, ore quantities, process recoveries, labor, country stability and availability of facilities and equipment); production and processing costs (impacted by production levels, prices and the use of key consumables, labor, inflation and exchange rates), and other factors.
9.1 Financial Statements
| (US$ thousand) | Q2 2025 | Q1 2025 | % | Q2 2024 | % | H1 2025 | H1 2024 | % | ||||||||
| Net revenue | 190,436 | 161,804 | 18 | % | 134,411 | 42 | % | 352,240 | 266,489 | 32 | % | |||||
| Cost of goods sold | (86,497 | ) | (83,376 | ) | 4 | % | (83,103 | ) | 4 | % | (169,873 | ) | (168,500 | ) | 1 | % |
| Gross profit | 103,939 | 78,428 | 33 | % | 51,308 | 103 | % | 182,367 | 97,989 | 86 | % | |||||
| General and administrative expenses | (11,284 | ) | (9,636 | ) | 17 | % | (7,156 | ) | 58 | % | (20,920 | ) | (25,038 | ) | -184% | |
| Care-and-maintenance expenses | – | – | n.a. | (375 | ) | -100% | (2,181 | ) | (796 | ) | 174 | % | ||||
| Exploration expenses | (1,714 | ) | (1,376 | ) | 25 | % | (2,951 | ) | -42% | (3,090 | ) | (4,893 | ) | -37% | ||
| Impairment | – | – | n.a. | – | n.a. | – | – | n.a. | ||||||||
| Operating income | 90,941 | 67,416 | 35 | % | 40,826 | 123 | % | 158,357 | 77,286 | 105 | % | |||||
| Financial expenses | (59,630 | ) | (121,611 | ) | -51% | (45,102 | ) | 32 | % | 181,241 | (79,197 | ) | -329% | |||
| Equity Pick Up | – | – | n.a. | – | n.a. | – | – | n.a. | ||||||||
| Other income (expenses) | 61 | (754 | ) | -108% | 1 | 6000 | % | (693 | ) | (593 | ) | 17 | % | |||
| Profit before income taxes | 31,372 | (54,949 | ) | -157% | (4,275 | ) | -834% | (23,577 | ) | (2,504 | ) | 842 | % | |||
| Current income tax (expense) | (29,551 | ) | (20,814 | ) | 42 | % | (14,612 | ) | 102 | % | (50,365 | ) | (24,755 | ) | 103 | % |
| Deferred income tax (expense) recovery | 6,326 | 2,514 | 152 | % | (6,888 | ) | -192% | 8,840 | (7,733 | ) | -214% | |||||
| Total taxes | (23,225 | ) | (18,300 | ) | 27 | % | (21,500 | ) | 8 | % | (41,525 | ) | (32,488 | ) | 28 | % |
| Profit (loss) from continued operation | 8,147 | (73,249 | ) | -111% | (25,775 | ) | -132% | (65,102 | ) | (34,992 | ) | 86 | % | |||
| Profit (loss) from discontinued operation | – | – | n.a. | – | n.a. | – | – | n.a. | ||||||||
| Profit/(loss) for the period | 8,147 | (73,249 | ) | -111% | (25,775 | ) | -132% | (65,102 | ) | (34,992 | ) | 86 | % |
9.2 Balance Sheet
| (US$ million) | Q2 2025 | Q1 2025 | Q2 2024 | |||
| ASSETS | ||||||
| Current | ||||||
| Cash and cash equivalents | 167,938 | 198,066 | 191,963 | |||
| Restricted cash | – | – | – | |||
| Accounts receivables | 4,826 | 15,666 | 1,876 | |||
| Value added taxes and other recoverable taxes | 21,292 | 23,637 | 35,928 | |||
| Inventories | 80,034 | 67,876 | 54,968 | |||
| Derivative financial instrument | 5,395 | – | 45 | |||
| Other receivables and assets | 21,556 | 2,831 | 13,831 | |||
| Total current assets | 301,045 | 333,556 | 315,495 | |||
| Non-current assets | ||||||
| Value added taxes and other recoverable taxes | 46,329 | 43,832 | 15,778 | |||
| Inventories | 23,025 | 19,265 | 11,738 | |||
| Other receivables and assets | 4,319 | 3,741 | 3,457 | |||
| Property, plant and equipment | 762,566 | 720,466 | 516,742 | |||
| Deferred income tax assets | 28,639 | 18,131 | 18,772 | |||
| Total non-current assets | 864,878 | 805,435 | 566,487 | |||
| Total assets | 1,165.923 | 1,138.991 | 881.982 | |||
| LIABILITIES | ||||||
| Current | ||||||
| Trade and other payables | 111,156 | 103,793 | 79,537 | |||
| Derivative financial instruments | 26,654 | 26,578 | – | |||
| Loans and Debentures | 78,786 | 100,853 | 98,004 | |||
| Liability measured at fair value | 485 | 3,829 | 2,869 | |||
| Current income tax liabilities | 28,507 | 31,379 | 8,752 | |||
| Current portion of other liabilities | 14,939 | 14,711 | 1,391 | |||
| Liabilities directly associated with assets classified as held for sale | 2,757 | 2,757 | ||||
| Total current liabilities | 267,649 | 2,839 | 203,072 | |||
| Non-current liabilities | ||||||
| Loans and debentures | 375,107 | 366,834 | 236,413 | |||
| Liability measured at fair value | 17,689 | 15,537 | 21,041 | |||
| Derivative financial instruments | 222,901 | 201,688 | 75,982 | |||
| Deferred income tax liabilities | 35,925 | 32,052 | 1,118 | |||
| Provision for mine closure and restoration | 6,447 | 62,212 | 51,343 | |||
| Other provisions | 28,467 | 27,872 | 13,633 | |||
| Other liabilities | 13,951 | 9,031 | 17,023 | |||
| Total non-current liabilities | 75,851 | 715,226 | 430,702 | |||
|
|
||||||
| SHAREHOLDERS’ EQUITY | ||||||
| Share capital | 633,271 | 6,105 | 608,977 | |||
| Contributed surplus | 55,669 | 55,669 | 55,494 | |||
| Accumulated other comprehensive income | (4,812 | ) | (3,607 | ) | 2,222 | |
| Accumulated losses | (544,364 | ) | (5,227 | ) | (418,485 | ) |
| Deficit | (544,364 | ) | (5,227 | ) | (418,485 | ) |
| Total equity | 139,764 | 13,986 | 248,208 | |||
| Total liabilities and equity | 1,165,923 | 1,138,991 | 881,982 | |||
9.3 Cash Flow Statement
| (US$ thousand) | Q2 2025 | Q1 2025 | Q2 2024 | H1 2025 | H2 2025 | % | ||||||
| Cash flows from operating activities | ||||||||||||
| Income/(Loss) for the period | 8,147 | (73,249 | ) | (25,775 | ) | (65,102 | ) | (34,992 | ) | 86.0 | % | |
| Items not affecting cash | 82,263 | 155,569 | 69,846 | 237,832 | 132,015 | 80.2 | % | |||||
| Changes in working capital | 3,372 | (14,135 | ) | 638 | (10,764 | ) | (17,133 | ) | -37.2 | % | ||
| Taxes paid | (22,570 | ) | (16,874 | ) | (2,136 | ) | (39,444 | ) | (11,434 | ) | 245.0 | % |
| Other assets and liabilities | 8,653 | (10,082 | ) | 11,038 | (1,429 | ) | 11,007 | -113.0 | % | |||
| Net cash generated by operating activities | 79,864 | 41,229 | 53,612 | 121,093 | 79,464 | 52 | % | |||||
|
Cash flows from investing activities |
||||||||||||
| Purchase of property, plant and equipment, and other investments | (50,325 | ) | (51,725 | ) | (23,575 | ) | (102,051 | ) | (53,278 | ) | 91.5 | % |
| Short term investments | – | – | 1,314 | – | – | 0.0 | % | |||||
| Proceeds on sale of plant and equipment | – | – | – | – | – | 0.0 | % | |||||
| Acquision of investment – Big River Gold | – | – | – | – | – | 0.0 | % | |||||
| Bluestone | – | (1,244 | ) | – | (1,244 | ) | – | |||||
| Acquisition of investment – Altamira Gold Corp | (439 | ) | – | – | – | – | 0.0 | % | ||||
| Cash impact from acqusition included into consolidation | – | – | – | – | – | |||||||
| Net cash generated by investing activities | (50,764 | ) | (52,969 | ) | (22,261 | ) | (102,051 | ) | (53,278 | ) | 92 | % |
|
Cash flows from financing activities |
||||||||||||
| Proceeds received from loans and debentures | – | – | 19,000 | – | 34,000 | -100.0 | % | |||||
| Repayment of loans and debentures | (9,147 | ) | (11,455 | ) | (9,520 | ) | (20,602 | ) | (23,312 | ) | ||
| Derivative settlement- debt swap agreements | 2,582 | – | – | 2,582 | 2,868 | 90.0 | % | |||||
| Derivative fee | – | – | (13,522 | ) | – | (13,522 | ) | -65.3 | % | |||
| Interest paid on loans and debentures | (13,397 | ) | (7,775 | ) | (4,096 | ) | (21,172 | ) | (17,698 | ) | ||
| Payment of liability (NSR agreement) | (853 | ) | (741 | ) | (1,136 | ) | (1,594 | ) | (1,210 | ) | -11.6 | % |
| Principal and interest payments of lease liabilities | (5,122 | ) | (4,239 | ) | (4,273 | ) | (9,361 | ) | (8,680 | ) | 19.0 | % |
| Repayment of other liabilities | – | (981 | ) | – | (981 | ) | (825 | ) | 7.8 | % | ||
| Payment of dividends | (29,811 | ) | (18,333 | ) | (25,339 | ) | (48,144 | ) | (25,339 | ) | 19.6 | % |
| Proceeds from exercise of stock options | – | – | 100 | – | 100 | |||||||
| Acquisition of treasury shares | – | (1,200 | ) | (3,458 | ) | (1,200 | ) | (3,458 | ) | |||
| Net cash generated by financing activities | (55,748 | ) | (44,724 | ) | (42,244 | ) | (100,472 | ) | (57,176 | ) | 76 | % |
| Increase (decrease) in cash and cash equivalents | (26,648 | ) | (56,465 | ) | (10,893 | ) | (81,429 | ) | (30,891 | ) | 163.6 | % |
| Effect of foreign exchange gain (loss) on cash equivalents | (3,480 | ) | 1,635 | (11,210 | ) | (1,845 | ) | (14,442 | ) | -87.2% | ||
| Cash and cash equivalents, beginning of the period | 495,931 | 270,188 | 214,067 | 270,189 | 237,295 | 13.9 | % | |||||
| Per balance sheet at the end of comparative period | 465,804 | 215,359 | 191,962 | 186,915 | 191,962 | -3% |
Qualified Person
Farshid Ghazanfari, P.Geo., Mineral Resources and Geology Director for Aura Minerals Inc., has reviewed and approved the scientific and technical information contained within this Press Release and serves as the Qualified Person as defined in NI 43-101 and S-K 1300. All NI 43-101 technical reports related to properties material to Aura are available on SEDAR+ at sedarplus.ca and all S-K 1300 technical report summaries related to properties material to Aura are available on www.sec.gov.
About Aura 360° Mining
Aura is focused on mining in complete terms – thinking holistically about how its business impacts and benefits every one of our stakeholders: our company, our shareholders, our employees, and the countries and communities we serve. We call this 360° Mining.
Aura is a company focused on the development and operation of gold and base metal projects in the Americas. The Company’s five operating assets include the Minosa gold mine in Honduras; the Almas, Apoena, and Borborema gold mines in Brazil; and the Aranzazu copper, gold, and silver mine in Mexico. Additionally, the Company owns Era Dorada, a gold project in Guatemala; Tolda Fria, a gold project in Colombia; and three projects in Brazil: Matupá, which is under development; São Francisco, which is in care and maintenance; and the Carajás copper project in the Carajás region, in the exploration phase.
| Net Revenue | |||||||||||
| (US$ thousand) | Q2 2025 | Q1 2025 | % | Q2 2024 | % | H1 2025 | H1 2024 | % | |||
| Aranzazu | 62,508 | 50,262 | 24 | % | 49,240 | 27 | % | 112,770 | 93,402 | 21 | % |
| Apoena | 26,711 | 26,353 | 1 | % | 18,992 | 41 | % | 53,064 | 44,999 | 18 | % |
| Minosa | 55,776 | 48,062 | 16 | % | 41,962 | 33 | % | 103,838 | 79,609 | 30 | % |
| Almas | 41,751 | 37,127 | 12 | % | 24,217 | 72 | % | 78,878 | 48,479 | 63 | % |
| Borborema | 3,690 | – | n.a | – | n.a | 3,690 | – | n.a. | |||
| Total | 190,436 | 161,804 | 18 | % | 134,411 | 42 | % | 352,240 | 266,489 | 32 | % |
| English | ||||||||||||||||
| (GEO) | Q2 2025 | Q1 2025 | % | Q2 2024 | % | H1 2025 | H1 2024 | % | ||||||||
| Production | 64,033 | 60,087 | 7 | % | 64,327 | -0 | % | 124,120 | 132,514 | -6 | % | |||||
| Aranzazu | 22,281 | 20,456 | 9 | % | 24,692 | -10 | % | 42,737 | 49,693 | -14 | % | |||||
| Apoena | 8,219 | 8,876 | -7 | % | 9,912 | -17 | % | 17,095 | 22,017 | -22 | % | |||||
| Minosa | 18,039 | 17,654 | 2 | % | 19,142 | -6 | % | 35,693 | 38,328 | -7 | % | |||||
| Almas | 12,917 | 13,101 | -1 | % | 10,580 | 22 | % | 26,018 | 22,475 | 16 | % | |||||
| Borborema | 2,577 | 0 | n.a. | 0 | % | n.a. | 257700 | % | 0 | % | n.a. | |||||
| Total | 64,042 | 60,087 | 7 | % | 64,327 | -0 | % | 121,552 | 132,514 | -8 | % | |||||
| 0 | ||||||||||||||||
| Vendas | ||||||||||||||||
| (GEO) | Q2 2025 | Q1 2025 | % | Q2 2024 | % | H1 2025 | H1 2024 | % | ||||||||
| Sales | 62,452 | 60,491 | 3 | % | 63,258 | -1 | % | 122,943 | 132,344 | -7 | % | |||||
| Aranzazu | 22,290 | 20,456 | 9 | % | 24,683 | -10 | % | 42,746 | 49,786 | -14 | % | |||||
| Apoena | 8,219 | 9,408 | -13 | % | 8,258 | -0 | % | 17,627 | 21,118 | -17 | % | |||||
| Minosa | 17,836 | 17,526 | 2 | % | 19,738 | -10 | % | 35,362 | 38,966 | -9 | % | |||||
| Almas | 12,917 | 13,101 | -1 | % | 10,580 | 22 | % | 26,018 | 22,475 | 16 | % | |||||
| Borborema | 1,190 | 0 | n.a. | 0 | n.a. | 1,190 | 0 | n.a. | ||||||||
| Total | 62,452 | 60,491 | 3 | % | 62,452 | 63,258 | -1 | % | ||||||||
|
|
||||||||||||||||
| Custo Caixa | ||||||||||||||||
| (US$/GEO) | Q2 2025 | Q1 2025 | % | Q2 2024 | % | H1 2025 | H1 2024 | % | ||||||||
| Cash Cost | 1,146 | 1,149 | -0 | % | 1,080 | 6 | % | 1,147 | 1,040 | 10 | % | |||||
| Aranzazu | 1,110 | 1,164 | -5 | % | 958 | 16 | % | 1,136 | 942 | 21 | % | |||||
| Apoena | 1,168 | 1,228 | -5 | % | 1,252 | -7 | % | 1,200 | 940 | 28 | % | |||||
| Minosa | 1,178 | 1,149 | 3 | % | 1,094 | 8 | % | 1,164 | 1,140 | 2 | % | |||||
| Almas | 1,167 | 1,069 | 9 | % | 1,203 | -3 | % | 1,118 | 1,176 | -5 | % | |||||
| Borborema | 936 | 0 | n.a. | 0 | n.a. | 936 | – | n.a. | ||||||||
| Total | 1,152 | 1,149 | 0 | % | 1,080 | 7 | % | 1,151 | 1,040 | 11 | % | |||||
| All-in Sustaining Cost | 1,449 | 1,461 | -1 | % | 1,328 | 9 | % | 1,455 | 1,307 | 11 | % | |||||
| Aranzazu | 1,514 | 1,545 | -2 | % | 1,206 | 26 | % | 1,529 | 1,235 | 24 | % | |||||
| Apoena | 1,751 | 2,041 | -14 | % | 1,958 | -11 | % | 1,906 | 1,500 | 27 | % | |||||
| Minosa | 1,292 | 1,249 | 3 | % | 1,159 | 12 | % | 1,271 | 1,223 | 4 | % | |||||
| Almas | 1,364 | 1,195 | 14 | % | 1,434 | -5 | % | 1,279 | 1,428 | -10 | % | |||||
| Borborema | 1,441 | 0 | n.a. | 0 | n.a. | 1,441 | – | n.a. | ||||||||
| Total | 1,449 | 1,461 | -0.8 | % | 1,449 | 1,328 | 9.1 | % | ||||||||
| 0 | ||||||||||||||||
|
|
||||||||||||||||
| Aranzazu | ||||||||||||||||
| (US$ thousand) | Q2 2025 | Q1 2025 | % | Q2 2024 | % | H1 2025 | H1 2024 | % | ||||||||
| Net Revenue | 62,508 | 50,262 | 24.4 | % | #N/A | 49,240 | 26.9 | % | ||||||||
| Cost of goods sold | (31,021 | ) | (30,282 | ) | 2.4 | % | #N/A | (29,266 | ) | 6.0 | % | |||||
| Depreciation and amortization | #N/A | #N/A | #N/A | #N/A | – | #N/A | ||||||||||
| Gross Profit | 12,353 | 9,508 | 29.9 | % | #N/A | 19,974 | -38.2 | % | ||||||||
| Adjusted EBITDA | 35,684 | 24,387 | 46.3 | % | #N/A | 23,012 | 55.1 | % | ||||||||
|
|
||||||||||||||||
| EPP | ||||||||||||||||
| (US$ thousand) | Q2 2025 | Q1 2025 | % | Q2 2024 | % | H1 2025 | ||||||||||
| Net Revenue | #N/A | #N/A | #N/A | #N/A | – | #N/A | ||||||||||
| Cost of goods sold | #N/A | #N/A | #N/A | #N/A | – | #N/A | ||||||||||
| Depreciation and amortization | #N/A | #N/A | #N/A | #N/A | – | #N/A | ||||||||||
| Gross Profit | #N/A | #N/A | #N/A | #N/A | – | #N/A | ||||||||||
| Adjusted EBITDA | #N/A | #N/A | #N/A | #N/A | – | #N/A | ||||||||||
|
San Andres |
||||||||||||||||
| (US$ thousand) | Q2 2025 | Q1 2025 | % | Q2 2024 | % | H1 2025 | ||||||||||
| Net Revenue | #N/A | #N/A | #N/A | #N/A | – | #N/A | ||||||||||
| Cost of goods sold | #N/A | #N/A | #N/A | #N/A | – | #N/A | ||||||||||
| Depreciation and amortization | #N/A | #N/A | #N/A | #N/A | – | #N/A | ||||||||||
| Gross Profit | #N/A | #N/A | #N/A | #N/A | – | #N/A | ||||||||||
| Adjusted EBITDA | #N/A | #N/A | #N/A | #N/A | – | #N/A | ||||||||||
| (US$ thousand) | Q2 2025 | Q1 2025 | % | Q2 2024 | % | H1 2025 | H1 2024 | % | ||||||||
| Total Production (GEO) | 64,033 | 60,087 | 7 | % | 64,327 | -0 | % | 124,120 | 132,514 | -6 | % | |||||
| Total Commercial Production (GEO) | 64,033 | 60,087 | 7 | % | 64,327 | -0 | % | 124,120 | 132,514 | -6 | % | |||||
| Total Sales (GEO) | 62,452 | 60,491 | 3 | % | 63,258 | -1 | % | 122,943 | 132,344 | -7 | % | |||||
| Net Revenue | 190,436 | 161,804 | 18 | % | 134,411 | 42 | % | 352,240 | 266,489 | 32 | % | |||||
| Gross Profit | 103,939 | 78,428 | 33 | % | 51,308 | 103 | % | 182,367 | 97,989 | 86 | % | |||||
| Gross Margin | 55 | % | 48 | % | 6 p.p. | 38 | % | 16 p.p. | 52 | % | 37 | % | 15 p.p. | |||
| EBITDA | 106,224 | 81,479 | 30 | % | 53,208 | 100 | % | 187,703 | 109,398 | 72 | % | |||||
| EBITDA Margin | 56 | % | 50 | % | 542 p.p. | 40 | % | 1619 p.p. | 53 | % | 41 | % | 1224 p.p. | |||
| Adjusted EBITDA | 106,224 | 81,479 | 30 | % | 56,172 | 89 | % | 187,703 | 109,380 | 72 | % | |||||
| Adjusted EBITDA Margin | 56 | % | 50 | % | 5 p.p. | 42 | % | 14 p.p. | 53 | % | 41 | % | 12 p.p. | |||
| Net Income | 8,147 | (73,249 | ) | n.a. | (25,775 | ) | -132 | % | (65,102 | ) | (34,992 | ) | n.a. | |||
| Net Income Margin | 4 | % | -45 | % | n.a. | -19 | % | -122 | % | -18 | % | -13 | % | n.a. | ||
| Adjusted Net Income¹ | 36,834 | 26,903 | 37 | % | 9,414 | 291 | % | 63,737 | 22,980 | 177 | % | |||||
| Adjusted Net Income Margin | 19 | % | 17 | % | 3 p.p. | 7 | % | 176 | % | 18 | % | 9 | % | 9 p.p. | ||
| Cash Cost (US$/GEO) | 1,146 | 1,149 | -0 | % | 1,080 | 6 | % | – | 1,040 | -100 | % | |||||
| All In Sustaining cost (US$/GEO) | 1,449 | 1,461 | -1 | % | 1,328 | 9 | % | 1,455 | 1,307 | 11 | % | |||||
| Operating Cash Flow | 60,420 | 41,229 | 47 | % | 53,612 | 13 | % | 83,867 | 79,464 | 6 | % | |||||
| Net Debt/LTM EBITDA | 0.8x | 0.9x | -0.1x | 0.8x | 0.0x | 0.8x | 0.8x | 0.0x | ||||||||
| CAPEX | 50,327 | 51,725 | -3 | % | 23,575 | 113 | % | 102,052 | 53,278 | 92 | % | |||||
| 1. Adjusted Net Income of Q1 2025 does not consider deffered taxes over non-monetary items. | ||||||||||||||||
| (US$ mil) | Q2 2025 | Q1 2025 | % | Q2 2024 | % | H1 2025 | H1 2024 | % | ||||||||
| Adjusted EBITDA | 106,224 | 81,479 | 30 | % | 56,172 | 89 | % | 187,703 | 109,398 | 72 | % | |||||
| (+) Exploration Expenses | 1,714 | 1,376 | 25 | % | 2,951 | -42 | % | 3,090 | 4,893 | -37 | % | |||||
| (-) Sustaining Capex | (15,151 | ) | (10,174 | ) | 49 | % | (6,740 | ) | 125 | % | (28,342 | ) | (17,200 | ) | 65 | % |
| (+/-) ∆ Working Capital and Others | 7,024 | (17,996 | ) | n.a. | (8,499 | ) | -183 | % | (12,020 | ) | (23,499 | ) | n.a. | |||
| (-) Income Taxes Paid | (22,570 | ) | (16,874 | ) | 34 | % | (2,136 | ) | 957 | % | (39,444 | ) | (11,434 | ) | 245 | % |
| (-) Lease Payments | (5,122 | ) | (4,239 | ) | 21 | % | (4,273 | ) | 20 | % | (9,361 | ) | (8,680 | ) | 8 | % |
| (-) Realized Losses on Gold Hedges | (11,699 | ) | (6,036 | ) | 94 | % | – | n.a. | (17,759 | ) | – | n.a. | ||||
| Recurring Free Cash Flow | 60,420 | 27,536 | 119 | % | 37,475 | 61 | % | 83,867 | 53,478 | 57 | % | |||||
|
|
||||||||||||||||
| Aranzazu | ||||||||||||||||
| (US$ thousand) | Q2 2025 | Q1 2025 | % | Q2 2024 | % | H1 2025 | H1 2024 | % | ||||||||
| Production at Constant Prices (GEO)¹ | 22,281 | 19,017 | 17 | % | 19,337 | 15 | % | 41,298 | 39,439 | 5 | % | |||||
| Production at Current Prices (GEO) | 22,281 | 20,456 | 9 | % | 24,692 | -10 | % | 42,737 | 49,693 | -14 | % | |||||
| Sales (GEO) | 22,290 | 20,456 | 9 | % | 24,683 | -10 | % | 42,746 | 49,786 | -14 | % | |||||
| Cash Cost (US$/GEO) | 1,110 | 1,164 | -5 | % | 958 | 16 | % | 1,136 | 942 | 21 | % | |||||
| AISC (US$/GEO) | 1,514 | 1,545 | -2 | % | 1,206 | 26 | % | 1,529 | 1,235 | 24 | % | |||||
| Net Revenue | 62,508 | 50,262 | 24 | % | 49,240 | 27 | % | 112,770 | 93,402 | 21 | % | |||||
| Cost of goods sold | (31,021 | ) | (30,282 | ) | 2 | % | (29,266 | ) | 6 | % | (61,303 | ) | (58,130 | ) | 5 | % |
| Gross Profit | 31,487 | 19,980 | 58 | % | 19,974 | 58 | % | 51,467 | 35,272 | 46 | % | |||||
| Expenses | (2,310 | ) | (2,483 | ) | -7 | % | (2,588 | ) | -11 | % | (4,793 | ) | (5,010 | ) | -4 | % |
| G&A | (1,516 | ) | (1,774 | ) | -15 | % | (932 | ) | 63 | % | (3,290 | ) | (2,244 | ) | 47 | % |
| Care & maintenance expenses | – | – | n.a. | – | n.a. | – | – | n.a. | ||||||||
| Exploration expenses | (794 | ) | (709 | ) | 12 | % | (1,656 | ) | -52 | % | (1,503 | ) | (2,766 | ) | -46 | % |
| EBIT | 29,177 | 17,497 | 67 | % | 17,386 | 68 | % | 46,674 | 30,262 | 54 | % | |||||
| Adjusted EBITDA | 35,684 | 24,387 | 46 | % | 23,012 | 55 | % | 60,254 | 41,502 | 45 | % | |||||
| Financial Result | (4,292 | ) | (606 | ) | 608 | % | (832 | ) | 416 | % | (4,898 | ) | (1,675 | ) | 192 | % |
| Financial expenses | (3,762 | ) | (34 | ) | n.a. | (201 | ) | n.a. | (3,796 | ) | (748 | ) | 407 | % | ||
| Other revenue/expenses | (530 | ) | (572 | ) | -7 | % | (631 | ) | -16 | % | (1,102 | ) | (927 | ) | 19 | % |
| EBT | 24,885 | 16,891 | 47 | % | 16,554 | 50.3 | % | 41,776 | 28,587 | 46.1 | % | |||||
| Total taxes | (12,532 | ) | (7,383 | ) | 70 | % | (6,814 | ) | 84 | % | (19,915 | ) | (11,230 | ) | 77 | % |
| Current income tax (expense) | (13,035 | ) | (6,431 | ) | n.a. | (7,796 | ) | 67 | % | (19,466 | ) | (12,291 | ) | 58 | % | |
| Deferred income tax (expense) recovery | 503 | (952 | ) | n.a. | 982 | -49 | % | (449 | ) | 1,061 | n.a. | |||||
| Net Income | 12,353 | 9,508 | 30 | % | 9,740 | 27 | % | 21,861 | 17,357 | 26 | % | |||||
|
|
||||||||||||||||
| EPP | ||||||||||||||||
| (US$ thousand) | Q2 2025 | Q1 2025 | % | Q2 2024 | % | H1 2025 | H1 2024 | % | ||||||||
| Production (GEO) | 8,219 | 8,876 | -7 | % | 9,912 | -17 | % | 17,095 | 22,017 | -22 | % | |||||
| Sales (GEO) | 8,219 | 9,408 | -13 | % | 8,258 | -0 | % | 17,627 | 21,118 | -17 | % | |||||
| Cash Cost (US$/GEO) | 1,168 | 1,228 | -5 | % | 1,252 | -7 | % | 1,200 | 940 | 28 | % | |||||
| AISC (US$/GEO) | 1,751 | 2,041 | -14 | % | 1,958 | -11 | % | 1,906 | 1,500 | 27 | % | |||||
| Net Revenue | 26,711 | 26,353 | 1 | % | 18,992 | 41 | % | 53,064 | 44,999 | 18 | % | |||||
| Cost of goods sold | (14,270 | ) | (15,104 | ) | -6 | % | (15,814 | ) | -10 | % | (29,374 | ) | (31,749 | ) | -7 | % |
| Gross Profit | 12,441 | 11,249 | 11 | % | 3,178 | 291 | % | 23,690 | 13,250 | 79 | % | |||||
| Expenses | (998 | ) | (1,425 | ) | -30 | % | (1,150 | ) | -13 | % | (2,423 | ) | (2,175 | ) | 11 | % |
| G&A | (936 | ) | (1,301 | ) | -28 | % | (1,150 | ) | -19 | % | (2,237 | ) | (2,005 | ) | 12 | % |
| G&A | (936 | ) | (1,301 | ) | -28 | % | (785 | ) | 19 | % | (2,237 | ) | (1,427 | ) | 57 | % |
| Care & maintenance expenses | – | – | n.a. | (243 | ) | n.a. | – | (578 | ) | n.a. | ||||||
| Exploration expenses | (62 | ) | (124 | ) | -50 | % | (122 | ) | -49 | % | (186 | ) | (170 | ) | 9 | % |
| ARO | – | 1,330 | n.a. | – | n.a. | 1,330 | – | n.a. | ||||||||
| EBIT | 11,443 | 9,824 | 16 | % | 2,028 | 464 | % | 21,267 | 11,075 | 92 | % | |||||
| Adjusted EBITDA | 16,151 | 13,516 | 19 | % | 7,541 | 114 | % | 29,697 | 23,046 | 29 | % | |||||
| Financial Result | (1,453 | ) | (6,567 | ) | -78 | % | (2,708 | ) | -46 | % | (8,020 | ) | (6,350 | ) | 26 | % |
| Financial expenses | (1,497 | ) | (6,636 | ) | -77 | % | (2,798 | ) | -46 | % | (8,133 | ) | (6,440 | ) | 26 | % |
| Other revenue/expenses | 44 | 69 | -36 | % | 90 | n.a. | 113 | 90 | 26 | % | ||||||
| EBT | 9,990 | 3,257 | 207 | % | (680 | ) | n.a. | 13,247 | 4,725 | 180 | % | |||||
| Total taxes | (1,211 | ) | 1,342 | n.a. | (2,788 | ) | -57 | % | 131 | (3,507 | ) | n.a. | ||||
| Current income tax (expense) | (862 | ) | (663 | ) | 30 | % | (986 | ) | -13 | % | (1,525 | ) | (1,882 | ) | -19 | % |
| Deferred income tax (expense) recovery | (349 | ) | 2,005 | n.a. | (1,802 | ) | -81 | % | 1,656 | (1,625 | ) | n.a. | ||||
| Net Income | 8,779 | 4,599 | 91 | % | (3,468 | ) | n.a. | 13,378 | 1,218 | 998 | % | |||||
|
|
||||||||||||||||
| San Andres | ||||||||||||||||
| (US$ thousand) | Q2 2025 | Q1 2025 | % | Q2 2024 | % | H1 2025 | H1 2024 | % | ||||||||
| Production (GEO) | 18,039 | 17,654 | 2 | % | 19,142 | -6 | % | 35,693 | 38,328 | -7 | % | |||||
| Sales (GEO) | 17,836 | 17,526 | 2 | % | 19,738 | -10 | % | 35,362 | 38,966 | -9 | % | |||||
| Cash Cost (US$/GEO) | 1,178 | 1,149 | 3 | % | 1,094 | 8 | % | 1,164 | 1,140 | 2 | % | |||||
| AISC (US$/GEO) | 1,292 | 1,249 | 3 | % | 1,159 | 12 | % | 1,271 | 1,223 | 4 | % | |||||
| Net Revenue | 55,776 | 48,062 | 16 | % | 41,962 | 33 | % | 103,838 | 79,609 | 30 | % | |||||
| Cost of goods sold | (22,056 | ) | (21,476 | ) | 3 | % | (23,171 | ) | -5 | % | (43,532 | ) | (47,213 | ) | -8 | % |
| Gross Profit | 33,720 | 26,586 | 27 | % | 18,791 | 79 | % | 60,306 | 32,396 | 86 | % | |||||
| Expenses | (1,430 | ) | (1,371 | ) | 4 | % | (1,242 | ) | 15 | % | (2,801 | ) | (2,392 | ) | 17 | % |
| G&A | (1,166 | ) | (1,135 | ) | 3 | % | (1,242 | ) | -6 | % | (2,301 | ) | (2,391 | ) | -4 | % |
| Care & maintenance expenses | – | – | n.a. | – | n.a. | – | – | n.a. | ||||||||
| Exploration expenses | (264 | ) | (236 | ) | 12 | % | – | n.a. | (500 | ) | (1 | ) | n.a. | |||
| EBIT | 32,290 | 25,215 | 28 | % | 17,549 | 84 | % | 57,505 | 30,004 | 92 | % | |||||
| Adjusted EBITDA | 33,533 | 26,856 | 25 | % | 19,120 | 75 | % | 60,646 | 32,796 | 85 | % | |||||
| Financial Result | (1,189 | ) | (1,556 | ) | -24 | % | (2,064 | ) | -42 | % | (2,745 | ) | (4,426 | ) | -38 | % |
| Financial expenses | (1,442 | ) | (1,312 | ) | 10 | % | (1,661 | ) | -13 | % | (2,754 | ) | (3,836 | ) | -28 | % |
| Other revenue/expenses | 253 | (244 | ) | n.a. | (403 | ) | n.a. | 9 | (590 | ) | n.a. | |||||
| EBT | 31,101 | 23,659 | 31 | % | 15,485 | 101 | % | 54,760 | 25,578 | 114 | % | |||||
| Total taxes | (7,425 | ) | (6,218 | ) | 19 | % | (4,948 | ) | 50 | % | (13,643 | ) | (8,743 | ) | 56 | % |
| Current income tax (expense) | (7,774 | ) | (6,611 | ) | 18 | % | (4,936 | ) | 57 | % | (14,385 | ) | (8,508 | ) | 69 | % |
| Deferred income tax (expense) recovery | 349 | 393 | -11 | % | (12 | ) | n.a. | 742 | (235 | ) | n.a. | |||||
| Net Income | 23,676 | 17,441 | 36 | % | 10,537 | 125 | % | 41,117 | 16,835 | 144 | % | |||||
|
|
||||||||||||||||
| Almas | ||||||||||||||||
| (US$ thousand) | Q2 2025 | Q1 2025 | % | Q2 2024 | % | H1 2025 | H1 2024 | % | ||||||||
| Production (GEO) | 12,917 | 13,101 | -1 | % | 10,580 | 22 | % | 26,018 | 22,475 | 16 | % | |||||
| Sales (GEO) | 12,917 | 13,101 | -1 | % | 10,580 | 22 | % | 26,018 | 22,475 | 16 | % | |||||
| Cash Cost (US$/GEO) | 1,167 | 1,069 | 9 | % | 1,203 | -3 | % | 1,118 | 1,176 | -5 | % | |||||
| AISC (US$/GEO) | 1,364 | 1,195 | 14 | % | 1,434 | -5 | % | 1,279 | 1,428 | -10 | % | |||||
| Net Revenue | 41,751 | 37,127 | 12 | % | 24,217 | 72 | % | 78,878 | 48,479 | 63 | % | |||||
| Cost of goods sold | (18,036 | ) | (16,514 | ) | 9 | % | (14,851 | ) | 21 | % | (34,550 | ) | (31,407 | ) | 10 | % |
| Gross Profit | 23,715 | 20,613 | 15 | % | 9,366 | 153 | % | 44,328 | 17,072 | 160 | % | |||||
| Expenses | (1,898 | ) | (1,040 | ) | 83 | % | (930 | ) | 104 | % | (2,938 | ) | (1,997 | ) | 47 | % |
| G&A | (1,475 | ) | (803 | ) | n.a. | (930 | ) | 59 | % | (2,278 | ) | (1,997 | ) | 14 | % | |
| Care & maintenance expenses | – | – | n.a. | – | n.a. | – | – | n.a. | ||||||||
| Exploration expenses | (423 | ) | (237 | ) | 78 | % | – | n.a. | (660 | ) | – | n.a. | ||||
| EBIT | 21,817 | 19,573 | 11 | % | 8,436 | 159 | % | 41,390 | 15,075 | 175 | % | |||||
| Adjusted EBITDA | 24,709 | 22,205 | 11 | % | 11,019 | 124 | % | 47,136 | 21,062 | 124 | % | |||||
| Financial Result | (4,468 | ) | (3,746 | ) | 19 | % | (3,391 | ) | 32 | % | (8,214 | ) | (4,506 | ) | 82 | % |
| Financial expenses | (4,448 | ) | (3,740 | ) | 19 | % | (3,394 | ) | 31 | % | (8,188 | ) | (4,487 | ) | 82 | % |
| Other revenue/expenses | (20 | ) | (6 | ) | n.a. | 3 | -767 | % | (26 | ) | (19 | ) | n.a. | |||
| EBT | 17,349 | 15,827 | 10 | % | 5,045 | 244 | % | 33,176 | 10,569 | 214 | % | |||||
| Total taxes | (1,226 | ) | (4,757 | ) | -74 | % | (6,404 | ) | -81 | % | (5,983 | ) | (8,317 | ) | n.a. | |
| Current income tax (expense) | (7,101 | ) | (5,998 | ) | 18 | % | (894 | ) | 694 | % | (13,099 | ) | (2,074 | ) | 532 | % |
| Deferred income tax (expense) recovery | 5,875 | 1,241 | 373 | % | (5,510 | ) | n.a. | 7,116 | (6,243 | ) | n.a. | |||||
| Net Income | 16,123 | 11,070 | n.a. | (1,359 | ) | -1286 | % | 27,193 | 2,252 | 1108 | % | |||||
|
|
||||||||||||||||
| Borborema | ||||||||||||||||
| (US$ thousand) | Q2 2025 | H1 2025 | ||||||||||||||
| Production (GEO) | 2,577 | 2,577 | ||||||||||||||
| Sales (GEO) | 1,190 | 1,190 | ||||||||||||||
| Cash Cost (US$/GEO) | 936 | 936 | ||||||||||||||
| AISC (US$/GEO) | 1,441 | 1,441 | ||||||||||||||
| Net Revenue | 3,690 | 3,690 | ||||||||||||||
| Cost of goods sold | (1,114 | ) | (1,114 | ) | ||||||||||||
| Gross Profit | 2,576 | 2,576 | ||||||||||||||
| Expenses | (378 | ) | (378 | ) | ||||||||||||
| G&A | (378 | ) | (378 | ) | ||||||||||||
| Care & maintenance expenses | – | – | ||||||||||||||
| Exploration expenses | – | – | ||||||||||||||
| EBIT | 2,198 | 2,198 | ||||||||||||||
| Adjusted EBITDA | 2,084 | 2,084 | ||||||||||||||
| Financial Result | (4,971 | ) | (4,971 | ) | ||||||||||||
| Financial expenses | (4,982 | ) | (4,982 | ) | ||||||||||||
| Other revenue/expenses | 11 | 11 | ||||||||||||||
| EBT | (2,773 | ) | (2,773 | ) | ||||||||||||
| Total taxes | (309 | ) | (309 | ) | ||||||||||||
| Current income tax (expense) | – | – | ||||||||||||||
| Deferred income tax (expense) recovery | (309 | ) | (309 | ) | ||||||||||||
| Net Income | (3,082 | ) | (3,082 | ) | ||||||||||||
|
|
||||||||||||||||
| (US$ thousand) | Q2 2025 | Q1 2025 | % | Q2 2024 | % | H1 2025 | H1 2024 | % | ||||||||
| Net Revenue | 190,436 | 161,804 | 18 | % | 134,411 | 42 | % | 352,240 | 266,489 | 32 | % | |||||
| Cost of goods sold | (86,497 | ) | (83,376 | ) | 4 | % | (83,103 | ) | 4 | % | (169,873 | ) | (168,500 | ) | 1 | % |
| Cost of production | (44,470 | ) | (44,919 | ) | -1 | % | (36,203 | ) | 23 | % | (89,389 | ) | (75,062 | ) | 19 | % |
| Cost of production – Contractors | (17,529 | ) | (15,467 | ) | 13 | % | (22,356 | ) | -22 | % | (32,996 | ) | (42,380 | ) | -22 | % |
| Change in inventory (cash) | (9,550 | ) | (9,126 | ) | 5 | % | (9,762 | ) | -2 | % | (18,676 | ) | (20,167 | ) | -7 | % |
| Depreciation and amortization | (14,948 | ) | (13,864 | ) | 8 | % | (14,782 | ) | 1 | % | (28,812 | ) | (30,891 | ) | -7 | % |
| Gross Profit | 103,939 | 78,428 | 33 | % | 51,308 | 103 | % | 182,368 | 97,989 | 86 | % | |||||
| Gross Margin | 55 | % | 48 | % | 6 p.p. | 38 | % | 1641 p.p. | 52 | % | 37 | % | 15 p.p. | |||
| (US$ thousand) | Q2 2025 | Q1 2025 | % | Q2 2024 | % | H1 2025 | H1 2024 | % | ||||||||
| Gross Profit | 103,939 | 78,428 | 33 | % | 51,308 | 103 | % | 182,367 | 97,989 | 86 | % | |||||
| Operational Expenses | (12,998 | ) | (11,012 | ) | 18 | % | (10,482 | ) | 24 | % | (24,010 | ) | (20,703 | ) | 16 | % |
| General and administrative expenses | (11,284 | ) | (9,636 | ) | 17 | % | (7,156 | ) | 58 | % | (20,920 | ) | (15,014 | ) | 39 | % |
| Care-and-maintenance expenses | – | – | n.a. | (375 | ) | n.a. | – | (796 | ) | n.a. | ||||||
| Exploration expenses | (1,714 | ) | (1,376 | ) | 25 | % | (2,951 | ) | -42 | % | (3,090 | ) | (4,893 | ) | -37 | % |
| Operating income | 90,941 | 67,416 | 35 | % | 40,826 | 123 | % | 158,357 | 77,286 | 105 | % | |||||
| (US$ thousand) | Q2 2025 | Q1 2025 | % | Q2 2024 | % | H1 2025 | H1 2024 | % | ||||||||
| Operating Income | 90,941 | 67,416 | 35 | % | 40,826 | 123 | % | 158,357 | 77,286 | 105 | % | |||||
| Depreciation and Amortization | 15,283 | 14,063 | 9 | % | 15,346 | -0 | % | 29,346 | 31,553 | -7 | % | |||||
| Ajdusted EBITDA | 106,224 | 81,479 | 30 | % | 56,172 | 89 | % | 187,703 | 109,398 | 72 | % | |||||
| Adjusted EBITDA Margin | 56 | % | 50 | % | 5 p.p. | 42 | % | 14 p.p. | 53 | % | 41 | % | 12 p.p. | |||
| D | ||||||||||||||||
| (US$ thousand) | Q2 2025 | Q1 2025 | % | Q2 2024 | % | H1 2025 | H1 2024 | % | ||||||||
| Income/ (Loss) before income taxes | 31,372 | (54,949 | ) | n.a. | (4,275 | ) | n.a. | (23,577 | ) | (2,504 | ) | 841.6 | % | |||
| Total taxes | (23,225 | ) | (18,300 | ) | 27 | % | (21,500 | ) | 8 | % | (41,525 | ) | (32,488 | ) | 28 | % |
| Current income tax (expense) | (29,551 | ) | (20,814 | ) | -42 | % | (14,612 | ) | 102 | % | (50,365 | ) | (24,755 | ) | 103 | % |
| Deferred income tax (expense) recovery | 6,326 | 2,514 | -152 | % | (6,888 | ) | -192 | % | 8,840 | (7,733 | ) | n.a. | ||||
| Income/(Loss) for the period | 8,147 | (73,249 | ) | n.a. | (25,775 | ) | -132 | % | (65,102 | ) | (34,992 | ) | n.a. | |||
| Net Margin | 4 | % | -45 | % | n.a. | -19 | % | -122 | % | -18 | % | -13 | % | n.a. | ||
| Unrealized loss with derivative gold collars | (24,304 | ) | (100,210 | ) | n.a. | (11,558 | ) | 110 | % | (124,514 | ) | (33,226 | ) | 275 | % | |
| Gain (loss) on foreign exchange | (2,462 | ) | (3,176 | ) | 22 | % | (11,184 | ) | -78 | % | (5,638 | ) | (13,274 | ) | -58 | % |
| Deferred taxes on non-monetary items | 6,847 | 3,234 | n.a. | (12,447 | ) | -155 | % | 10,081 | (11,472 | ) | n.a. | |||||
| Loss on settlement of liability with equity instruments | (8,768 | ) | – | n.a. | – | n.a. | (8,768 | ) | – | n.a. | ||||||
| Adjusted Net Income | 36,834 | 26,903 | 37 | % | 9,414 | 291 | % | 63,738 | 22,980 | 177 | % | |||||
| (US$ thousand) | Q2 2025 | Q1 2025 | % | Q2 2024 | % | H1 2025 | H1 2024 | % | ||||||||
| EBIT | 90,941 | 67,416 | 34.9 | % | 40,826 | 123 | % | 158,357 | 77,286 | 105 | % | |||||
| Financial Result | (59,630 | ) | (121,611 | ) | -51.0 | % | (45,102 | ) | 32 | % | (181,241 | ) | (79,197 | ) | 129 | % |
| Accretion expense | (1,134 | ) | (1,666 | ) | -31.9 | % | (1,573 | ) | -28 | % | (2,800 | ) | (3,106 | ) | -10 | % |
| Lease interest expense | (161 | ) | (1,595 | ) | -89.9 | % | (2,012 | ) | -92 | % | (1,756 | ) | (4,021 | ) | -56 | % |
| Interest expense on debts | (6,098 | ) | (5,755 | ) | 6.0 | % | (4,121 | ) | 48 | % | (11,853 | ) | (8,338 | ) | 42 | % |
| Finance cost on post-employment benefit | (747 | ) | (338 | ) | 121.0 | % | (467 | ) | 60 | % | (1,085 | ) | (834 | ) | 30 | % |
| Unrealized gain (loss) on gold hedges | (24,304 | ) | (100,210 | ) | -75.7 | % | (11,558 | ) | 110 | % | (124,514 | ) | (33,226 | ) | 275 | % |
| Realized gain (loss) on gold hedges | (11,703 | ) | (6,036 | ) | 93.9 | % | – | n.a. | (17,739 | ) | – | n.a. | ||||
| Gain (loss) on other derivative transactions | (1,305 | ) | (1,827 | ) | -28.6 | % | – | n.a. | (3,132 | ) | – | n.a. | ||||
| Change in liability measures at fair value | (4,025 | ) | (2,359 | ) | 70.6 | % | (954 | ) | 322 | % | (6,384 | ) | (3,587 | ) | 78 | % |
| Foreign exchange (gain) loss | (2,462 | ) | (3,176 | ) | -22.5 | % | (11,184 | ) | -78 | % | (5,638 | ) | (13,274 | ) | -58 | % |
| Derivative fee | – | – | n.a. | (13,522 | ) | n.a. | – | (13,522 | ) | n.a. | ||||||
| Loss on settlement of liability with equity instruments | (8,768 | ) | – | n.a. | – | n.a. | (8,768 | ) | – | n.a. | ||||||
| Other finance costs | (297 | ) | (430 | ) | -30.9 | % | (140 | ) | n.a. | (727 | ) | (571 | ) | 27 | % | |
| Interest Income | 1,374 | 1,781 | -22.9 | % | 429 | 220 | % | 3,155 | 1,282 | 146 | % | |||||
| Gain (loss) on derivative transactions | (8,768 | ) | (108,073 | ) | -91.9 | % | (11,558 | ) | -24 | % | (109,378 | ) | (33,226 | ) | 229 | % |
| Other finance costs | (297 | ) | #DIV/0! | #DIV/0! | #DIV/0! | |||||||||||
| Finance Income | (58,256 | ) | (119,830 | ) | -51.4 | % | (44,673 | ) | 30 | % | (178,086 | ) | (77,915 | ) | 129 | % |
| Other gains (losses) | 61 | (754 | ) | n.a. | 1 | n.a. | (693 | ) | (593 | ) | 17 | % | ||||
| Income/ (Loss) before income taxes | 31,372 | (54,949 | ) | n.a. | (4,275 | ) | n.a. | (23,577 | ) | (2,504 | ) | 842 | % | |||
| ENGLISH | |||||||
| (US$ thousand) | Q2 2025 | Q1 2025 | % | Q2 2024 | % | ||
| Short term debts | 78,786 | 100,853 | -22 | % | 98,004 | -20 | % |
| Long term debts | 375,107 | 366,834 | 2 | % | 236,413 | 59 | % |
| Gross debt | 453,893 | 467,687 | -3 | % | 334,417 | 36 | % |
| Cash | 167,938 | 198,066 | -15 | % | 191,963 | -13 | % |
| Restric Cash | – | – | n.a. | – | n.a. | ||
| Almas Debentures Swap | 5,395 | 2,320 | 133 | % | 45 | 11889 | % |
| Net Debt | 280,560 | 271,941 | 3 | % | 142,499 | 97 | % |
| Net Debt/LTM EBITDA | 0.81x | 0.92x | -0.12x | 0.79x | 0.02x | ||
| #N/A | #N/A | #N/A | |||||
| #N/A | #N/A | #N/A | |||||
| Gold equivalent ounces production (‘000 GEO) – 2025 | AISC per equivalent ounce of gold produced – 2025 | Cash Cost per equivalent ounce of gold produced – 2025 | Capex (US$ million) – 2025 | |||||||||||||||||||||||
| Lower Bound | Upper Bound | H1 2025 A | H1 2025 at Guidance metal prices | % | Lower Bound | Upper Bound | H1 2025 A | H1 2025 at Guidance metal prices | % | Lower Bound | Upper Bound | H1 2025 A | H1 2025 at Guidance metal prices | % | Low – 2025 | High – 2025 | H1 2025 A | % | ||||||||
| Aranzazu | 64 | 73 | 36 | 36 | 55% – 49% | Minosa | 1,263 | 1,364 | 1,279 | 1,279 | 101% – 94% | Minosa | 1,108 | 1,219 | 1,178 | 1,178 | 106% – 97% | Sustaining | 40 | 47 | 22 | 55% – 47% | ||||
| Apoena | 29 | 32 | 17 | 17 | 59% – 53% | Apoena | 2,425 | 2,619 | 1,906 | 1,906 | 79% – 73% | Apoena | 1,258 | 1,384 | 1,168 | 1,168 | 93% – 84% | Exploration | 10 | 13 | 6 | 60% – 45% | ||||
| Minosa | 88 | 97 | 43 | 48 | 49% – 44% | Aranzazu | 1,348 | 1,455 | 1,532 | 1,295 | 114% – 105% | Aranzazu | 1,029 | 1,132 | 1,110 | 950 | 108% – 98% | New projects + Expansion | 99 | 106 | 74 | 75% – 70% | ||||
| Almas | 51 | 58 | 26 | 26 | 51% – 45% | Almas | 1,113 | 1,202 | 1,279 | 1,279 | 115% – 106% | Almas | 1,013 | 1,114 | 1,167 | 1,167 | 115% – 105% | Total | 149 | 167 | 102 | 61% – 68% | ||||
| Total ex-Borborema | 233 | 260 | 122 | 127 | 52% – 47% | Borborema | 1,113 | 1,304 | 1,186 | 1,186 | 107% – 91% | Borborema | 1,084 | 1,232 | 936 | 936 | 86% – 76% | |||||||||
| Borborema | 33 | 40 | 3 | 3 | 8% – 6% | Total | 1,374 | 1,492 | 1,456 | 1,367 | 98% – 106% | Total | 1,078 | 1,191 | 1,146 | 1,080 | 96% – 106% | |||||||||
| Total | 266 | 300 | 124 | 129 | 47% – 41% | |||||||||||||||||||||
| Fluxo de Caixa Gerencial | ||||||||||||
| (US$ thousand) | Q2 2025 | Q1 2025 | Q2 2024 | H1 2025 | H2 2025 | % | ||||||
| Cash flows from operating activities | ||||||||||||
| Income/(Loss) for the period | 8,147 | (73,249 | ) | (25,775 | ) | (65,102 | ) | (34,992 | ) | 86.0 | % | |
| Items not affecting cash | 82,263 | 155,569 | 69,846 | 237,832 | 132,015 | 80.2 | % | |||||
| Changes in working capital | 3,372 | (14,135 | ) | 638 | (10,764 | ) | (17,133 | ) | -37.2 | % | ||
| Taxes paid | (22,570 | ) | (16,874 | ) | (2,136 | ) | (39,444 | ) | (11,434 | ) | 245.0 | % |
| Other assets and liabilities | 8,653 | (10,082 | ) | 11,038 | (1,429 | ) | 11,007 | -113.0 | % | |||
| Net cash generated by operating activities | 79,864 | 41,229 | 53,612 | 121,093 | 79,464 | 52 | % | |||||
| Cash flows from investing activities | ||||||||||||
| Purchase of property, plant and equipment, and other investments | (50,325 | ) | (51,725 | ) | (23,575 | ) | (102,051 | ) | (53,278 | ) | 91.5 | % |
| Short term investments | – | – | 1,314 | – | – | 0.0 | % | |||||
| Proceeds on sale of plant and equipment | – | – | – | – | – | 0.0 | % | |||||
| Acquision of investment – Big River Gold | – | – | – | – | – | 0.0 | % | |||||
| Bluestone | – | (1,244 | ) | – | (1,244 | ) | – | |||||
| Acquisition of investment – Altamira Gold Corp | (439 | ) | – | – | – | – | 0.0 | % | ||||
| Cash impact from acqusition included into consolidation | – | – | – | – | – | |||||||
| Net cash generated by investing activities | (50,764 | ) | (52,969 | ) | (22,261 | ) | (102,051 | ) | (53,278 | ) | 92 | % |
| Cash flows from financing activities | ||||||||||||
| Proceeds received from loans and debentures | – | – | 19,000 | – | 34,000 | -100.0 | % | |||||
| Repayment of loans and debentures | (9,147 | ) | (11,455 | ) | (9,520 | ) | (20,602 | ) | (23,312 | ) | ||
| Derivative settlement- debt swap agreements | 2,582 | – | – | 2,582 | 2,868 | 90.0 | % | |||||
| Derivative fee | – | – | (13,522 | ) | – | (13,522 | ) | -65.3 | % | |||
| Interest paid on loans and debentures | (13,397 | ) | (7,775 | ) | (4,096 | ) | (21,172 | ) | (17,698 | ) | ||
| Payment of liability (NSR agreement) | (853 | ) | (741 | ) | (1,136 | ) | (1,594 | ) | (1,210 | ) | -11.6 | % |
| Principal and interest payments of lease liabilities | (5,122 | ) | (4,239 | ) | (4,273 | ) | (9,361 | ) | (8,680 | ) | 19.0 | % |
| Repayment of other liabilities | – | (981 | ) | – | (981 | ) | (825 | ) | 7.8 | % | ||
| Payment of dividends | (29,811 | ) | (18,333 | ) | (25,339 | ) | (48,144 | ) | (25,339 | ) | 19.6 | % |
| Proceeds from exercise of stock options | – | – | 100 | – | 100 | |||||||
| Acquisition of treasury shares | – | (1,200 | ) | (3,458 | ) | (1,200 | ) | (3,458 | ) | |||
| Net cash generated by financing activities | (55,748 | ) | (44,724 | ) | (42,244 | ) | (100,472 | ) | (57,176 | ) | 76 | % |
| Increase (decrease) in cash and cash equivalents | (26,648 | ) | (56,465 | ) | (10,893 | ) | (81,429 | ) | (30,891 | ) | 163.6 | % |
| Effect of foreign exchange gain (loss) on cash equivalents | (3,480 | ) | 1,635 | (11,210 | ) | (1,845 | ) | (14,442 | ) | -87.2 | % | |
| Cash and cash equivalents, beginning of the period | 495,931 | 270,188 | 214,067 | 270,189 | 237,295 | 13.9 | % | |||||
| Per balance sheet at the end of comparative period | 465,804 | 215,359 | 191,962 | 186,915 | 191,962 | -3 | % | |||||
Goliath Resources Limited (TSX-V: GOT) (OTCQX: GOTRF) (Frankfurt:... READ MORE
Critical Metals Corp. (Nasdaq: CRML) a leading critical minerals ... READ MORE
Greenridge Exploration Inc. (CSE: GXP) (FRA: HW3) (OTCQB: GXPLF),... READ MORE
Brixton Metals Corporation (TSX-V: BBB) (OTCQB: BBBXF) is pleased... READ MORE
Uranium Sales at $101 per Pound – Demonstrating the Strengt... READ MORE


