


| Copper Price
Assumption |
Base Case
$4.25/lb Cu |
COMEX Assumed Spot Pricing
$5.00/lb Cu1 |
| NPV8% (after-tax) | $2,301 | $3,343 |
| IRR (after-tax) | 22.8% | 28.7% |
| Payback (after-tax) | 5.3 years | 4.5 years |
| Initial Capital Expenditures | $977 million | $977 million |
| NPV:CAPEX Ratio | 2.4:1 | 3.4:1 |
| LoM Gross Revenue | $16,948 million | $19,939 million |
| LoM FCF (unlevered after-tax) | $7,162 million | $9,451 million |
| _________________________ |
| 1 $5.02/lb Copper – 5-day COMEX spot average |
| 2 Non-IFRS Financial Measure. See “Non-IFRS Financial Measures” below. |
Arizona Sonoran Copper Company Inc. (TSX:ASCU) (OTCQX:ASCUF) announces the exceptional results from an NI 43-101 Pre-Feasibility Study on its 100%-owned brownfield Cactus Project in Pinal County, Arizona. The PFS outlines a long-life, economically viable copper conventional operation utilizing open pit mining and heap leach-SXEW processing to produce LME Grade A copper cathode onsite for a meaningful contribution to refined copper supply in the U.S.A. All dollar amounts referenced herein are U.S. dollars, and all references to tons are imperial or short tons, unless otherwise noted; 1 short ton equals approximately 0.91 metric tonnes.
TABLE 1: Summary of Key Metrics At $4.25/Lb Cu PFS Base Case
| Valuation Metrics | Unit | |
| NPV8% (pre-tax) | $ millions | 3,244 |
| NPV8% (after-tax) | $ millions | 2,301 |
| Internal Rate of Return (after-tax) | % | 22.8 |
| Payback Period (after-tax) | # years | 5.3 |
| LoM Revenues | $ millions | 16,948 |
| LoM EBITDA* | $ millions | 11,805 |
| LoM FCF* (unlevered) after tax | $ millions | 7,162 |
| Project Metrics (Imperial) Life of Mine | ||
| Construction Period | # months | 24 |
| Operational Life of Project(1) | # years | 22 |
| Strip Ratio | Waste:Feed | 3.3:1 |
| Ore Mined | ktons | 512,859 |
| Copper Reserve Grade | % CuT | 0.52 |
| Annual Crusher Throughput | million tons | 28 |
| Recoveries | % CuT | 75 |
| Recovered Copper Cathode | K lbs | 3,987,794 |
| Annual Copper Production(1) | 000 tons
millions lbs |
99
198 |
| Project Years 1-10 (average annual) | ||
| Copper Production
|
000 tons
millions lbs |
113
226 |
| Revenue | $ million/yr | 962 |
| FCF (unlevered) after-tax | $ million/yr | 381 |
| Costs | ||
| Cash Cost (C1)* | $/lb Cu | 1.34 |
| All-in Sustaining Cost (AISC)* | $/lb Cu | 1.62 |
| All in Cost (AIC)* | $/lb Cu | 2.01 |
| Initial Capital (including contingency) | $ millions | 977 |
| Sustaining Capital | $ millions | 1,327 |
Notes:
*Non-IFRS financial measure; see “Non-IFRS Financial Measures”. Project operating costs include mine operating, process plant operating, and general and administrative costs (“G&A”). Total production costs include royalty expense. The AISC additionally includes initial Capex, sustaining Capex, reclamation & closure. AIC additionally includes taxes and initial capital.
(1) Life-of-mine excludes years 21 and 22, during which operations consist solely of SXEW processing
Bernie Loyer, ASCU SVP Projects commented, “The work product of this recent study validates the investment of optimizing the Parks/Salyer mine plan both in terms of production cadence and ore quality. That optimization has resulted in higher grade material being placed sooner in the execution plan and produces a much more consistent copper production profile, generating superior cash flows as compared to the 2024 PEA. Building on the benefits first highlighted by the 2024 PEA, including the impact of the MainSpring land acquisition to the overall Parks/Salyer mine plan and the comprehensive available infrastructure, a solid foundation with a defined and compelling plan of operations emerges in sharp focus. That plan in combination with a supportive local community, a proven project team on deck, and the Cactus Project being fully positioned on private land, sets an impressive stage for the next step in this incredible journey to deliver a future long-term source of copper cathode produced in the USA.”
George Ogilvie, ASCU President and CEO, commented, “This PFS is a major milestone in the advancement of our lower risk open pit Cactus Project towards a final investment decision as early as Q4 2026. We believe we are developing a world-class copper cathode project, within Casa Grande’s copper district. Looking forward, Cactus is a project capable of plating an average of 103,000 tonnes of copper cathodes annually in the first 10 years of the mine, available for direct shipment into the American supply chain. We have the opportunity to become a significant player in the American copper industry, filling a clear gap in the domestic copper supply. An industry leading capital intensity of $10,894 per tonne and an NPV:CAPEX ratio of 2.4:1 sets our project apart as having highly compelling economics, with the potential to be shovel-ready towards the end of 2026. We anticipate production of first copper cathodes in 2H 2029.
I am proud of the organic project growth since our IPO in 2021, through adjacent land acquisitions and drilling, defining a significant copper deposit. Today, the land position has increased by 320% and mineral resources have grown by over 580% in the M&I category, with the after-tax NPV8 of the Cactus Project having reached a substantial $2.3 billion. Cactus is among the highest quality copper development projects globally in terms of lower risks, size, scale and capital intensity.
We now embark on three key workstreams towards a final investment decision, including a definitive feasibility study, obtaining permit amendments and project financing. Each workstream has begun and is being led by experienced team leaders. We are keen to continue advancing our standout brownfield copper asset in a tier 1 location.”
Key PFS Advancements
Operations:
Economics:
Mining and Processing Costs:
The Company intends to file a technical report in respect of the PFS in accordance with National Instrument 43-101 – Standards of Disclosure for Mineral Projects on SEDAR+ (www.sedarplus.ca) under the Company’s issuer profile and the Company’s website within 45 days of this press release.
Pre-feasibility Study Summary
The capital cost estimates for this PFS were developed with a -/+20% accuracy and an estimated development contingency of 18% for plant and site and 5% mining equipment, according to the Association of the Advancement of Cost Engineering International (AACE) Class 4 estimate requirements. The estimates include the cost to complete the design, engineering, procurement, construction, and commissioning of all process plant facilities. The Company expects to produce LME Grade A copper cathodes directly onsite.
The mine plan establishes onsite copper cathode production from conventional heap leach and SXEW processing of the oxide and enriched material. Mine operations are expected to use conventional truck and shovel and two-stage crushing. Truck loading of the heap leach pad in the first three years then pivoting to conventional stacking. The tank house will start with a 70,000 ton per year facility with the addition of a second facility of same size, ready for use between years three and four. Production from the heap will reach 140,000 tons per year from year five. Average annual cathode production for the first 10 years is expected to be 113,000 tons. A total of 2,210 million tons is expected to be mined (waste + ore), including a total of 513 million tons processed, resulting in the recovery of 3,988 million pounds or 1,994,000 tons of copper cathodes over the LoM.
Feed to the heap leach pad will be oxide and enriched ore from the Parks/Salyer and Cactus West open pits.
TABLE 2: PFS Sensitivities to the Copper Price
| Revenue, NPV8% and IRR Sensitivity Based on Copper Price | |||||
| Metal
Price |
Copper
Price |
Revenue
(US$000) |
Pre-tax NPV8%
(US$000) |
After-tax NPV8%
(US$000) |
After-tax IRR
(%) |
| Base
Case(1) |
$4.25 | $16,948,123 | $3,243,942 | $2,301,317 | 22.8% |
| 20%(2) | $5.10 | $20,337,747 | $4,741,010 | $3,480,922 | 29.4% |
| 10% | $4.68 | $18,642,935 | $3,992,476 | $2,892,400 | 26.2% |
| -10% | $3.83 | $15,253,310 | $2,495,409 | $1,709,602 | 19.2% |
| -20% | $3.40 | $13,558,498 | $1,746,875 | $1,112,191 | 15.5% |
(1) No COMEX premium applied to the Base Case study
(2) COMEX Spot pricing assumed at $5.00
Conventional Mining and Processing Operations
For the PFS, the basis of the design for material handling equipment is forecasted at an annual operating throughput of 28,000,000 dry tons of ore per year placed on the heap leach pad. The Parks/Salyer and Cactus West open pits will provide ore feed to the leach pad from year 1 through year 20 at variable rates not less than an estimated 18 million tons and not more than 28 million tons per annum. Crushing rates are variable to accommodate constraints in the electrowinning circuit and avoid building large inventories on the leach pad. The mining sequence has been designed to balance stripping requirements under this constraint for efficient plant operations.
The Cactus Project process plant will consist of a two-stage crushing and screening plant ahead of heap leach. The pregnant leach solution (PLS) will be processed in a solvent extraction (SX) and electrowinning (EW) plant. The SXEW plant process design will include three extraction settlers, one strip settler, a tank house, and initial electrowinning cathode capacity of 70,000 tons per year followed by an expansion that would double capacity to 140,000 tons per year between years three and four.
A total of 1,839.6 million tons of material is projected to be mined from the Parks/Salyer pit, including 373.8 million tons of proven and probable mineral reserve leach ore at a 0.59% total copper grade and a strip ratio of 3.9:1. A total of 368.9 Mt of material is projected to be mined from the Cactus West pit, including 139.1 Mt of proven and probable mineral reserve leach ore at a 0.33% total copper grade and a strip ratio of 1.7:1. The LoM strip ratio is 3.3:1 combined.
The Parks/Salyer open pit is planned to be mined in seven phases (0-6), while the Cactus West open pit is planned to be mined in two phases (1-2). The detailed designs for the Parks/Salyer and Cactus West open pits are based on wall slope parameters received from Call and Nicholas Inc. (CNI) in June 2025. Equipment sizing for ramps and working benches are based on the use of 320-ton rigid frame trucks. The road width design is 140 feet (42.6 m) with a maximum ramp gradient of 10%. Working benches are designed at 40 feet (12.2 m) with placement of safety berms of variable width on every bench. Geotechnical berms of varying width will be used in places to reduce overall slope angles in Parks/Salyer to approximately 40 degrees, when this is not accomplished with ramp widths alone.
Copper cathodes will be produced directly onsite via heap leach and SXEW, including a three-year ramp up period. The Cactus heap leaching process design includes crushing of all material types to a minus 3/4” P80 size for leaching. All material types will be leached on a single pad with an initial leaching cycle of 180 days. Three 180-day leach cycles have been assumed over a three-year period, as the practical limit for effective recovery based on experience and hydrodynamic analysis of the materials by HydroGeoSense, an independent consultant. Gross acid usage is estimated to be 18.5 lbs per ton and net acid usage of 7.0 pounds per ton at a cost of $160 per ton.
A 95% heap efficiency factor has been applied to relate column tests to operational heap copper extractions. This allows for inefficiencies in the heap operations. The recommended copper recovery projections include this heap efficiency factor.
In an effort to focus on higher quality ore tons, the existing Stockpile has been removed from the mine plan and will be screened for use of over liner on the leach pads. Cactus East and primary sulphides, excepting those extracted while targeting oxides and enriched materials, have also been removed from the mine plan, in favour of future optimization opportunities.
Average annual water consumption is planned at approximately 2,050 gallons per minute, the equivalent of 3,300 acre feet per year, well within ASCU’s permitted 3,736 acre feet per year industrial use allocation, using in-place onsite wells.
Costs and Economics
The estimated total LoM costs, operating costs per ton ($/ton) of processed material, and dollars per pound ($/lb) of cathode produced are summarized in the three tables below. Project operating costs include mine operating, process plant operating, and general and administrative costs. Total production costs include the royalty expense. The AISC additionally includes sustaining capital expenditures, reclamation & closure, while AIC further includes initial capital expenditures, property and severance taxes.
Mining operating cost estimates, prepared by AGP Mining Consultants Inc., are based on Company-managed mining activities using an owner-operator model. Process operating cost estimates were prepared by M3 Engineering and G&A cost estimates were prepared by M3 Engineering with input from ASCU, as summarized in TABLES 3-5 below (note numbers may not add due to rounding). Sequence of operations and annual cash flow estimates are detailed in Exhibit 1 and 2, at the end of this press release.
TABLE 3: LoM Operating and Production Costs Estimates
| TABLE 3: LoM OPERATING AND PRODUCTION COSTS | ||||
| Cost Elements | LoM (US$) | |||
| Total Cost
(US$M) |
US$ / ton
Processed |
US$ / tonne
Processed |
US$ / lb
Copper |
|
| Mine Operating Cost | $3,518 | $6.86 | $7.56 | $0.88 |
| Process Plant Operating Cost | $1,297 | $2.53 | $2.79 | $0.33 |
| General & Administration | $205 | $0.40 | $0.44 | $0.05 |
| Operating Costs | $5,021 | $9.79 | $10.79 | $1.26 |
| Royalties | $324 | $0.63 | $0.70 | $0.08 |
| Total Production Costs (C1)1 | $5,344 | $10.42 | $11.49 | $1.34 |
| Sustaining Capex | $1,327 | $2.59 | $2.85 | $0.33 |
| Reclamation & Closure | $25 | $0.05 | $0.05 | $0.01 |
| Salvage | ($226) | ($0.44) | ($0.49) | ($0.06) |
| All-In Sustaining Costs1 | $6,471 | $12.62 | $13.91 | $1.62 |
| Property & Severance Taxes | $579 | $1.13 | $1.25 | $0.15 |
| Initial Capex (non-sustaining) | $977 | $1.90 | $2.10 | $0.24 |
| All-In Costs1 | $8,027 | $15.65 | $17.25 | $2.01 |
TABLE 4: LoM Operating Cost and Cash Flow Estimates
| TABLE 4: LoM OPERATING COST AND CASH FLOW | ||
| ACTIVITY | US$M | US$ / ton Processed |
| LOM REVENUE | 16,948 | – |
| Mining | 3,518 | 6.86 |
| Process Plant | 1,297 | 2.53 |
| General & Administration | 205 | 0.40 |
| Total Cash Operating Cost | 5,021 | 9.79 |
| Royalties | 324 | 0.63 |
| Salvage Value | (226) | (0.44) |
| Reclamation & Closure | 25 | 0.05 |
| Total Production Cost | 5,144 | 10.03 |
| EBITDA | 11,805 | – |
| Total CAPEX1 | 2,304 | 4.49 |
| Net Income Before Taxes | 9,500 | – |
| Taxes | 2,338 | 4.56 |
| After-tax free Cash Flow (unlevered) | 7,162 | – |
TABLE 5: Capital Cost Estimates
| TABLE 5: CAPITAL COST ESTIMATES | ||||
| AREA | DETAIL | INITIAL
CAPEX (US$000’s) |
SUSTAINING
CAPEX (US$000’s) |
TOTAL
CAPEX (US$000’s) |
| Direct Costs | Mine Costs | 224,294 | 546,407 | 770,701 |
| Process Plant | 335,651 | 532,958 | 868,609 | |
| Infrastructure | 123,425 | 36,275 | 159,700 | |
| Indirect Costs | 149,676 | 44,891 | 194,567 | |
| Owner’s Costs | 24,137 | – | 24,137 | |
| Land | 10,000 | 82,152 | 92,152 | |
| Total CAPEX without Contingency | 867,183 | 1,242,683 | 2,109,866 | |
| Contingency | 109,794 | 84,605 | 194,399 | |
| Total CAPEX with Contingency | 976,977 | 1,327,288 | 2,304,265 | |
Geology
The Cactus Project is host to a large porphyry copper system that has been dismembered and displaced by Tertiary extensional faulting. The major host rocks are Precambrian Oracle Granite and Laramide monzonite porphyry and quartz monzonite porphyry. The mine trend features the formation of horst and graben blocks of mineralization where the Cactus deposits are situated, extending from the Cactus East deposit, southwest to the Parks/Salyer deposit. Drilling to the northeast and southwest along the trend indicates that mineralization continues in both directions and at depth at the Cactus West deposit.
Mineral reserve estimates are derived from the Measured and Indicated mineral resource estimate prepared by ALS Geo Resources (see Company’s press release dated SEPT 16, 2025). Measured and Indicated mineral resources were converted to Proven and Probable mineral reserves based on design guidelines and applicable modifying factors and are shown in TABLE 6, TABLE 7, and illustrated in FIGURE 4 below. For more details relating to the 2025 mineral resource estimate, please refer to the press release dated September 16, 2025, a copy of which is available on SEDAR+ (www.sedarplus.ca) under the Company’s issuer profile and the Company’s website (www.arizonasonoran.com).
TABLE 6: Cactus Project Mineral Reserve Estimates
| Material
Type |
Tons
kt |
Grade
CuT % |
Grade
Cu Tsol % |
Contained
Total Cu (k lbs) |
Contained
Cu Tsol (k lbs) |
Contained
Total Cu Short Tons |
Contained
Total Cu Tonnes |
| Proven | |||||||
| Cactus West Open Pit | 21,201 | 0.30 | 0.19 | 129,158 | 81,327 | 64,579 | 58,585 |
| Parks/Salyer Open Pit | 43,055 | 1.03 | 0.87 | 890,055 | 747,217 | 445,028 | 403,723 |
| Total Proven | 64,256 | 0.79 | 0.64 | 1,019,213 | 828,544 | 509,606 | 462,308 |
| Probable | |||||||
| Cactus West Open Pit | 117,903 | 0.33 | 0.20 | 778,312 | 475,530 | 389,156 | 353,037 |
| Parks/Salyer Open Pit | 330,700 | 0.53 | 0.46 | 3,506,361 | 3,035,919 | 1,753,181 | 1,590,461 |
| Total Probable | 448,603 | 0.48 | 0.39 | 4,284,673 | 3,511,449 | 2,142,337 | 1,943,497 |
| Proven + Probable | |||||||
| Cactus West Open Pit | 139,104 | 0.33 | 0.20 | 907,470 | 556,857 | 453,735 | 411,622 |
| Parks/Salyer Open Pit | 373,755 | 0.59 | 0.51 | 4,396,417 | 3,783,136 | 2,198,208 | 1,994,183 |
| Total Proven + Probable | 512,859 | 0.52 | 0.42 | 5,303,886 | 4,339,993 | 2,651,943 | 2,405,805 |
NOTES:
TABLE 7: Cactus Project Mineral Resource Estimates
| Material
Type |
Tons
kt |
Grade
CuT % |
Grade
Cu Tsol % |
Contained
Total Cu (k lbs) |
Contained
Cu Tsol (k lbs) |
Contained
Total Cu Short Tons |
Contained
Total Cu Tonnes |
| Total Leachable | 101,500 | 0.91 | 0.79 | 1,853,400 | 1,605,800 | 926,700 | 840,700 |
| Total Primary | 29,900 | 0.42 | 0.05 | 251,000 | 30,200 | 125,500 | 113,800 |
| Total Measured | 131,400 | 0.80 | 0.62 | 2,104,400 | 1,636,000 | 1,052,200 | 954,500 |
| Total Leachable | 658,000 | 0.48 | 0.42 | 6,354,900 | 5,580,200 | 3,177,400 | 2,882,500 |
| Total Primary | 353,400 | 0.36 | 0.04 | 2,535,900 | 270,900 | 1,268,000 | 1,150,300 |
| Total Indicated | 1,011,400 | 0.44 | 0.29 | 8,890,800 | 5,851,100 | 4,445,400 | 4,032,800 |
| Total Leachable | 759,500 | 0.54 | 0.47 | 8,208,300 | 7,186,000 | 4,104,200 | 3,723,200 |
| Total Primary | 383,200 | 0.36 | 0.04 | 2,786,900 | 301,100 | 1,393,400 | 1,264,100 |
| Total M&I | 1,142,800 | 0.48 | 0.33 | 10,995,200 | 7,487,100 | 5,497,600 | 4,987,300 |
| Total Leachable | 95,100 | 0.40 | 0.34 | 760,900 | 653,400 | 380,500 | 345,200 |
| Total Primary | 138,400 | 0.34 | 0.04 | 947,100 | 121,500 | 473,600 | 429,600 |
| Total Inferred | 233,400 | 0.37 | 0.17 | 1,708,100 | 774,900 | 854,100 | 774,800 |
NOTES:
Metallurgy
Metallurgical testwork used for the PFS shows good metallurgical recoveries from all deposits with no deleterious elements. Testing, including 20 additional columns, in the PFS shows an average of 75% of total copper extracted inclusive of heap efficiency factor of 95%. A column leach testing program for oxides and enriched sulphides, from Parks/Salyer and Cactus, is ongoing at BaseMet and McClelland labs (Tucson, AZ and Reno, NV, respectively).
Mine waste is primarily alluvium and Gila conglomerate with minimal acid generation potential and a high neutralization potential. As a result, the mine waste reclamation efforts will be streamlined.
Project Location and Infrastructure
The Cactus Project is a brownfield project located approximately 6 miles (10 kilometres) northwest of the city of Casa Grande and 40 road miles south-southwest of the Greater Phoenix metropolitan area in Arizona. The Greater Phoenix area is a major population centre (approximately 4.8 million people) with a major airport and transportation hub and well-developed infrastructure and services that support the mining industry. The Cactus Project is directly accessible by state highways and connected to interstate highway 10. During historic ASARCO operations (1974-1984), a rail spur was connected directly with the Union Pacific Railroad to ship concentrates to its El Paso refinery in Texas; while the spur has been removed, the onsite rail line is still in existence. Current onsite infrastructure includes power lines and substation, water wells and a water pond, geological buildings, core sheds and administrative offices, contributing to a low capital intensity and robust economics.
Current onsite and nearby infrastructure includes:
The Cactus Project will require the onsite facilities listed below, with no offsite infrastructure needed:
Permitting and Social License
The Cactus Project is 100% owned by ASCU through its wholly-owned subsidiary Cactus 110 LLC, and encompasses an area of approximately 7,843 acres. The Cactus Project includes exploration and mining on private land and Arizona State Land Department (“ASLD”) leases. There is no federal nexus for permitting the Cactus Project and all permitting is limited to State and local required permits including the Aquifer Protection Permit, Industrial Air permits and the Mined Land Reclamation Permit, each of which ASCU has already received from regulators pertaining to the 2021 PEA. Permitting amendments will be submitted to address changes in the mine plan presented in this PFS, with an expected completion date in 2H 2026.
In keeping with ASCU’s community engagement and partnership standards, the Cactus Project will be developed with a plan to establish and maintain the support of its host communities. ASCU commenced community outreach at the earliest stages of the Project and is currently evaluating and building partnerships within the community. ASCU understands the importance of outreach during its development and throughout the life of the mine. ASCU is encouraged by the positive response to the project from the community. Its status as a “brownfields” project makes it potentially more appealing than a new mine might be.
ASCU has a well-developed community engagement plan that it has implemented through numerous public meetings and outreach. With the presence of legacy mining in the Casa Grande area, the local community is supportive of the Cactus Project. There is no known significant opposition to the Cactus Project.
Royalties
The Cactus Project mineral reserves are subject to three net smelter return royalties that apply to approximately 78% of all ore tons in the PFS mine plan. The MainSpring property, hosting part of the Parks/Salyer deposit, is not subject to any royalties. The Royal Gold and Elemental Altus NSR royalties that apply to Cactus West and a portion of Parks/Salyer total 2.54%. On a portion of the Parks/Salyer deposit, Bronco Creek Exploration Inc. holds a 0.5% NSR royalty, and ASLD holds a sliding royalty (2.0% to 8.0% and estimated at 2%), payable to the Arizona State Trust. Royalty percentages with ASLD will be formalized once the Cactus Project submits a Mineral Development Report to ASLD for conversion of the existing Mineral Exploration Permit to a Mineral Lease.
Project Financing
ASCU appointed Hannam & Partners in June 2025, to assist the Company with securing the debt project financing for the Cactus Project. The Company and H&P are well underway in the process and advancing discussions with tier 1 lenders in the mining space. With an interest in obtaining low cost of capital debt for the Cactus Project, the Company began well ahead of the PFS completion, and in anticipation of a targeted financing completion date as early as the second half of 2026.
“Our financing strategy will focus on minimizing dilution and optimizing the Cactus Project’s strong cash generation potential,” said Nick Nikolakakis, ASCU CFO. “With the PFS confirming the financial strength of the Cactus Project, we have begun the process of engaging with a range of banks, private lenders and export-credit agencies to support a disciplined and capital efficient path to construction.”
Opportunities and Next Steps
The Cactus Project is reviewing several stand-alone opportunities for further optimization of the operation, including:
The Technology is currently being tested at Nuton’s technical facilities as a parallel, separate optimization study on the Cactus Project. Various test applications and results have demonstrated that for certain material types under optimum conditions the Nuton Technology can achieve more than 80% copper extraction from primary copper minerals, such as chalcopyrite. If ongoing testing demonstrates the efficacy of the Technology with potential for economic leaching of primary sulphide copper mineralization, incorporation of such technology could improve overall Cactus Project economics.
Studies are ongoing to demonstrate the efficacy and viability of the Nuton Technology at the Cactus Project. If successful and the Technology is available for deployment at the Cactus Project on terms amenable to the Company, mine plan optimization for Nuton and relatively minor plant design modifications would be required to implement the Nuton Technology at the Cactus Project. The testing (including related studies) and any deployment of the Nuton Technology at the Cactus Project are subject to the terms of the option to joint venture agreement between Nuton and the Company’s wholly-owned subsidiaries, Cactus 110 LLC and Arizona Sonoran Copper Company USA Inc., dated December 14, 2023 (as amended), as more particularly described in the Company’s Annual Information Form dated March 27, 2025, available under the Company’s issuer profile on SEDAR+ (www.sedarplus.ca) and the Company’s website (www.arizonasonoran.com).
Quality Assurance and Quality Control Procedures
Skyline Labs is accredited in accordance with the recognized International Standard ISO/IEC 17025:2005. Their quality management system has been certified as conforming to the requirements defined in the International Standard ISO 9001:2015. The standard operating procedure (SOP) used while processing the ASCU samples was to process samples in groups of 20. Each tray consisted of 18 samples with samples No. 1 and No. 10 repeated as duplicates. The results from each tray were analyzed and any variance in the duplicates of more than 3% would result in the entire tray being re-assayed.
The results of these analyses, including the QA/QC checks, were transmitted to a qualified team of individuals at ASCU and the qualified persons.
Qualified Persons
Each of the persons listed below are authors of the PFS and have reviewed and verified the scientific and technical information contained in this press release as it relates to their respective specified areas of responsibility. By virtue of their education, experience and professional association membership, each of the below listed persons are considered “qualified person” as defined by NI 43-101.
Project Management, Roger Rivers, PE, M3 Engineering
Metallurgy, Laurie Tahija, QP-MMSA, M3 Engineering
Mineral Resources, Allan L. Schappert, CPG, SME-RM, ALS GeoResources LLC
Water and Environmental, R. Douglas Bartlett, CPG, PG. Clear Creek Associates, a subsidiary of Geo-Logic Associates
Mine Planning, Gordon Zurowski, P.Eng., AGP Mining Consultants Inc.
Nuton® Technology, Jim Sorensen, FAusIMM, Samuel Engineering
Links from the Press Release:
October 21, 2025 Webinar @ 1:00 pm ET: https://www.bigmarker.com/vid-conferences/arizona-sonoran-update
September 16, 2025: https://arizonasonoran.com/news-releases/arizona-sonoran-reports-11-billion-pounds-of-contained-copper-in-updated-cactus-mineral-resource-estimate-in-the-measured-and/
SEDAR+: https://www.sedarplus.ca
About Arizona Sonoran Copper Company
ASCU’s objective is to become a mid-tier copper producer with low operating costs and to develop the Cactus and Parks/Salyer Projects that could generate robust returns for investors and provide a long term sustainable and responsible operation for the community and all stakeholders. The Company’s principal asset is a 100% interest in the Cactus Project (former ASARCO, Sacaton mine) which is situated on private land in an infrastructure-rich area of Arizona. Contiguous to the Cactus Project is the Company’s 100%-owned Parks/Salyer deposit that could allow for a phased expansion of the Cactus Project once it becomes a producing asset. The Company is led by an executive management team and Board which have a long-standing track record of successful project delivery in North America complemented by global capital markets expertise.
Exhibit A: Annual Production, Recovery and Costs
| Years | Production Tons (000’s) | Recovered
Copper |
Costs ($lb)1 | ||||||
| Tons Mined | Parks/Salyer
Processed |
Cactus
Processed |
Total Tons
Processed |
% TCu | Tons | klbs | C1
Cost1 |
AISC1 | |
| 1 | 170,000 | 28,000 | – | 28,000 | 0.286 | 38,354 | 76,708 | $4.42 | $9.17 |
| 2 | 175,000 | 28,000 | – | 28,000 | 0.324 | 67,005 | 134,009 | $2.63 | $5.40 |
| 3 | 169,000 | 28,000 | – | 28,000 | 0.509 | 105,394 | 210,787 | $1.65 | $2.60 |
| 4 | 165,000 | 28,000 | – | 28,000 | 0.447 | 114,003 | 228,006 | $1.60 | $2.15 |
| 5 | 160,000 | 22,000 | – | 22,000 | 0.884 | 140,000 | 280,000 | $1.26 | $1.45 |
| 6 | 165,000 | 28,000 | – | 28,000 | 0.450 | 125,332 | 250,663 | $1.40 | $1.44 |
| 7 | 155,000 | 23,000 | – | 23,000 | 0.872 | 137,625 | 275,250 | $1.24 | $1.41 |
| 8 | 151,000 | 26,000 | – | 26,000 | 0.654 | 140,000 | 280,000 | $1.27 | $1.54 |
| 9 | 145,000 | 20,000 | – | 20,000 | 0.959 | 140,000 | 280,000 | $1.23 | $1.26 |
| 10 | 135,000 | 28,000 | – | 28,000 | 0.505 | 123,761 | 247,521 | $1.40 | $1.44 |
| 11 | 45,638 | 20,000 | – | 20,000 | 0.958 | 135,954 | 271,907 | $0.78 | $0.82 |
| 12 | 30,000 | 18,000 | – | 18,000 | 1.034 | 140,000 | 280,000 | $0.63 | $0.69 |
| 13 | 28,042 | 28,000 | – | 28,000 | 0.602 | 140,000 | 280,000 | $0.60 | $0.61 |
| 14 | 95,000 | 28,000 | – | 28,000 | 0.316 | 96,301 | 192,601 | $1.04 | $1.06 |
| 15 | 95,200 | 11,456 | 16,544 | 28,000 | 0.286 | 61,428 | 122,855 | $1.84 | $1.91 |
| 16 | 65,063 | 9,299 | 18,701 | 28,000 | 0.443 | 68,857 | 137,714 | $1.53 | $1.58 |
| 17 | 75,566 | – | 28,000 | 28,000 | 0.323 | 65,255 | 130,509 | $1.68 | $1.73 |
| 18 | 40,442 | – | 28,000 | 28,000 | 0.287 | 48,567 | 97,134 | $1.68 | $1.72 |
| 19 | 32,777 | – | 28,000 | 28,000 | 0.352 | 47,947 | 95,893 | $1.50 | $1.51 |
| 20 | 20,822 | – | 19,859 | 19,859 | 0.408 | 41,350 | 82,700 | $1.45 | $1.46 |
| 21 | – | – | – | – | – | 14,995 | 29,989 | $0.26 | $0.26 |
| 22 | – | – | – | – | – | 1,774 | 3,547 | $0.83 | $0.83 |
Exhibit B: Annual Economics
| Annual Economics ($k) | ||||||
| Year | Revenue | Operating
Cost |
Operating
Income |
EBITDA1 | Capital
Expenditures1 |
FCF1 |
| 1 | $326,008 | $339,201 | -$13,193 | -$13,193 | $364,262 | -$370,631 |
| 2 | $569,537 | $351,600 | $217,938 | $217,040 | $371,662 | -$187,748 |
| 3 | $895,846 | $342,632 | $553,215 | $547,834 | $200,790 | $293,381 |
| 4 | $969,026 | $353,629 | $615,397 | $604,725 | $125,388 | $428,763 |
| 5 | $1,190,000 | $329,940 | $860,060 | $838,519 | $53,733 | $661,990 |
| 6 | $1,065,319 | $330,218 | $735,101 | $713,221 | $7,914 | $579,940 |
| 7 | $1,169,813 | $314,946 | $854,867 | $827,717 | $45,621 | $619,042 |
| 8 | $1,190,000 | $324,215 | $865,785 | $835,204 | $76,067 | $590,722 |
| 9 | $1,190,000 | $313,324 | $876,676 | $845,963 | $9,599 | $649,049 |
| 10 | $1,051,964 | $327,061 | $724,903 | $705,041 | $9,459 | $543,304 |
| 11 | $1,155,604 | $184,694 | $970,910 | $944,010 | $10,787 | $694,138 |
| 12 | $1,190,000 | $146,365 | $1,043,635 | $1,012,716 | $15,627 | $755,140 |
| 13 | $1,190,000 | $141,760 | $1,048,240 | $1,023,018 | $4,571 | $782,800 |
| 14 | $818,556 | $188,723 | $629,833 | $619,181 | $4,814 | $494,280 |
| 15 | $522,136 | $219,843 | $302,293 | $295,671 | $7,948 | $238,810 |
| 16 | $585,286 | $199,362 | $385,924 | $374,733 | $6,789 | $282,435 |
| 17 | $554,663 | $206,894 | $347,768 | $335,283 | $6,018 | $259,314 |
| 18 | $412,821 | $153,488 | $259,333 | $249,653 | $4,322 | $189,793 |
| 19 | $407,545 | $134,224 | $273,321 | $263,669 | $1,152 | $202,347 |
| 20 | $351,475 | $111,403 | $240,071 | $231,840 | $765 | $180,567 |
| 21 | $127,451 | $4,716 | $122,735 | $119,776 | $0 | $85,605 |
| 22 | $15,073 | $2,609 | $12,464 | $12,116 | $0 | $11,692 |
| PRICE DECK – ASSUMPTIONS | ||
| PRICE / RATE | UNIT | LONG TERM |
| Copper | $/lb | 4.25 |
| Copper Cathode Premium | $/lb | Not Applied |
| Weighted Average Recovery | % CuT | 75 |
| Sulfuric Acid | $/ton | 160.00 |
| Electricity | $/kWh | 0.06 |
| NSR Royalty | % | 2.54% on Cactus and a portion of Parks/Salyer |
| % | 0.5% on Bronco Creek (portion of PS) | |
| Effective Taxes | % | |
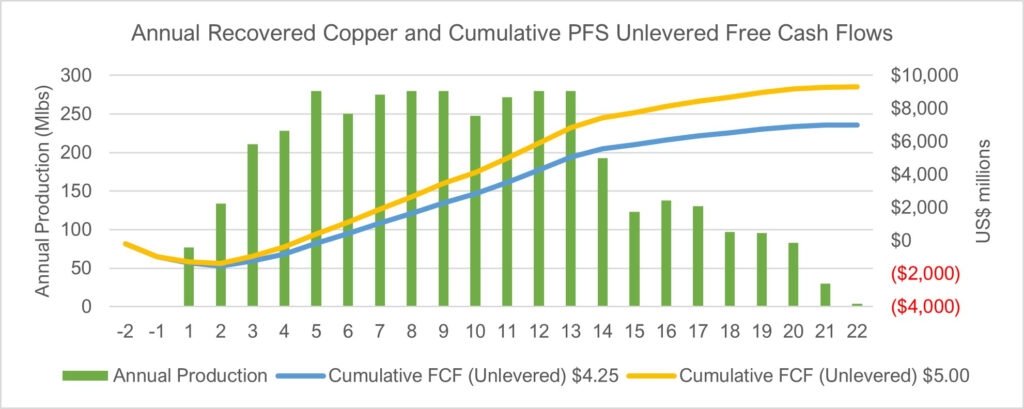
FIGURE 1: Estimated Annual Recovered Copper and Cumulative PFS Unlevered Free Cash Flows illustrates benefits of focusing on the optimized mine plan
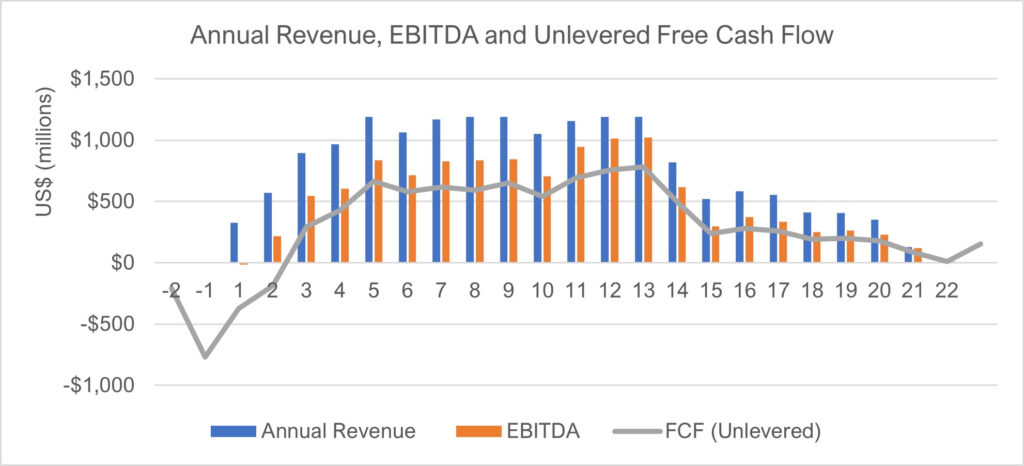
FIGURE 2: Estimated Annual Revenue, EBITDA and Unlevered Free Cash Flow
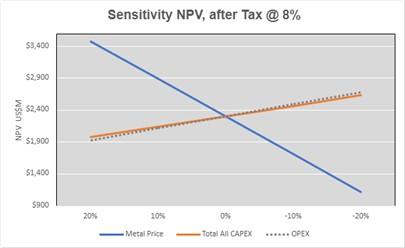
FIGURE 3: NPV Sensitivity to the Metal Price, CAPEX and OPEX
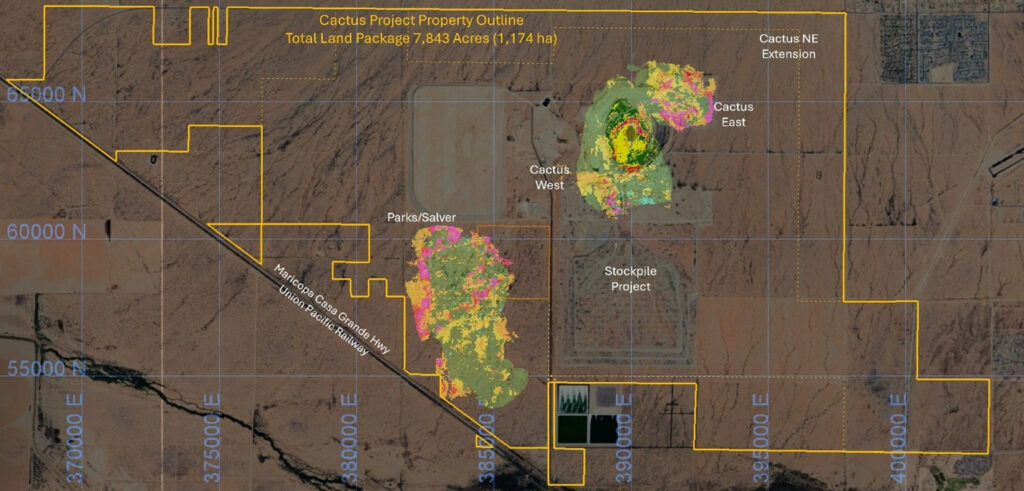
FIGURE 4: Cactus Project Mineral Resources
Hudbay Minerals Inc. (TSX:HBM) (NYSE: HBM) today released its ann... READ MORE
Strategic acquisition of an established operating gold mine, loca... READ MORE
Cerro de Pasco Resources Inc. (TSX-V: CDPR) (OTCQB: GPPRF) (FRA: ... READ MORE
The Garneau Titanium Project Features Ilmenite-Rich Boulder with ... READ MORE
ValOre Metals Corp. (TSX‐V: VO) (OTCQB: KVLQF) (Frankfurt: KEQ0... READ MORE


