








Apollo Silver Corp. (TSX-V: APGO) (OTCQB: APGOF) (Frankfurt: 6ZF) announces positive results from the Preliminary Economic Assessment for its Calico Silver Project located in San Bernardino County, California.
The PEA and the updated Mineral Resource Estimate were prepared by SLR Consulting (Canada) Ltd. in accordance with National Instrument 43-101 Standards of Disclosure for Mineral Projects and the Canadian Institute of Mining, Metallurgy and Petroleum Definition Standards. SLR was responsible for the updated MRE, mine planning, processing, design parameters, and operating and capital cost estimates.
The PEA outlines an open pit mining operation at the Waterloo deposit feeding a conventional 8,000 tonne per day milling and cyanidation leach plant with an initial planned processing life of approximately 15 years. At a base case silver price of US$55/oz, the Project has an after-tax net present value at a 5% discount rate of US$737 million, an after-tax internal rate of return of 25%, and an after-tax payback period of 3 years (Table 1) 1,2.
The PEA is preliminary in nature and includes Inferred Mineral Resources that are considered too speculative geologically to have the economic considerations applied to them that would enable them to be categorized as Mineral Reserves, and there is no certainty that the results of the PEA will be realized. Mineral Resources that are not Mineral Reserves do not have demonstrated economic viability. Approximately 3% of the mill feed in the PEA mine plan is classified as Inferred Mineral Resources.
Highlights of the Calico Project Preliminary Economic Assessment
“This PEA shows that Waterloo alone can support a 15-year operation producing about 5 million ounces of silver a year, with an after-tax NPV of US$737 million at US$55 silver, and the base case does not yet draw on Langtry’s 49 million Inferred ounces,” said Colin Sutherland, President and CEO. “Waterloo sits on private land with vested surface mining rights and would produce doré in the United States, at a time when silver has been added to the U.S. List of Critical Minerals. Our focus now is de-risking: studies on water, power and capital inputs are under way, and we are advancing toward a prefeasibility study.”
PEA Summary
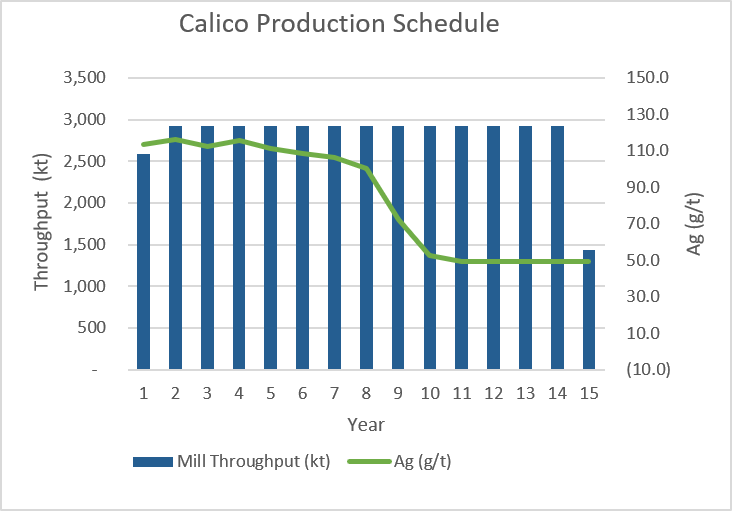
The PEA assumes contract open pit mining at Waterloo, with mill feed processed at approximately 2.9 million tonnes per annum (8,000 tpd). The schedule prioritizes higher-grade feed in the first 10 years, averaging 100.8 g/t Ag, while material below 65.0 g/t Ag and above 34.0 g/t Ag is stockpiled and processed later in the mine life. The PEA does not include the Langtry silver Mineral Resource or the Waterloo gold Mineral Resource.
The base case indicates an after-tax payback of 3 years and pre-tax and after-tax NPV5% of US$925 million and US$737 million, respectively (Table 1).
Table 1: 2026 Calico Project Preliminary Economic Assessment Metrics
| Key Assumptions | ||
| Base Case Silver Price | US$55/oz | |
| Silver Metallurgical Recovery | 65% | |
| Royalty | 2% NSR | |
| Production Profile | units | |
| Total Tonnes Processed | ‘000 tonnes | 41,981 |
| Total Tonnes Waste | ‘000 tonnes | 20,517 |
| Stripping Ratio | W:O | 0.49 |
| Ag Grade | g/t | 84.78 |
| Mine Life | years | 15 |
| Mill Feed | ‘000 tonnes | 41,981 |
| Contained Ag | koz | 114,426 |
| Throughput | tpd | 8,000 |
| Total Ag Recovered | koz | 74,377 |
| Operating Cost | ||
| Open Pit | US$/t moved | 2.57 |
| Processing | US$/t milled | 28.40 |
| G&A – Site Services | US$/t milled | 5.32 |
| Total Unit Operating Cost | US$/t milled | 38.48 |
| Capital Cost | ||
| Initial Capital (including 25% contingency) | US$ ‘000 | 632,867 |
| Sustaining Capital | US$ ‘000 | 28,200 |
| Open Pit Backfilling | US$ ‘000 | 16,619 |
| Closure Costs | US$ ‘000 | 37,473 |
| Total Capital Cost | US$ ‘000 | 715,159 |
Sensitivity analysis indicates leverage to the silver price (Table 2) with a high case of US$65/oz silver price resulting in an after-tax NPV5% of US$1,113 million and an after-tax IRR of approximately 32%, while maintaining the same mine plan and operation assumptions.
Table 2: Silver Price Sensitivity Analysis
| Silver Price (US$/oz) | $ 45 (Low Case) |
$ 55 (Base Case) |
$ 65 (High Case) |
|
| Pre-tax Cash Flow (LOM) | US$ ‘000 | 788,654 | 1,516,818 | 2,244,982 |
| Pre-tax NPV (5%) | US$ ‘000 | 435,193 | 924,863 | 1,414,533 |
| Pre-tax IRR | % | 18% | 29% | 38% |
| Pre-tax Payback | years | 3.8 | 2.7 | 2.2 |
| After-tax Cash Flow (LOM) | US$ ‘000 | 658,661 | 1,238,027 | 1,795,719 |
| After tax NPV (5%) | US$ ‘000 | 347,955 | 737,263 | 1,112,698 |
| After tax IRR | % | 16% | 25% | 32% |
| After-tax Payback | years | 3.9 | 3.0 | 2.4 |
Project Description
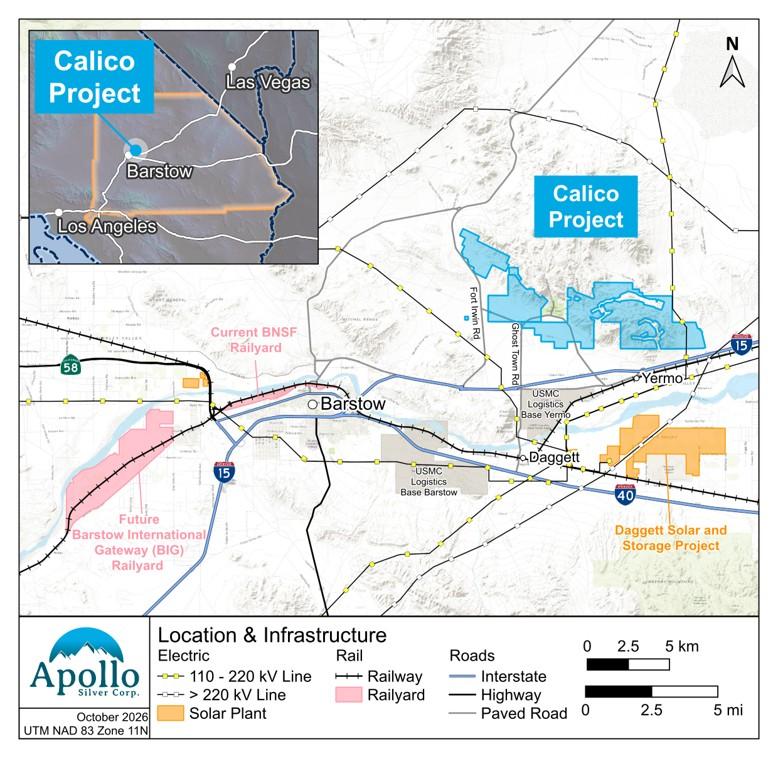
The Calico Project is in the historic Calico Silver Mining District of the Mojave Desert, San Bernardino County, California, about 15 km northeast of Barstow. It is reached year-round from Interstate 15 by paved and dirt roads. The project covers 8,361 acres (3,384 ha) in three adjoining properties (Waterloo – 1,645 acres, Langtry – 1,166 acres, and Mule – 5,550 acres). The majority of the mineral resources at Waterloo and Langtry are located on private lands with county-recognized vested rights to surface mining. Barstow provides workforce, utilities and services, and the Union Pacific main line runs along I-15. Water for the Project is expected to be secured through the acquisition or lease of water rights within the adjudicated Mojave Basin.
Figure 1: Calico Project Location and Regional Infrastructure
2026 Calico Silver Mineral Resource Estimate
The updated MRE has an effective date of October 1, 2026. The drill hole database remains unchanged from the June 30, 2025 estimate disclosed in Apollo’s news release dated September 4, 2025. The updated MRE reflects revised grade capping, estimation and classification methods, metal-specific reporting, updated commodity prices and operating assumptions, and revised reporting cut-off grades and optimized pit constraints.
At Waterloo, Measured and Indicated silver Mineral Resources total 42.2 Mt at 85.1 g/t Ag for 115.6 Moz of contained Ag, and Inferred silver Mineral Resources total 1.1 Mt at 65.4 g/t Ag for 2.3 Moz. At Langtry, Inferred silver Mineral Resources total 23.0 Mt at 66.3 g/t Ag for 49.1 Moz. Combined Calico Silver Mineral Resources comprise 42.2 Mt at 85.1 g/t Ag for 115.6 Moz in the Measured and Indicated categories and 24.1 Mt at 66.3 g/t Ag for 51.4 Moz in the Inferred category. Inferred gold Mineral Resources in the Waterloo gold domain total 0.53 Mt at 0.80 g/t Au for 0.014 Moz (Tables 3 and 4). All Mineral Resources are constrained within optimized open pit shells.
Silver is the principal commodity at Waterloo and Langtry. Gold is reported separately as an Inferred Mineral Resource within the Waterloo gold domain and is not combined with silver in a silver-equivalent grade. Barite and zinc are not reported in the updated MRE. Mineral Resources are classified in accordance with the CIM Definition Standards for Mineral Resources and Mineral Reserves (May 2014) and are constrained within optimized open pit shells to demonstrate reasonable prospects for eventual economic extraction. Reporting cut-off grades are 34 g/t Ag at Waterloo, 0.51 g/t Au in the Waterloo gold domain, and 35 g/t Ag at Langtry.
Mineral Resources are reported in metric units. The MRE uses a silver price of US$50/oz, while the PEA base case uses US$55/oz.
Table 3: Summary of the Calico Silver Open Pit Mineral Resources, Effective Date October 1, 2026
| Deposit | Metal | Classification | Cut-off (g/t Ag) |
Tonnage (Mt) |
Grade (g/t Ag) |
Contained Metal (Moz Ag) |
| Waterloo | Silver | Measured | 34 | 30.6 | 89.5 | 88.2 |
| Indicated | 11.6 | 73.5 | 27.4 | |||
| Measured + Indicated | 42.2 | 85.1 | 115.6 | |||
| Inferred | 1.1 | 65.4 | 2.3 | |||
| Langtry | Inferred | 35 | 23.0 | 66.3 | 49.1 | |
| Total | Measured | 34 | 30.6 | 89.5 | 88.2 | |
| Indicated | 11.6 | 73.5 | 27.4 | |||
| Measured + Indicated | 42.2 | 85.1 | 115.6 | |||
| Inferred | 34 / 35 | 24.2 | 66.3 | 51.5 |
Notes:
Table 4: Summary of the Waterloo Au Open Pit Mineral Resources, Effective Date October 1, 2026
| Deposit | Classification | Cut-off (g/t Au) |
Tonnage (Mt) |
Grade (g/t Au) |
Contained Metal (Moz Au) |
| Waterloo | Inferred | 0.51 | 0.53 | 0.80 | 0.014 |
Notes:
Mineral Resources are not Mineral Reserves and do not have demonstrated economic viability. Other than as described in this news release, including under “Environmental, Permitting and Community” and in the forward-looking statements, the Company is not aware of any known legal, political, environmental or other risks that could materially affect the potential development of the Mineral Resources.
Estimation Methodology
At Waterloo, silver was estimated by ordinary kriging within four hard-boundary domains using domain-specific grade continuity models and locally variable orientations; at Langtry, silver was estimated by inverse-distance-cubed interpolation within a single hard-boundary domain. Domain-specific caps of 330 g/t Ag to 565 g/t Ag at Waterloo and 200 g/t Ag at Langtry were applied to assays before compositing, rather than to composites as in the 2025 estimate. Gold was estimated separately within the Waterloo gold domain and capped at 2 g/t Au. A bulk density of 2.44 t/m³ was applied at both deposits, and the models were validated against capped composites, check estimates, and swath plots. At Waterloo, nominal drill hole spacings of 150 ft, 250 ft, and 350 ft support the Measured, Indicated, and Inferred classifications, respectively; Langtry is classified entirely as Inferred.
The reporting pit shells are conceptual constraints used solely for Mineral Resource reporting. They do not constitute mine designs, Mineral Reserves, or evidence of demonstrated economic viability.
Analytical Methods and Data Verification
The Mineral Resource estimate uses the same drilling and assay database as the estimate effective June 30, 2025, as disclosed in Apollo’s news release dated September 4, 2025; no new drilling or sampling has been completed at Calico since that estimate. Sample preparation was completed at ALS Global Geochemistry in Reno, Nevada, and analyses were completed at ALS Global Geochemistry in Vancouver, British Columbia. ALS is an ISO 9001 and ISO/IEC 17025 accredited laboratory and is independent of Apollo. All samples were analyzed for 48 elements via ICP-MS following a four-acid digestion with reportable ranges for silver of 0.01 to 100 ppm (method ME-MS61). Over-range samples analyzed for silver were re-submitted for analysis using a four-acid digestion and ICP-AES finish with a silver range of 1-1,500 ppm (method Ag-OG62). When results were over 400 ppm silver, they were re-submitted for analysis by fire assay with a gravimetric finish using a 30 g nominal sample weight with reportable silver range of 5-10,000 ppm (method Ag-GRA21). Over-range samples analyzed for copper, lead and zinc were re-submitted for analysis using a four-acid digestion and ICP-AES finish with range of 0.001-50% for copper, 0.001-20% for lead, and 0.001-30% for zinc. Gold was analyzed by fire assay with atomic absorption finish (method Au-AA26) with a reportable range of 0.01-100 ppm Au. The quality assurance and quality control program comprises certified reference materials, blanks, field duplicates, and external check assays at a secondary umpire laboratory.
The SLR Qualified Person, Ms. Masun, reviewed the sampling, analytical, and QA/QC data and verified the assay database against available laboratory certificates. No limitations were placed on the verification process. The QA/QC results and data verification support the use of the data for Mineral Resource estimation and public disclosure NI 43-101. The SLR Qualified Person, Mr. Engelbrecht, reviewed the metallurgical test work data underlying the PEA recovery assumption. No limitations were placed on the verification process.
Comparison to Previous Estimate
The 2026 MRE supersedes the June 30, 2025 estimate. The drill hole database is unchanged; differences reflect revised grade capping, estimation and classification methods, updated prices and costs, revised pit constraints, and the change to metal-specific reporting. At Waterloo, reporting changed from a 47 g/t AgEq cut-off in 2025, which credited gold, barite, and zinc, to separate 2026 cut-offs of 34 g/t Ag for silver and 0.51 g/t Au for gold. At Langtry, the silver cut-off changed from 43 g/t Ag in 2025 to 35 g/t Ag in 2026. The 2025 Waterloo AgEq cut-off is not directly comparable with the 2026 silver-only cut-off. Gold is reported separately within the Waterloo gold domain at the classification supported by the gold data.
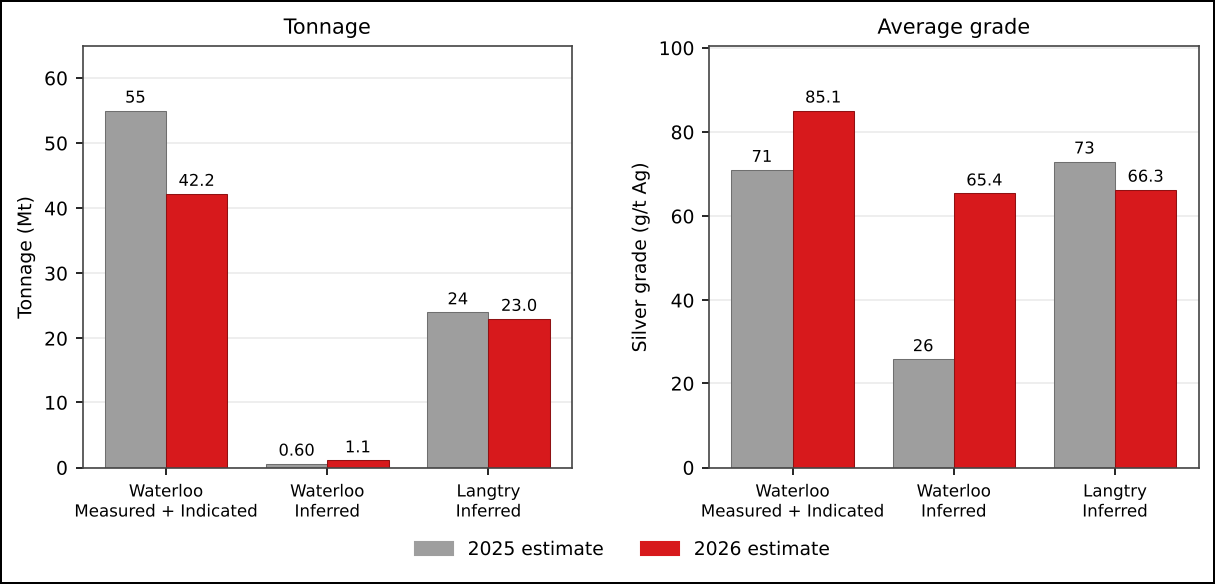
At Waterloo, Measured and Indicated silver tonnage decreased 23% to 42.2 Mt, average grade increased 20% to 85.1 g/t Ag, and contained silver decreased from 125 Moz to 115.6 Moz. Inferred silver tonnage increased 83% to 1.1 Mt, average grade increased 152% to 65.4 g/t Ag, and contained silver increased from 0.51 Moz to 2.3 Moz. The 2026 optimized resource pit shell at Waterloo is shallower than the 2025 reporting shell, and its resource-shell strip ratio decreased from 0.8:1 to 0.6:1.
At Langtry, Inferred silver tonnage decreased 4% to 23.0 Mt, average grade decreased 9% to 66.3 g/t Ag, and contained silver decreased from 57 Moz to 49.1 Moz. The Langtry Mineral Resource remains entirely Inferred. The 2026 optimized resource pit shell at Langtry is shallower than the 2025 reporting shell, and its resource-shell strip ratio decreased from 2.8:1 to 1.7:1. The Waterloo and Langtry reporting-shell strip ratios described above are conceptual Mineral Resource reporting metrics and are not mine-plan strip ratios.
Table 5 summarizes the 2025 and 2026 pit-constrained Mineral Resources by deposit, metal, and classification using the rounded values disclosed for each estimate.
Table 5: Comparison of Previous and Current Pit-Constrained Mineral Resources
| Deposit | Metal | Class | 2025 Tonnage (Mt) |
2025 Grade (g/t) |
2025 Contained (Moz) |
2026 Tonnage (Mt) |
2026 Grade (g/t) |
2026 Contained (Moz) |
Change in tonnage |
Change in grade |
||||||||
| Waterloo | Silver | Measured | 43 | 75 | 104 | 30.6 | 89.5 | 88.2 | – | 29 | % | +19 | % | |||||
| Indicated | 12 | 57 | 21 | 11.6 | 73.5 | 27.4 | -3 | % | +29 | % | ||||||||
| Measured + Indicated |
55 | 71 | 125 | 42.2 | 85.1 | 115.6 | -23 | % | +20 | % | ||||||||
| Inferred | 0.60 | 26 | 0.51 | 1.1 | 65.4 | 2.3 | +83 | % | +152 | % | ||||||||
| Gold | Inferred | 17 | 0.25 | 0.13 | 0.53 | 0.80 | 0.014 | -97 | % | +220 | % | |||||||
| Langtry | Silver | Inferred | 24 | 73 | 57 | 23.0 | 66.3 | 49.1 | -4 | % | -9 | % | ||||||
Notes:
Figure 2 illustrates the changes in tonnage and average grade for the Waterloo and Langtry silver Mineral Resources from 2025 to 2026.
Figure 2: Calico Silver Mineral Resources, Change in Tonnage and Average Grade, 2025 to 2026
Open Pit Mining
The PEA is based on an open-pit mine feeding a processing plant that treats 8,000 tonnes of mineralized material per day over a 15-year mine life, with an average head grade of 101 g/t Ag over the first 10 years (Figure 3). The pit is designed with 6.1-metre (20-foot) benches and 45-degree overall pit walls. The overall strip ratio is 0.5:1.
To improve early cash flow, the plan prioritizes higher-grade material. Material grading 65 g/t silver or more is classified as high grade and sent directly to the plant. Lower-grade material that is still economic under the PEA assumptions is either fed directly to the plant during mining to keep it at full capacity or placed on a stockpile for later processing. Once mining ends, the plant continues to run on reclaimed stockpile material through Year 15. Reclamation and closure are scheduled for Year 16.
Figure 3: Production Schedule
Processing & Metallurgy
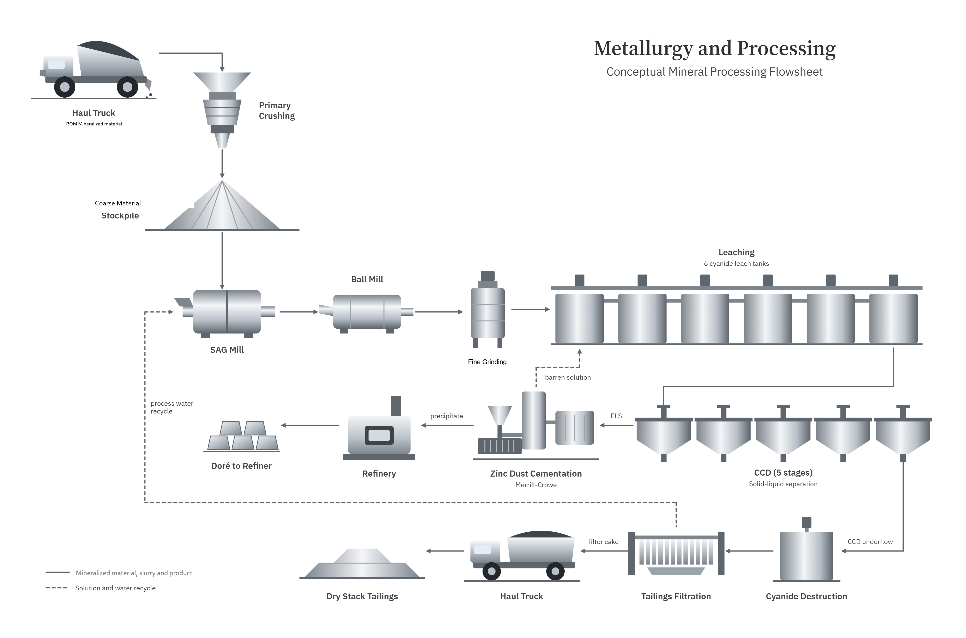
The PEA envisions a conventional 8,000 tpd plant: jaw crushing, SAG and ball milling, and fine grinding in a vertical stirred mill, followed by agitated cyanide leaching, counter-current decantation and Merrill-Crowe zinc precipitation to produce doré on site. Residual cyanide is destroyed, and tailings are filtered and placed in a dry stack facility, which recycles most process water and avoids a conventional tailings dam (Figure 4).
The PEA assumes an overall silver recovery of 65%, based on McClelland Laboratories testwork on five samples from the Waterloo deposit (see news release dated February 23, 2023). Recovery improved significantly with finer grinding: recoveries ranged from 40% to 61% at a grind size of 45 microns and from 64% to 80% at finer grinds. The 65% assumption therefore depends on the fine-grinding stage in the flowsheet and is supported by a limited number of samples. Variability and optimization test work is a priority for the next phase of study.
Figure 4: Process Flowsheet
Infrastructure
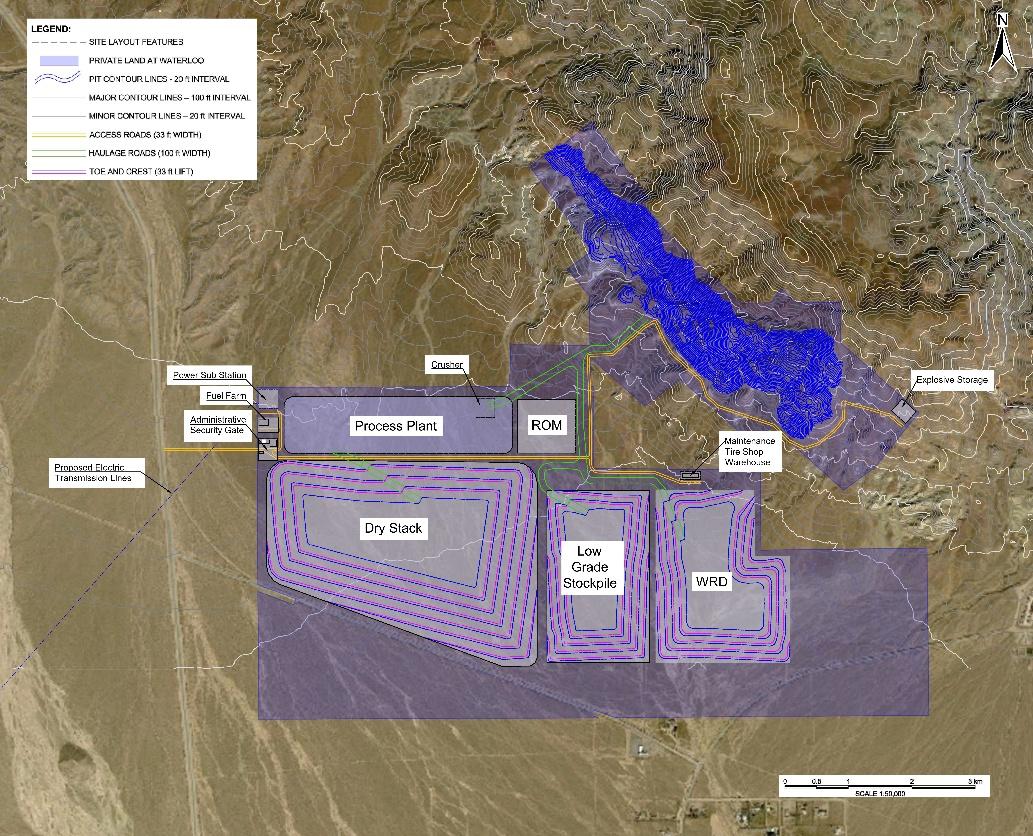
The PEA includes an on-site substation fed by a proposed transmission line, access and site roads, water supply and management systems, site buildings, and a dry stack tailings facility (Figure 5). The process plant area covers approximately 30 hectares. Power is planned to come from one of two nearby transmission lines (220 kV and 115 kV). The connection point, available capacity, and ability to add the Project’s load will be confirmed with the regional transmission providers as part of ongoing Project development work.
Figure 5: Site Layout
Capital and Operating Costs
Capital Costs:
For the PEA, a 24-month construction period was assumed (Years -2 and -1). Capital costs are estimated to a PEA level of accuracy of -30% to +50%. Process plant capital is derived from benchmark data adjusted for fine grinding and filtered tailings. Site-wide infrastructure estimate considers access and service roads, site preparation, water systems, site buildings, site terracing, transmission line and main substation, and security hub. Tailings assumes a dry stack tailings facility, which necessitates earthworks, potential liners, drainage, and access roads. Indirect costs include EPCM and Owner’s costs. The Initial capital costs consider a 25% contingency.
Sustaining capital was assessed at 2% of operating costs, excluding early years and end of mine life.
The estimate includes backfilling and recontouring of the Waterloo pit to broadly follow the surrounding topography, as required for open pit metallic mines in California, with backfill waste movement scheduled in Years 11 to 14; reclamation and closure, estimated as a factor of direct processing and infrastructure costs (Table 6).
Table 6: Capital Cost Summary
| Capital Costs (US$ ‘000) | |
| Direct Cost | |
| Mine Development | 6,000 |
| Processing | 276,611 |
| Site Infrastructure | 57,325 |
| Tailings Dewatering & Conveyance | 40,792 |
| Total Direct Cost | 380,728 |
| Indirect Costs | |
| EPCM | 47,610 |
| Owner’s Costs | 15,870 |
| Other Indirect Costs | 62,085 |
| Total Indirect Costs | 125,565 |
| Contingency – 25% | 126,573 |
| Initial Capital Cost | 632,867 |
| Sustaining | 28,200 |
| Open Pit backfilling | 16,619 |
| Reclamation and closure | 37,473 |
| Total Capital Cost | 715,159 |
Operating Costs:
Mining costs are derived from benchmark data from similar US open pit projects and adjusted by tonnes mined, and the cost of rehandling the low-grade stockpile is included. Processing costs, derived from benchmark data adjusted for fine grinding and filtered tailings, are estimated at US$28.40/t milled, driven mainly by labour, reagents and power. General and administrative costs are estimated at US$15.5 million per year, covering site management, support personnel, annual payments, vehicles, insurance, and environmental and social compliance. (Table 7).
Table 7: Operating Cost Summary
| Operating Costs | ||
| Mining (Open Pit) | US$/t moved | 2.57 |
| Mining (Open Pit) | US$/t milled | 4.76 |
| Processing | US$/t milled | 28.40 |
| G&A | US$/t milled | 5.32 |
| Total Unit Operating Cost | US$/t milled | 38.48 |
| Mining (Open Pit) | US$ ‘000 | 200,015 |
| Processing | US$ ‘000 | 1,192,269 |
| G&A | US$ ‘000 | 223,200 |
| Total Operating Cost | US$ ‘000 | 1,615,484 |
Economic Analysis and Sensitivity Analysis
The economic analysis presented in Calico’s PEA is based on revenue from silver only. An after-tax cash flow projection has been generated from the LOM production schedule and capital and operating cost estimates developed for the PEA. A simplified tax calculation has been added to the Project’s cash flow projection to arrive at the after-tax economic metrics. A simplified combined Federal and State tax rate of 27.98% has been assumed. The tax calculation includes a 7-year MACRS depreciation and depletion.
The base discount rate assumed in the PEA is 5% consistent with standard industry practice for evaluating precious‑metal projects in North America. The base discount date is assumed to be January 1st of the first year of construction (Year -2).
The economic analysis indicates positive potential economics for the Project; however, the PEA is preliminary in nature, includes Inferred Mineral Resources, and there is no certainty that the results of the PEA will be realized. At a base case Ag price of US$55.00/oz, the Project has an after-tax NPV5% of US$737 million, an after-tax IRR of 25%, and an after-tax payback period of 3.0 years from the start of production. Table 8 summarizes the key pre-tax and after-tax economic metrics.
Table 8: Economic Metrics Summary
| Economic Metrics | Units | Amounts |
| Pre-tax Free Cash Flow (LOM) | US$ ‘000 | 1,516,818 |
| Pre-tax NPV (5%) | US$ ‘000 | 924,863 |
| Pre-tax IRR | % | 29% |
| Pre-tax Payback | years | 2.7 |
| After-tax Free Cash Flow (LOM) | US$ ‘000 | 1,238,027 |
| After-tax NPV (5%) | US$ ‘000 | 737,263 |
| After-tax IRR | % | 25% |
| After-tax Payback | years | 3.0 |
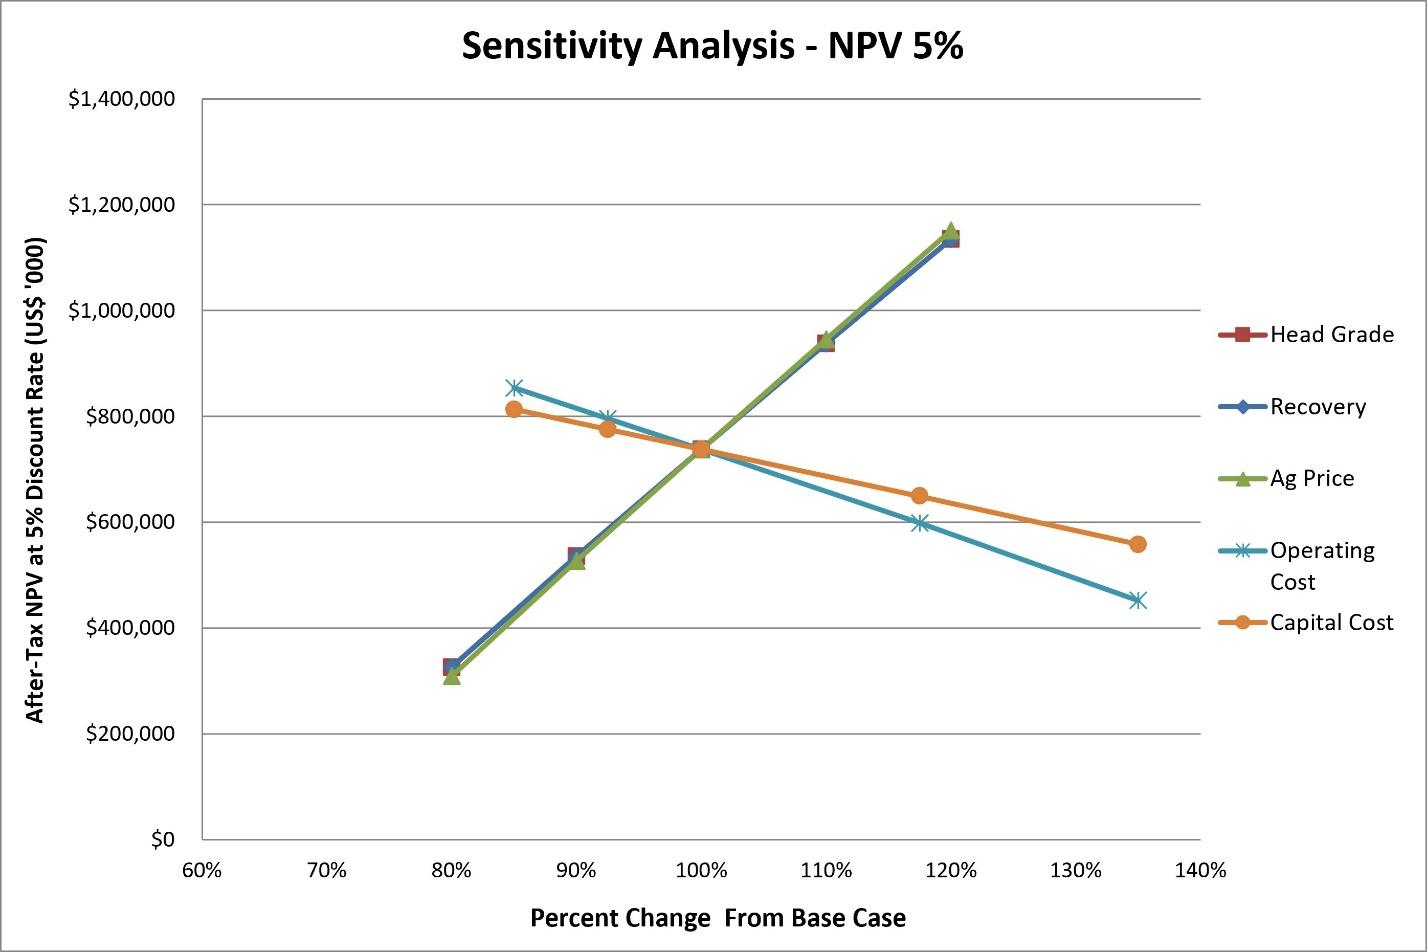
The sensitivity analysis of the Project shows that the after-tax NPV5% is most sensitive to metal prices, metallurgical recoveries, and head grades, followed by operating costs and capital costs. A 10% reduction in metal prices reduces the after-tax NPV at 5% by 29% for the Project’s Base Case. The results of the after-tax NPV5% sensitivity are shown in Figure 6.
Figure 6: After-Tax NPV5% Sensitivity
Environmental, Permitting and Community
The Waterloo and Langtry deposits are on private land with county-recognized vested rights to surface mining. Permitting is expected to proceed principally under the California Environmental Quality Act and the Surface Mining and Reclamation Act, with San Bernardino County as lead agency, including approval of a reclamation plan and financial assurance. If the Project’s power connection or another Project element requires a federal permit, or if federal funding is used, federal environmental review under the National Environmental Policy Act could also apply. Environmental baseline studies, including biological and cultural resource surveys, are planned for 2027. No permits required to construct or operate the Project have been obtained, and there is no certainty that they will be obtained on a timely basis or at all. Apollo Silver is committed to early and ongoing engagement with local communities, Tribal Nations and regulators.
Opportunity & Next Steps
The Langtry deposit, which contains 49.1 Moz of Inferred silver, and the Waterloo gold domain sit outside the PEA mine plan and represent opportunities for further work. Further opportunities include metallurgical optimization and assessment of pit shells and cut-off grades using alternative silver price assumptions.
Apollo’s focus is de-risking the mineral resources with next steps including metallurgical variability and optimization test work; geotechnical and metallurgical drilling, securing water rights within the adjudicated Mojave Basin; confirming the power interconnection; advancing environmental baseline studies; and advancing Calico towards a prefeasibility study.
Technical Report
The effective date of the PEA is October 23, 2026, and a NI 43-101 technical report relating to the PEA and the MRE will be filed on SEDAR+ (www.sedarplus.ca) within 45 days of this news release, on or before December 13, 2026.
Qualified Persons
The Mineral Resource estimate disclosed in this news release was prepared by Ms. Katharine Masun, M.Sc., P.Geo., Principal Resource Geologist with SLR Consulting (Canada) Ltd., a Qualified Person under NI 43-101, who is independent of the Company. The Mineral Resources were classified in accordance with the CIM Definition Standards for Mineral Resources and Mineral Reserves (May 2014). Ms. Masun has reviewed and approved the scientific and technical information in this news release relating to the Mineral Resource estimate. The PEA disclosed in this news release was prepared by Mr. David M. Robson, P.Eng., Principal Mining Engineer, Mr. Lance Engelbrecht, P.Eng., Principal Metallurgist, Mr. Hugo M. Miranda, M.Eng., MBA, SME(RM), Principal Mining Engineer, and Mr. Michael Robinson, MMSA(RM), Principal Environmental Advisor, each of SLR are independent Qualified Person under NI 43-101 who have reviewed and approved the information in this news release relating to the PEA.
The scientific and technical data contained in this news release were reviewed and approved by Isabelle Lépine, M.Sc., P.Geo., Apollo Silver’s Director, Mineral Resources. Ms. Lépine is a registered professional geologist in British Columbia and a QP as defined by NI 43-101 and is not independent of the Company.
ABOUT APOLLO SILVER CORP.
Apollo Silver is advancing a primary silver development project in the United States. The Calico Silver Project in San Bernardino County, California, hosts Measured and Indicated Mineral Resources of 115.6 Moz silver (42.2 Mt at 85.1 g/t Ag) and Inferred Mineral Resources of 51.5 Moz silver (24.2 Mt at 66.3 g/t Ag), effective October 1, 2026, and silver was added to the U.S. List of Critical Minerals in 2025. The Company also holds an option on the Cinco de Mayo Project in Chihuahua, Mexico, a carbonate replacement deposit project. Led by an experienced management team, Apollo Silver is well positioned to advance the assets and deliver value through exploration and development.
Please visit www.apollosilver.com for further information.
ON BEHALF OF THE BOARD OF DIRECTORS
Colin Sutherland
President & CEO
For further information, please contact:
Email: info@apollosilver.com
Telephone: +1 (604) 428-6128
Neither the TSX Venture Exchange nor its Regulation Services Provider (as that term is defined in the policies of the TSX Venture Exchange) accepts responsibility for the adequacy or accuracy of this release.
Southern Silver Exploration Corp. (TSX-V: SSV) (OTCQX: SSVFF) reports that at the Company’s An... READ MORE
West Point Gold Corp. (TSX-V: WPG) (OTCQX: WPGCF) (FSE: LRA0) is pleased to announce that it has rec... READ MORE
StrikePoint Gold Inc. (TSX-V: SKP) (OTCID: STKXF) CEO Mike Allen provides an overview of the... READ MORE
StrikePoint Gold Inc. (TSX-V: SKP) (OTCID: STKXF) CEO Mike Allen provides an overview of the... READ MORE