


Amex Exploration Inc. (TSX-V: AMX) (FSE: MX0) (OTCQX: AMXEF) is pleased to announce the results of an updated Preliminary Economic Assessment for its wholly-owned Perron gold project, located near the towns of Normétal and Valcanton in the province of Quebec, Canada. The PEA was prepared in collaboration with independent engineering and geological firms Evomine, Bumigeme, P&E Mining Consultants, Norda Stelo, and Laurentia Exploration.
All dollar ($) amounts in this news release are in Canadian dollar ($) unless otherwise indicated.
Perron updated Preliminary Economic Assessment Highlights:
The Perron PEA has been updated to incorporate the latest Mineral Resource Estimate (MRE – released May 21st, 2025) and a new project development strategy. The following assumes a gold price of US$2,500/ounce and a C$/US$ exchange rate of 1.38:1.
CEO Commentary:
Victor Cantore, President and Chief Executive Officer of AMEX Exploration commented, “This PEA is based on our latest Mineral Resource Estimate and reflects our new vision for developing the Perron Project. Our staged approach to production and construction is both fiscally and technically prudent, minimizing permitting and technical risk, reducing upfront capital and enabling early cash flow.”
Cantore continued, “The economics of this project are incredibly strong and with gold prices at record highs, quick time to production allows us to capitalize on current market conditions. Our cost structure is one of the lowest globally and reflects the benefits of having a project with high grade, easily mined gold ounces that is surrounded by infrastructure and mining expertise.”
Table 1: PEA Study Economic Analysis Highlights
| Economic Analysis Highlights | Unit | Base Case | Spot |
| Gold Price | US$/Au oz | 2,500 | 3,400 |
| Exchange Rate | CA$/US$ | 1.38 | 1.38 |
| Pre-Tax Phase 1 Free Cash Flow1 | CA$M | 655 | 1,175 |
| Pre-Tax Phase 2 Free Cash Flow1 | CA$M | 2,355 | 3,879 |
| Pre-Tax Total Free Cash Flow | CA$M | 3,010 | 5,055 |
| Pre-Tax NPV (5%) | CA$M | 1,885 | 3,195 |
| Pre-Tax IRR | % | 99.1 | 148.7 |
| Pre-Tax Payback Period | Yrs | 1.1 | 0.2 |
| Post-Tax Phase 1 Free Cash Flow1 | CA$M | 368 | 671 |
| Post-Tax Phase 2 Free Cash Flow1 | CA$M | 1,400 | 2,276 |
| Post-Tax Total Free Cash Flow | CA$M | 1,768 | 2,947 |
| Post-Tax NPV (5%) | CA$M | 1,085 | 1,841 |
| Post-Tax IRR | % | 70.1 | 107.6 |
| Post-Tax Payback Period | Yrs | 1.4 | 0.4 |
| Ratio Post-Tax NPV (5%) to Initial CAPEX2 | CA$M/CA$M | 7 | 13 |
Notes:
1 Growth CAPEX is attributed to Phase 2, even if incurred prior to Year 5
2 Initial capital expenditure estimate of $146.1M is partially offset from pre-production revenues of $68.6M for a net initial CAPEX of $77.5M.
Table 2: PEA Physical Highlights
| Physical Highlights | Unit | Pre-prod | Phase 1 | Phase 2 | Total |
| Processing Rate | tpd | 1,000 | 2,000 | ||
| Mine Life | yrs | 4.0 | 13.5 | 17.5 | |
| Avg. Diluted Grade | Au gpt | 14.47 | 10.07 | 4.32 | 5.07 |
| Avg. Gold Production | Au oz/yr | 102 | 93 | 95 | |
| Total Gold Production | Au koz | 20 | 409 | 1,251 | 1,680 |
| Tonnes Processed | kt | 46 | 1,329 | 9,468 | 10,843 |
| Processing Recovery Rate | % | 95 | 95 | 95 | 95 |
Table 3: PEA Study Financial Highlights
| Financial Highlights | Unit | Phase 1 | Phase 2 | Total/avg. |
| Average Operating Cost | US$/oz | 943 | 874 | 891 |
| All-in Sustaining Cash Costs (”AISC”) | US$/oz | 1,165 | 1,027 | 1,061 |
| Initial Capital Expenditure3 | CA$M | 146.1 | 146.1 | |
| Growth Capital Expenditure | CA$M | 191.6 | 191.6 | |
| LOM Sustaining Capital Expenditure | CA$M | 386.3 |
Notes:
3 Initial capital expenditure estimate of $146.1M is partially offset from pre-production revenues of $68.6M for a net initial CAPEX of $77.5M.
– The PEA is preliminary in nature and is based, in part, on Inferred Mineral Resources. Inferred Mineral Resources are considered too geologically speculative to have the economic considerations applied to them that would enable them to be categorized as Mineral Reserves. There is no certainty that the economic forecasts on which the PEA is based will be realized.
– The economic analysis of the project was carried out using a discounted cash flow approach on a pre-tax and after-tax basis with a discount rate of 5%.
– Revenue was based on a long-term gold price of $2,500/oz in USD.
Mining
The mine will be operated as a mechanized underground operation, which will be complemented by open pit production. The mine will have an overall average production rate of 1,000 tpd of mineralized material during Phase 1 and a capacity of 2,000 tpd of mineralized material during Phase 2. Production is preceded by a 21-month pre-production period.
The selected underground mining method is longitudinal longhole stoping with cemented rockfill. Stope dimensions average 17.5 m in length, 25 m in height, and 4.7 m in width (LOM average) with a minimum mining width of 3.0 m. The different sectors of mine will be accessed via ramps and drifts to allow the efficient circulation of mobile mining equipment and to satisfy ventilation and emergency egress requirements. Pre-production and Phase 1 mining activities will mostly be done by a contractor, while Phase 2 considers a fleet of owner-operated equipment that includes 10 tonne LHDs and 42 tonne haul trucks.
Seven open pits are included in the mine plan and utilize conventional truck and shovel mining that will be executed by a contractor. The pits will begin to be mined at the beginning of Phase 1, with material completely extracted by year 13 as the pits are sequenced such that they can be used to manage all tailings generated by the on-site mill during Phase 2 of the Project.
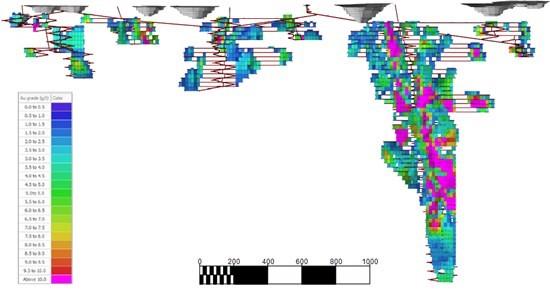
Figure 1: Mine Design
Table 4: Mine Physicals
| Total | Yr -2 | Yr -1 | Yr 1 | Yr 2 | Yr 3 | Yr 4 | Yr 5 | Yr 6 | Yr 7 | Yr 8 | ||
| Mineralized material UG | kt | 9,534 | 0 | 89 | 211 | 346 | 377 | 383 | 541 | 592 | 578 | 625 |
| Waste rock mined – UG | kt | 4,346 | 75 | 159 | 205 | 229 | 220 | 211 | 339 | 292 | 258 | 293 |
| Subtotal – UG | kt | 13,881 | 75.6 | 248 | 417 | 575 | 597 | 594 | 880 | 885 | 835 | 917 |
| Mineralized material OP | kt | 1,308 | – | – | 0 | 64 | 144 | 153 | 10 | 105 | 36 | 122 |
| Waste rock mined OP | kt | 11,044 | – | – | 0 | 745 | 1,067 | 980 | 133 | 924 | 366 | 1,033 |
| Overburden mined OP | kt | 7,298 | 28 | – | 1,087 | 762 | 529 | 316 | 1,305 | 736 | 1,428 | 666 |
| Subtotal – OP | kt | 19,651 | 28 | 0 | 1,087 | 1,571 | 1,741 | 1,448 | 1,448 | 1,764 | 1,830 | 1,821 |
| Strip ratio – OP | – | 14.0 | – | – | – | 23.5 | 11.1 | 8.5 | 143.2 | 15.9 | 49.7 | 13.9 |
| Total mining | kt | 33,531 | 104 | 248 | 1,503 | 2,146 | 2,337 | 2,042 | 2,328 | 2,649 | 2,665 | 2,739 |
| Total mineralized material | kt | 10,843 | 0 | 89 | 211 | 410 | 521 | 536 | 551 | 697 | 614 | 747 |
| Total | Yr 9 | Yr 10 | Yr 11 | Yr 12 | Yr 13 | Yr 14 | Yr 15 | Yr 16 | Yr 17 | Yr 18 | ||
| Mineralized material UG | kt | 9,534 | 564 | 535 | 650 | 653 | 626 | 658 | 660 | 658 | 647 | 141 |
| Waste rock mined – UG | kt | 4,346 | 236 | 204 | 280 | 302 | 275 | 252 | 257 | 189 | 71 | 0 |
| Subtotal – UG | kt | 13,881 | 800 | 739 | 930 | 955 | 901 | 910 | 916 | 847 | 718 | 141 |
| Mineralized material OP | kt | 1,308 | 71 | 115 | 201 | 191 | 96 | 0 | 0 | 0 | 0 | 0 |
| Waste rock mined OP | kt | 11,044 | 1,284 | 1,659 | 1,545 | 1,049 | 259 | 0 | 0 | 0 | 0 | 0 |
| Overburden mined OP | kt | 7298 | 425 | 16.3 | 0 | 0 | 0 | 0 | 0 | 0 | 0 | 0 |
| Subtotal – OP | kt | 19,651 | 1,781 | 1,791 | 1,746 | 1,240 | 355 | 0 | 0 | 0 | 0 | 0 |
| Strip ratio – OP | – | 14.0 | 24.1 | 14.6 | 7.7 | 5.5 | 2.7 | 0 | 0 | 0 | 0 | 0 |
| Total mining | kt | 33,531 | 2,581 | 2,530 | 2,676 | 2,196 | 1,256 | 910 | 916 | 847 | 717 | 140 |
| Total mineralized material | kt | 10,843 | 635 | 650 | 851 | 844 | 722 | 658 | 660 | 658 | 647 | 141 |
Processing
Phase 1 representing a 4-year 1,000 tpd contract mined, toll-milling operation in the Abitibi region, where numerous processing plants are in operation. Mineralized material will be loaded at the project site and transported by truck to the processing destination.
To date, AMEX has not entered into a toll milling arrangement with any third-party owner of a processing facility to treat its material. However, discussions were initiated and there are several parties that own processing facilities within the Abitibi region, with some permitted for toll milling and others that could be permitted upon arrangement, that could potentially treat the Perron mineralized material. Bumigeme inc., a mineral processing consultant based in Montréal (Canada), reviewed the flowsheets of these mills which are similar to the flowsheet developed in the PEA study for treating the Perron mineralized material. Bumigeme is confident that the recoveries anticipated from the toll treatment of ore from the Perron deposit will reach 94-95%, matching the expectations for the on-site processing plant (Phase 2). The Toll milling assumptions used in the PEA consists of an cost of CA$102.00 per tonne, covering for on-site crushing, transport and toll milling cost. A sensitivity analysis has been done on this cost and is presented in the Financial Analysis section.
Phase 2 consists of the construction and commissioning of a 2,000 tpd processing plant on-site at the Perron project. The plant will be in operation from year 5 to the end of the LOM. The flowsheet consists of primary crushing, followed by a grinding circuit consisting of a semi-autogenous grinding mill of 5.5 m diameter x 1.8 m long in an opened circuit and a ball mill of 4.0 m diameter x 6.7 m long in a closed circuit with cyclones – SABC circuit. A gravity circuit followed by leaching will recover coarse gold from the cyclone underflow, while the cyclone overflow, at a P80=74 microns, is treated in a six (6) tank carbon-in-leach circuit, followed by SO2/air cyanide destruction. Gold will be recovered in an adsorption-desorption-recovery circuit and electrowinning cells, with gold room recovery and production of bullion bars. The CIL tailings after the cyanide destruction will be pumped to a high-rate thickener to increase the slurry density to 62-64 % solid and pumped to empty pits.
Tests conducted in 2020 and 2024 on Perron ore achieved gold recoveries exceeding 95% using a gravity/cyanidation process. Based on these results and the treatment processes studied for four potential toll milling plants, an average recovery rate of 95% was considered for both Phase 1 and Phase 2 of the LOM. The process plant building will include a laboratory, mill offices, a dry and an electrical and mechanical shop.
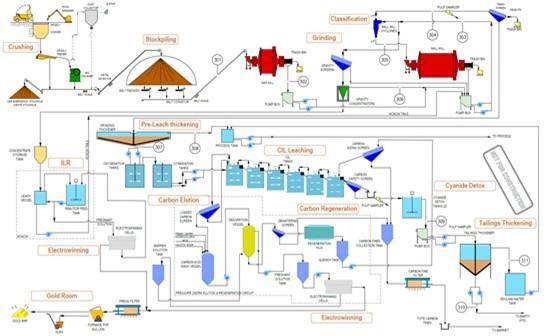
Figure 2: Flowsheet
Table 5: Gold Production by Source (Underground (UG) and Open Pit (OP))
| Total | Yr -2 | Yr -1 | Yr 1 | Yr 2 | Yr 3 | Yr 4 | Yr 5 | Yr 6 | Yr 7 | Yr 8 | ||
| UG Grade Processed | g/t | 5.5 | – | 14.5 | 8.1 | 10.8 | 9.6 | 11.3 | 10.8 | 6.6 | 5.6 | 5.8 |
| UG Gold Recovered | oz | 1,593 | – | 20 | 63 | 113 | 107 | 126 | 190 | 120 | 99 | 110 |
| OP Grade Processed | g/t | 2.2 | – | – | – | 5.0 | – | – | 2.7 | 2.9 | 2.8 | 2.2 |
| OP Gold Recovered | oz | 87 | – | – | – | 0 | – | – | 2 | 12 | 13 | 7 |
| Total Grade Processed | g/t | 5.1 | – | 14.5 | 8.1 | 10.7 | 9.6 | 11.3 | 10.5 | 5.9 | 5.0 | 5.3 |
| Total Gold Recovered | oz | 1,680 | – | 20 | 63 | 113 | 107 | 126 | 191 | 132 | 112 | 117 |
| Total | Yr 9 | Yr 10 | Yr 11 | Yr 12 | Yr 13 | Yr 14 | Yr 15 | Yr 16 | Yr 17 | Yr 18 | ||
| UG Grade Processed | g/t | 5.5 | 4.6 | 3.2 | 3.6 | 4.7 | 3.1 | 2.8 | 3.5 | 4.3 | 3.1 | 3.3 |
| UG Gold Recovered | oz | 1,593 | 80 | 52 | 71 | 94 | 60 | 57 | 71 | 87 | 62 | 14 |
| OP Grade Processed | g/t | 2.2 | 2.3 | 2.0 | 1.8 | 1.2 | 1.9 | 1.9 | 1.9 | 1.9 | 1.9 | – |
| OP Gold Recovered | oz | 87 | 12 | 12 | 5 | 3 | 6 | 4 | 4 | 4 | 3 | – |
| Total Grade Processed | g/t | 5.1 | 4.1 | 2.9 | 3.4 | 4.3 | 3.0 | 2.8 | 3.3 | 4.1 | 3.0 | 3.3 |
| Total Gold Recovered | oz | 1,680 | 91 | 64 | 75 | 97 | 66 | 61 | 75 | 91 | 65 | 14 |
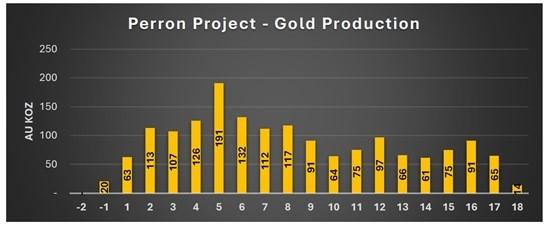
Figure 3: Gold Production per Year
Infrastructure
The Project is approximately 6.5 kilometers from the town of Normétal, Quebec and is accessible via a well-maintained forestry road. The Project will require construction of the supporting infrastructure items, such as:
Phase 1
– Gatehouse and service and haulage roads;
– Temporary buildings to be used by the mining contractor (maintenance shop, warehouses, offices, dry, etc.);
– 6.5 kilometers of 25kV transmission line and an on-site substation;
– Surface water management facilities including final effluent water treatment plant, ditches, pond and pumping stations;
– Underground mine portal, mine ventilation systems (intake and exhaust) and waste dump and overburden storage facilities;
– Mineralized material loading facilities;
Phase 2
– 2,000 tpd process plant complex;
– Required infrastructures to pump the plant tailings to emptied open-pits;
– Maintenance shop;
– Administration building;
– Warehouse
– Additional surface water management facilities;
– Additional service and haulage roads;
These infrastructures and facilities will require different authorizations and permits prior to being built and operated. No camp will be required considering the nearby qualified labor pool.
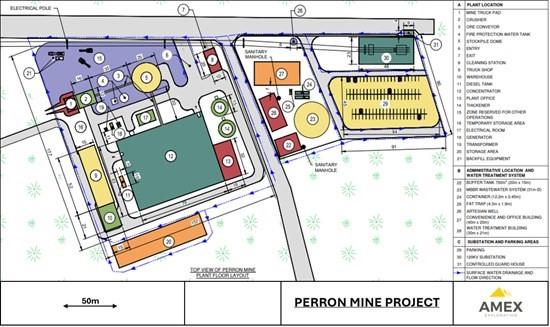
Figure 4: Suggested Infrastructure Arrangement
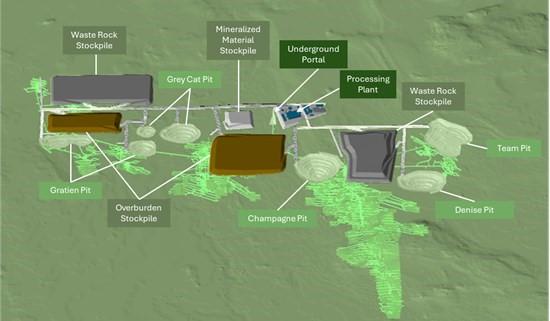
Figure 5: General site arrangement
Workforce
During steady state operations, the number of employees (mine, process plant and G&A) is expected to peak at 272 people during Phase 1 of mine operation and at 335 people during Phase 2, including contractors (open pit mining, underground mining, contract services, etc.).
Tailings
During Phase 1, the tailings will be managed off-site at the toll mill facility. During Phase 2, the tailings storage plan will take advantage of open pits that will be mined in the first 13 years of mine operations. Process plant rejects will be thickened and pumped to the mined-out pits sequentially for permanent storage. Tailings will then consolidate over time and excess water will either be used for processing requirements or discharged to the environment once quality conditions are met. This concept aims to limit the environmental impact of the Perron Project, to limit the risks related to traditional Tailings Management Facility (TMF) stability, to simplify short-term and long-term monitoring and to greatly reduce the capital and operating costs related to tailings management.
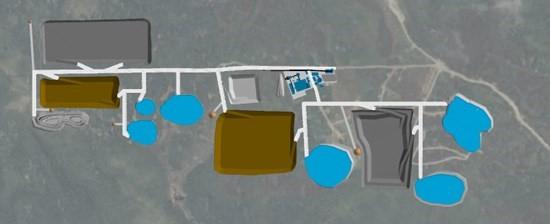
Figure 6: Visual of in-pit tailings disposal
Capital Expenditure
The total initial construction capital expenditure, which is to bring Phase 1 of the Project into operation, is estimated at $146.1M, which will be partially offset from $68.6M in pre-production gold sales credits for an initial net CAPEX of $77.5M. It accounts for site development, the construction of a 25kV powerline connecting to the existing electrical substation in Normétal and the initial development of the underground mine. The Initial CAPEX estimate includes $7.4M of EPCM and indirect costs and a contingency of $9.2M.
The total growth capital expenditure, to bring Phase 2 of the Project into operation, is estimated at $191.6M. It includes the costs of building a 2,000 tpd mill on site and acquiring an underground mobile equipment fleet. It also accounts for further site development, including a truck shop, warehouse and an administration facility. Additionally, the Growth CAPEX estimate includes $30.5M of EPCM and indirect costs and a contingency of $22.3M.
The Sustaining CAPEX is estimated to be $386.3M, including $11.4M of closure and rehabilitation costs. Underground mining SUSEX is earmarked for mining development, additional equipment, replacement units, and major repairs. Other SUSEX captures in-pit tailings storage, infrastructure and G&A.
Quotations from reputable suppliers were obtained for most of the large and high-cost equipment required for the plant, mine and site infrastructure. For other equipment and supplies, cost estimates were based on comparable projects, historical data or derived through consultants’ in-house databases.
Table 6: Capital Expenditures
| Item | Unit | Phase 1 | Phase 22 | Sustaining | Total |
| Site Preparation | CA$M | 3.0 | 5.7 | – | 8.7 |
| Infrastructure | CA$M | 6.0 | 13.2 | 0.6 | 19.8 |
| Power & Electrical | CA$M | 6.7 | 4.3 | – | 11.0 |
| Water Management | CA$M | 9.6 | 6.0 | – | 15.6 |
| Process Plant | CA$M | – | 61.8 | – | 61.8 |
| Mining Fleet | CA$M | 5.1 | 44.8 | 47.3 | 97.2 |
| Underground Development | CA$M | 46.4 | – | 316.2 | 362.7 |
| Tailings Management | – | 3.0 | 10.8 | 13.8 | |
| Closure and Rehabilitation | CA$M | – | – | 11.4 | 11.4 |
| Pre-production OPEX | CA$M | 52.6 | – | – | 52.6 |
| Indirects | CA$M | 7.4 | 30.5 | – | 40.9 |
| Contingency | CA$M | 9.2 | 22.3 | – | 42.3 |
| Sub-Total | CA$M | 146.1 | 191.6 | 386.3 | 724.0 |
| Pre-Production Revenues1 | CA$M | -68.6 | -68.6 | ||
| Total | CA$M | 77.5 | 191.6 | 386.3 | 655.4 |
Notes
1 Consists of mineralized material mined and sold during the pre-production period, ie., before the mined is developed at a point where a constant mining rate of 600 tonnes per day is sustainable (60% of the planned rate of 1,000 tonnes per day).
2 Phase 2 CAPEX represents the investment needed to build a processing plant on site and to increase the mining rate at 2,000 tonnes per day.
Operating Costs
LOM total operating cost is estimated at US$891 per ounce of gold produced, as summarized below. The LOM total AISC is estimated to be US$1,061 per ounce of gold produced based on a total gold production of 1,660,000 ounces over the 17.5 years of mine life. This cost structure places the Project in the bottom quartile of the global gold cost curve, which is mostly due to the high-grade nature of the mineralized material and to the simplicity of mining.
Table 8: Operating Costs
| Item | Phase 1 | Phase 2 | LOM | |||
| CA$M | US$/Au oz | CA$M | US$/Au oz | CA$M | US$/Au oz | |
| Mining Cost (UG + OP) | 318.2 | 567 | 927.5 | 540 | 1,245.6 | 547 |
| Off-Site Transport | 53.2 | 95 | – | – | 53.1 | 23 |
| Off-Site Processing | 82.4 | 147 | – | – | 82.4 | 36 |
| On-Site Processing | – | – | 277.9 | 162 | 277.9 | 122 |
| Water Management | 1.3 | 2 | 7.1 | 4 | 8.4 | 4 |
| General and Administration | 50.6 | 90 | 217.8 | 127 | 268.4 | 118 |
| Selling Costs | 2.3 | 4 | 6.9 | 4 | 9.2 | 4 |
| Royalty (1.5%) | 21 | 37 | 64.2 | 37 | 85.3 | 37 |
| Total Operating Costs | 529.0 | 943 | 1,501.4 | 874 | 2,030.4 | 891 |
| Sustaining Capital | 125 | 222 | 261.7 | 152 | 386.3 | 170 |
| All-in Sustaining Costs (”AISC”) | 653.6 | 1,165 | 1,763.1 | 1,027 | 2,416.7 | 1,061 |
Table 8: Unit Operating Costs
| Item | Unit | Phase 1 | Phase 2 |
| Underground Mining | CA$t/mined | 199.1 | 97.2 |
| Open-Pit Mining | CA$t/mined | 9.6 | 10.0 |
| Off-Site Transport | CA$t/milled | 40.0 | – |
| Crushing & Off-Site Processing | CA$t/milled | 62.0 | – |
| On-Site Processing | CA$t/milled | – | 29.4 |
| Water Management | CA$t/milled | 1.0 | 0.8 |
| General & Administration | CA$t/milled | 38.1 | 23.0 |
| Selling Costs | CA$t/milled | 1.7 | 0.7 |
| Royalty (1.5%) | CA$t/milled | 15.8 | 6.8 |
Financial Analysis
At base case gold price of US$2,500/oz and exchange rate of 1.38, the Project generates a post-tax Net Present Value of $1,085M using 5% discount rate and a post-tax Internal Rate of Return of 70.1% with a payback period of 1.4 years from the commencement of commercial production. The Project generates cumulative post-tax free cash flow of $1,768M over the 17.5-year production period. Total taxes payable over LOM at the base case gold price is $1,243M.
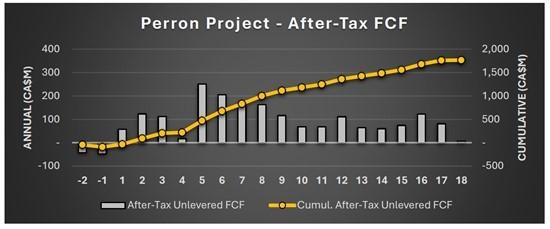
Figure 7: After-Tax FCF
The PEA financial economic analysis is significantly influenced by gold prices. At spot prices of US$3,400/Au oz and exchange rate of 1.38, the Project generates an after-tax NPV of $1,841M and an after-tax IRR of 107.6% with a payback period of 0.4 years. A sensitivity analysis was performed on the gold price, operating costs, total CAPEX and Phase 1 off-site transport and processing.
Table 9: Sensitivity Analysis
Gold price sensitivity
| Variation | Gold price (US$/oz) |
Post-tax NPV (CA$M) |
Post-tax IRR |
Post-tax Payback period (years) |
| -40% | 1,500 | 219 | 20.7% | 5.1 |
| -20% | 2,000 | 659 | 47.0% | 2.0 |
| 0% | 2,500 | 1,085 | 70.1% | 1.4 |
| +20% | 3,000 | 1,507 | 91.5% | 0.9 |
| +40% | 3,500 | 1,924 | 111.5% | 0.3 |
| +60% | 4,000 | 2,340 | 130.6% | 0.2 |
Operating costs sensitivity
| Variation | LOM average operating costs (CA$/tonne milled) |
Post-tax NPV (CA$M) |
Post-tax IRR |
Post-tax Payback period (years) |
| -40% | 112.83 | 1,354 | 82.8% | 1.1 |
| -30% | 131.64 | 1,288 | 79.7% | 1.2 |
| -20% | 150.45 | 1,221 | 76.6% | 1.3 |
| -10% | 169.25 | 1,153 | 73.4% | 1.3 |
| 0% | 188.06 | 1,085 | 70.1% | 1.4 |
| +10% | 206.86 | 1,016 | 66.8% | 1.5 |
| +20% | 225.67 | 948 | 63.4% | 1.6 |
| +30% | 244.47 | 879 | 59.8% | 1.7 |
| +40% | 263.28 | 811 | 56.1% | 1.9 |
Capital expenditures sensitivity
| Variation | Total capital expenditures (CA$M) |
Post-tax NPV (CA$M) |
Post-tax IRR |
Post-tax Payback period (years) |
| -40% | 393.2 | 1,201 | 102.1% | 0.9 |
| -30% | 458.8 | 1,173 | 91.9% | 1.1 |
| -20% | 524.3 | 1,143 | 83.4% | 1.2 |
| -10% | 589.8 | 1,114 | 76.3% | 1.3 |
| 0% | 655.4 | 1,085 | 70.1% | 1.4 |
| +10% | 720.9 | 1,055 | 64.7% | 1.5 |
| +20% | 786.4 | 1,026 | 59.9% | 1.6 |
| +30% | 852.0 | 996 | 55.6% | 1.7 |
| +40% | 917.5 | 966 | 51.8% | 1.8 |
Phase 1 Transport and Toll Milling cost sensitivity
| Variation | Phase 1 Transport and Toll Milling Cost (CA$/tonne) |
Post-tax NPV (CA$M) |
Post-tax IRR |
Post-tax Payback period (years) |
| -40% | 61.20 | 1,110 | 73.3% | 1.3 |
| -30% | 71.40 | 1,104 | 72.5% | 1.3 |
| -20% | 81.60 | 1,097 | 71.7% | 1.4 |
| -10% | 91.80 | 1,091 | 70.9% | 1.4 |
| 0% | 102.00 | 1,085 | 70.1% | 1.4 |
| +10% | 112.20 | 1,079 | 69.3% | 1.4 |
| +20% | 122.40 | 1,072 | 68.5% | 1.4 |
| +30% | 132.60 | 1,066 | 67.7% | 1.4 |
| +40% | 142.80 | 1,060 | 67.0% | 1.5 |
Permitting and Environment
According to the Regulation respecting the environmental impact assessment and review of certain projects (chapter Q-2, r. 23.1, last updated on April 1 2025), work required for the operation of a new mine is included in the list of projects subject to the environmental impact assessment and review procedure (Schedule 1). In the regulation, a “mine” is defined as all the surface and underground infrastructures forming part of a mineral substance operation, except surface mineral substances within the meaning of the Mining Act (chapter M-13.1). The scope of the environmental impact assessment will be defined by the directive (guideline) issued by the Ministère de l’Environnement, de la Lutte contre les changements climatiques, de la Faune et des Parcs (MELCCFP) subsequent to the filing of the Project Notice by Amex, in accordance with section 31.2 of the Environment Quality Act (EQA).
An environmental and social scoping study is currently underway to identify the key environmental and social risks and issues associated with the project construction and operation and to more accurately define the scope of the environmental baseline studies required. The acquisition of baseline environmental knowledge on the Perron property began several years ago and is still ongoing today. The environmental baseline studies and early public consultations, help characterize the receiving environment and identify areas that are more ecologically or socially rich or sensitive. This information will be used as part of the environmental assessment process and the feasibility studies to further develop and optimize the project with the objective of ensuring the project environmental and social acceptability.
Once the environmental assessment and review procedure is completed and the project is approved, the various project components will require specific provincial and federal permits and authorizations. At the provincial level, this will include ministerial authorizations that must be electronically filed with the appropriate forms to comply with the EQA and the Regulation respecting the regulatory scheme applying to activities on the basis of their environmental impact (REAFIE) (Q-2, r. 17.1), the Mining Act (chapter M-13.1), as well as other provincial acts and regulations. At the federal level, some project components and impacts may require specific authorizations according to federal legal and regulatory framework, including authorizations under the Fisheries Act (R.S.C., 1985, c. F-14, the Metal and Diamond Mining Effluent Regulations (SOR/2002-222) and other federal acts and regulations.
Stakeholder Engagement
The aboriginal community affected by Amex’s activities is the Abitibiwinni First Nation which is an Algonquin First Nation residing primarily in the community of Pikogan in the Abitibi-Temiscamingue region. The Pikogan community, also called Abitibiwinni, is located three (3) kilometers from the town of Amos on the west bank of the Harricana River. The Perron project is located on a part of the ancestral territory of the Algonquin Anishinabeg Nation. A relationship of trust and respect has been built with the Abitibiwinni First Nation Council over the years through consistent transparency and consultation. With respect to local communities near the project, Normétal, Valcanton and Saint-Lambert are the main municipalities surrounding the Perron project.
Amex has always prioritized engaging stakeholders and implementing communication and consultation plans. Communication plans include a summary of the work completed on the property every six months as well as the company’s exploration and development plans for the coming months. Active community participation in the development and implementation of the project is one of Amex’s core values and aids in fostering good long-term relationships. Amex will continue consulting, supporting and informing all stakeholders at all stages of the project development. With this in mind, Ames aims to establish various working and consultation committees by the end of 2025.
Exploration Update
With the recent acquisition of the Perron West property (see press release dated March 25, 2025) quadrupling Amex’s land holdings along the Normétal-Burntbush greenstone belt, the Company’s exploration plans are significantly expanding to cover the vast, new area of prospective geology. Amex’s constant evolution of knowledge of the mineralization styles and structures with the Beaupré Block on Perron will provide invaluable insight into guiding exploration on the Company’s expanded land package.
Currently, Amex has multiple teams conducting surface exploration work on the 15,192-hectare Perron West project. Teams of technicians are completing large and widespread soil sampling programs to find and/or further define gold-in-soil anomalies, while teams of geologists are completing surface prospecting work, including mapping, grab sampling, structural measurements of outcrops, etc. The work is expected to be completed in the coming weeks, with the results to help further define the existing anomalies on the property and further solidify drill planning for a maiden program on Perron West in 2026.
In addition, structural geology specialists from consultant Norda Stelo are continuing work on a thoroughly detailed 3D lithostructural model on the Perron property. This project is nearing completion and will help guide drill planning for the remainder of the year and into 2026 at Perron. The outcomes from this model will also improve Amex’s understand and build upon a larger scaled regional structural framework, that will aid drill planning efforts on the Perron West property.
The Company will update the market with more in-depth details on drill planning for Perron in the near future.
Mineral Resource Estimate
The updated PEA was based on the NI 43-101 compliant Perron Project MRE, with an effective date of May 21, 2025 (please see the linked press release). The mineral resources that have flowed to the mine plan at Perron come from multiple zones, with major contributions from the Champagne, Denise, Team, Grey Cat and Gratien zones.
Table 1: Summary of total Mineral Resources at the Perron Project
| Zone | Class | OPEN PIT (CoG 0.40 gpt Au) | UNDERGROUND (CoG 1.40 gpt Au) | TOTAL | ||||||
| Tonnes | Au | Au | Tonnes | Au | Au | Tonnes | Au | Au | ||
| k | g/t | koz | k | g/t | koz | kt | g/t | koz | ||
| Total | Meas | 48 | 1.1 | 2 | 333 | 14.2 | 152 | 382 | 12.54 | 154 |
| Ind | 2,520 | 3.16 | 256 | 5,281 | 7.1 | 1,205 | 7,801 | 5.83 | 1,461 | |
| M&I | 2,569 | 3.12 | 258 | 5,614 | 7.52 | 1,357 | 8,183 | 6.14 | 1,615 | |
| Inf | 1,044 | 2.02 | 68 | 4,000 | 4.9 | 631 | 5,044 | 4.31 | 698 | |
Perron Gold project Mineral Estimate notes:
Further details regarding the 2025 updated Mineral Resource Estimate, key assumptions, parameters and methods used to estimate the Mineral Resources of the Perron Gold Project are available on SEDAR+ (www.sedarplus.ca) under the Corporation’s issuer profile in accordance with NI 43-101.
Qualified Persons
The qualified persons independent of the issuer, responsible for the technical information in this Press Release are Stephen Coates, P.Eng. of Evomine, Alexandre Burelle, P.Eng. of Evomine, Florent Baril, P.Eng. of Bumigeme, Antoine Yassa P.Geo. of P&E, Charles Spath, M.Sc., P.Geo. of P&E, Yungang Wu, M.Sc., P.Geo. of P&E, Eugene Puritch, P.Eng., FEC, CET of P&E, Denys Vermette, P.Geo. of Norda Stelo and Jérôme Augustin, Ph.D., P.Geo. of Laurentia Exploration. They declare that they have read this press release and that the scientific and technical information relating to the resource estimate and preliminary economic assessment presented therein are correct.
Hudbay Minerals Inc. (TSX:HBM) (NYSE: HBM) today released its ann... READ MORE
Strategic acquisition of an established operating gold mine, loca... READ MORE
Cerro de Pasco Resources Inc. (TSX-V: CDPR) (OTCQB: GPPRF) (FRA: ... READ MORE
The Garneau Titanium Project Features Ilmenite-Rich Boulder with ... READ MORE
ValOre Metals Corp. (TSX‐V: VO) (OTCQB: KVLQF) (Frankfurt: KEQ0... READ MORE


