


![]()
Growing production and margins drive record quarterly free cash flow of $130 million
Alamos Gold Inc. (TSX:AGI; NYSE:AGI) reported its financial results for the quarter ended September 30, 2025.
“We delivered a number of new financial records in the third quarter including record free cash flow of $130 million, while continuing to fund our high-return growth projects. This was driven by a further increase in production to 141,700 ounces and significant margin expansion,” said John A. McCluskey, President and Chief Executive Officer.
“Given unplanned downtime of the Magino mill at the end of September, and lower expected underground grades from Island Gold due to a seismic event in October, we are revising our 2025 production guidance lower by approximately 6%. These challenges are short-term and are not reflective of our strong outlook, nor our long-term track record. We expect a significant improvement starting in the fourth quarter with an 18% increase in production, and a 5% decrease in costs,” Mr. McCluskey added.
Third Quarter 2025 Operational and Financial Highlights
(1) Refer to the “Non-GAAP Measures and Additional GAAP Measures” section of this press release and associated MD&A for a description and calculation of these measures.
(2) Frequency rate is calculated as incidents per 200,000 hours worked.
Highlight Summary
| Three Months Ended September 30, | Nine Months Ended September 30, | |||
| 2025 | 2024 | 2025 | 2024 | |
| Financial Results (in millions) | ||||
| Operating revenues | $462.3 | $360.9 | $1,233.5 | $971.1 |
| Cost of sales(1) | $194.1 | $204.0 | $590.0 | $550.2 |
| Earnings from operations | $455.7 | $183.3 | $766.6 | $403.5 |
| Earnings before income taxes | $371.5 | $141.2 | $578.8 | $345.0 |
| Net earnings | $276.3 | $84.5 | $450.9 | $196.7 |
| Adjusted net earnings(2) | $155.5 | $78.1 | $359.5 | $225.7 |
| Adjusted earnings before interest, taxes, depreciation and amortization(2) |
$283.5 | $176.2 | $689.1 | $484.3 |
| Cash provided by operating activities before changes in working capital and taxes paid(2) | $275.3 | $192.8 | $639.6 | $518.3 |
| Cash provided by operating activities | $265.3 | $165.5 | $544.4 | $468.9 |
| Capital expenditures (sustaining)(2) | $34.8 | $32.7 | $95.1 | $80.1 |
| Sustaining finance leases(3) | $4.3 | $5.4 | $12.6 | $5.4 |
| Capital expenditures (growth)(2) | $83.3 | $67.9 | $221.2 | $178.3 |
| Capital expenditures (capitalized exploration) | $16.9 | $6.2 | $33.3 | $20.5 |
| Free cash flow(2)(3) | $130.3 | $87.5 | $194.8 | $218.8 |
| Operating Results | ||||
| Gold production (ounces) | 141,700 | 152,000 | 403,900 | 426,800 |
| Gold sales (ounces) | 136,473 | 145,204 | 389,083 | 418,976 |
| Per Ounce Data | ||||
| Average realized gold price(5) | $3,359 | $2,458 | $3,144 | $2,294 |
| Average spot gold price (London PM Fix) | $3,457 | $2,475 | $3,201 | $2,296 |
| Cost of sales per ounce of gold sold (includes amortization)(1) |
$1,422 | $1,405 | $1,516 | $1,313 |
| Total cash costs per ounce of gold sold(2) | $973 | $984 | $1,065 | $909 |
| All-in sustaining costs per ounce of gold sold(2) | $1,375 | $1,359 | $1,499 | $1,226 |
| Share Data | ||||
| Earnings per share, basic | $0.66 | $0.20 | $1.07 | $0.49 |
| Earnings per share, diluted | $0.65 | $0.20 | $1.07 | $0.48 |
| Adjusted earnings per share, basic(2) | $0.37 | $0.19 | $0.86 | $0.56 |
| Weighted average common shares outstanding (basic) (000’s) | 420,500 | 417,147 | 420,463 | 404,127 |
| Financial Position (in millions) | ||||
| Cash and cash equivalents(4) | $463.1 | $327.2 | ||
| Three Months Ended September 30, | Nine Months Ended September 30, | |||
| 2025 | 2024 | 2025 | 2024 | |
| Gold production (ounces) | ||||
| Island Gold District(7) | 66,800 | 57,300 | 190,400 | 132,400 |
| Young-Davidson | 37,900 | 44,200 | 112,000 | 128,300 |
| Mulatos District(8) | 37,000 | 50,500 | 101,500 | 166,100 |
| Gold sales (ounces) | ||||
| Island Gold District(7) | 62,011 | 53,445 | 179,357 | 127,341 |
| Young-Davidson | 37,406 | 42,966 | 111,095 | 127,833 |
| Mulatos District(8) | 37,056 | 48,793 | 98,631 | 163,802 |
| Cost of sales (in millions)(1) | ||||
| Island Gold District(7) | $83.4 | $71.9 | $251.2 | $136.0 |
| Young-Davidson | $65.2 | $63.9 | $195.5 | $196.0 |
| Mulatos District(8) | $45.5 | $68.2 | $143.3 | $218.2 |
| Cost of sales per ounce of gold sold (includes amortization)(1) | ||||
| Island Gold District(7) | $1,345 | $1,345 | $1,401 | $1,068 |
| Young-Davidson | $1,743 | $1,487 | $1,760 | $1,533 |
| Mulatos District(8) | $1,228 | $1,398 | $1,453 | $1,332 |
| Total cash costs per ounce of gold sold(2) | ||||
| Island Gold District(7) | $964 | $988 | $1,002 | $758 |
| Young-Davidson | $1,200 | $1,033 | $1,248 | $1,080 |
| Mulatos District(8) | $761 | $937 | $971 | $892 |
| Mine-site all-in sustaining costs per ounce of gold sold(2)(3) | ||||
| Island Gold District(7) | $1,432 | $1,405 | $1,420 | $1,137 |
| Young-Davidson | $1,476 | $1,406 | $1,555 | $1,358 |
| Mulatos District(8) | $831 | $1,002 | $1,045 | $954 |
| Capital expenditures (sustaining, growth, and capitalized exploration) (in millions)(2) | ||||
| Island Gold District(4)(7)(9) | $92.8 | $76.5 | $239.5 | $187.2 |
| Young-Davidson(5) | $20.2 | $25.6 | $60.4 | $64.8 |
| Mulatos District(6)(8) | $11.2 | $3.1 | $18.9 | $14.8 |
| Other | $15.1 | $7.0 | $43.4 | $17.5 |
Environment, Social and Governance Summary Performance
Health and Safety
Alamos strives to maintain a safe, healthy working environment for all, with a strong safety culture where everyone is continually reminded of the importance of keeping themselves and their colleagues healthy and injury-free. The Company’s overarching commitment is to have all employees and contractors return Home Safe Every Day.
Environment
All five reportable spills were promptly addressed at the time of occurrence, and are not expected to have any lasting impact on the natural environment. The effluent exceedance was due to elevated nitrate concentrations in the open pit water at the Magino mine, which is in the process of being addressed with no impact to the environment.
The Company is committed to preserving the long-term health and viability of the natural environment that surrounds its operations and projects. This includes investing in new initiatives to reduce the Company’s environmental footprint with the goal of minimizing the impacts of its activities.
Community
Alamos continued to provide charitable donations, sponsorships, medical support and infrastructure investments within its local communities, including:
The Company believes that excellence in sustainability provides a net benefit to all stakeholders. The Company continues to engage with local communities to understand local challenges and priorities. Ongoing investments in local infrastructure, health care, education, cultural and community programs remain a focus of the Company.
Governance and Disclosure
The Company maintains the highest standards of corporate governance to ensure that corporate decision-making reflects its values, including the Company’s commitment to sustainable development.
(1) Frequency rate is calculated as incidents per 200,000 hours worked.
Outlook and Strategy
|
2025 Guidance(4) |
|||||
| Island Gold District | Young-Davidson | Mulatos District | Lynn Lake | Total | |
| Gold production(000’s ounces) | 260 – 270 | 160 – 165 | 140 – 145 | — | 560 – 580 |
| Previous gold production (000’s ounces) | 275 – 300 | 175 – 190 | 130 – 140 | — | 580 – 630 |
| Cost of sales, including amortization(in millions)(3) | $865 | ||||
| Total cash costs($ per ounce)(1) | $875 – $925 | $1,150 – $1,200 | $925 – $975 | — | $975 – $1,025 |
| All-in sustaining costs($ per ounce)(1)(2) | $1,225 – $1,275 | $1,550 – $1,600 | $1,025 – $1,075 | — | $1,400 – $1,450 |
| Capital expenditures(in millions) | |||||
| Sustaining capital(1) | $80 – $85 | $55 – $60 | $3 – $5 | — | $138 – $150 |
| Growth capital(1) | $270 – $300 | $15 – $20 | $17 – $20 | $60 – $70 | $362 – $410 |
| Previous growth capital(1) | $270 – $300 | $15 – $20 | $37 – $40 | $100 – $120 | $422 – $480 |
| Total sustaining and growth capital(1) | $350 – $385 | $70 – $80 | $20 – $25 | $60 – $70 | $500 – $560 |
| Previous total sustaining and growth capital(1) | $350 – $385 | $70 – $80 | $40 – $45 | $100 – $120 | $560 – $630 |
| Capitalized exploration(1) | $20 | $9 | $6 | $4 | $39 |
| Total capital expenditures and capitalized exploration(1) | $370 – $405 | $79 – $89 | $26 – $31 | $64 – $74 | $539 – $599 |
| Previous total capital expenditures and capitalized exploration(1) | $370 – $405 | $79 – $89 | $46 – $51 | $104 – $124 | $599 – $669 |
(1) Refer to the “Non-GAAP Measures and Additional GAAP” section of this press release and associated MD&A for a description of these measures.
(2) Total consolidated all-in sustaining costs include corporate and administrative, and share-based compensation expenses. Individual mine-site all-in sustaining costs do not include an allocation of corporate and administrative expense, and corporate share-based compensation expenses.
(3) Cost of sales includes mining and processing costs, royalties, amortization expense, and silver by-product credits, and is calculated based on the mid-point of total cash costs guidance.
(4) Initial annual guidance was issued on January 13, 2025. Cost guidance was revised on July 30, 2025, and production and capital guidance was revised on October 29, 2025.
The Company’s objective is to operate a sustainable business model that supports growing returns to all stakeholders over the long-term, through growing production, expanding margins, and increasing profitability. This includes a balanced approach to capital allocation focused on generating strong ongoing free cash flow while re-investing in high-return internal growth opportunities, and supporting higher returns to shareholders.
Third quarter production increased 3% from the second quarter to 141,700 ounces driven by stronger performances from Mulatos and the Island Gold District. This was slightly below the low end of quarterly guidance of 145,000 ounces reflecting one week of unplanned downtime within the Magino mill during the last week of September due to a capacitor failure within the electrical house, which impacted the electrical drive for the SAG and Ball mills. The capacitor and electrical drive module were replaced at the end of September following which milling rates have continued to improve, approaching 10,000 tonnes per day for the month of October.
Reflecting the unplanned downtime of the Magino mill, the Island Gold mill was restarted on September 24th focused on processing the higher grade Island Gold ore. Given the higher gold price environment, the Company will continue operating the Island Gold mill through the remainder of the year, in addition to the Magino mill. This will provide increased combined milling capacity from the Island Gold District, supporting additional gold production, higher cash flow, and increased profitability. The Company will evaluate the ongoing operation of the Island Gold mill into 2026 as part of the expansion study which is expected to be completed in the first quarter of 2026.
Total cash costs decreased 9% from the second quarter to $973 per ounce, and AISC decreased 7%, both consistent with quarterly guidance and driven by the improved performance from the Mulatos District. Higher gold production, lower total cash costs, and the rising gold price, all contributed to a number of new financial records. This included record quarterly revenues of $462.3 million, and cash flow from operations of $265.3 million. Free cash flow also increased to a new record of $130.3 million while continuing to reinvest in high-return growth that will support a more substantial increase in the years ahead.
Subsequent to quarter end, a seismic event occurred underground at Island Gold on October 17, 2025. Mining activities continue at budgeted rates; however, this has deferred access to higher grade stopes in one mining front. This is expected to result in lower grades mined in the fourth quarter than budgeted. Combined with the unplanned downtime of the Magino mill at the end of September, the Company is updating its annual production guidance to a range of 560,000 to 580,000 ounces, a 6% decrease from original guidance (based on the mid-point).
Fourth quarter production is expected to increase 18% (based on the mid-point) to between 157,000 and 177,000 ounces, the strongest quarter of the year. This is expected to be driven by an increase in tonnes and grades processed at Young-Davidson, higher tonnes processed at the Magino mill, and the recovery of higher-grade ore stacked during the second and third quarters at La Yaqui Grande. All three operations are on track to deliver an increase in production in the fourth quarter at lower costs compared to the third quarter.
Reflecting the stronger expected production and improved performances from all three operations, total cash costs and AISC are expected to decrease 5% in the fourth quarter. The Company remains on track to achieve annual total cash cost and AISC guidance, which was revised in July.
This strong trend of growing production and declining costs is expected over the next several years, driven by low-cost growth from the Company’s pipeline of high-return development projects. The Phase 3+ Expansion at Island Gold is expected to be a significant driver of near-term production growth and further decrease in costs in 2026. The expansion continues to progress well with the shaft sink advancing to a depth of 1,350 m, or 98% of its ultimate planned depth. The Phase 3+ mill expansion and paste plant are also advancing with the overall expansion expected to be completed in the second half of 2026, as previously guided. As outlined in the Base Case Life of Mine Plan (“Base Case LOM Plan”) for the Island Gold District announced in June 2025, the expansion is expected to transform the operation into one of the largest, lowest-cost, and most profitable gold mines in Canada with significant upside potential.
Post completion of the Phase 3+ Expansion, production from the Island Gold District is expected to increase to average 411,000 ounces per year at mine-site AISC of $915 per ounce over the initial 12 years (refer to the press release dated June 23, 2025 for more details). This is expected to drive consolidated production to a range of 680,000 to 730,000 ounces in 2027, a 24% increase from the mid-point of revised 2025 guidance, at 18% lower AISC. A further increase in production and decrease in costs is expected with the startup of production from Lynn Lake. With average annual production of 176,000 ounces over its first 10 years at first quartile mine-site AISC, Lynn Lake is expected to increase consolidated production to approximately 900,000 ounces per year.
Given the impact of wildfires and evacuation orders on communities across northern Manitoba that lasted until the end of September, the ramp up of construction activities on the Lynn Lake project that had been planned for 2025 has been delayed. With the evacuation order lifted, the project team will continue returning to Lynn Lake over the coming weeks with limited construction activities to be completed ahead of and during the winter months. As a result, the more cost effective and lower risk approach is a ramp up of construction activities in the spring of 2026, with completion of the Lynn Lake project now expected in the first half of 2029, compared with the previous timeline of the second half of 2028. The Company has updated its consolidated 2025 capital guidance to between $539 and $599 million, a 10% decrease from previous capital guidance, mainly reflecting the change in timing of activities at Lynn Lake.
Longer term, there is excellent potential to increase consolidated production to approximately one million ounces per year through a further expansion of the Island Gold District. The Expansion Study for the Island Gold District is scheduled to be released in the first quarter of 2026 and is expected to demonstrate the significant upside potential to the Base Case LOM Plan. The timeline of completion has shifted from the fourth quarter of 2025 to ensure all assays are included from recent delineation drilling to support further Mineral Reserve growth. The Expansion Study is expected to include a larger Mineral Reserve, through ongoing Mineral Resource conversion, and will evaluate a potential expansion of the mill to between 18,000 and 20,000 tpd, supporting higher underground mining rates from Island Gold, and open pit mining and processing rates from Magino.
The Company remains well positioned to fund its high-return growth projects internally with strong ongoing free cash flow, $463.1 million of cash and cash equivalents at the end of the third quarter of 2025, and $963.1 million of total liquidity. Subsequent to quarter end, the Company closed the sale of its Turkish development projects and Quartz Mountain, providing cash of $163 million, with additional payments to be received in future years. With a growing cash balance of more than $600 million, the Company expects to reduce existing debt obligations, and will assess opportunities to be active on its share buyback. At current gold prices, the Company expects to continue generating strong free cash flow while funding its growth projects, with significant increases following the completion of the Phase 3+ Expansion in 2026, PDA in 2027, and Lynn Lake in 2029.
Third Quarter 2025 Results
Island Gold District Financial and Operational Review
| Three Months Ended September 30, | Nine Months Ended September 30, | |||
| 2025 | 2024 | 2025 | 2024 | |
| Gold production (ounces) | 66,800 | 57,300 | 190,400 | 132,400 |
| Gold sales (ounces) | 62,011 | 53,445 | 179,357 | 127,341 |
| Financial Review (in millions) | ||||
| Operating Revenues | $213.0 | $132.1 | $575.8 | $296.2 |
| Cost of sales(1) | $83.4 | $71.9 | $251.2 | $136.0 |
| Earnings from operations | $128.6 | $58.6 | $320.8 | $155.9 |
| Cash provided by operating activities | $160.9 | $62.1 | $370.5 | $173.8 |
| Capital expenditures (sustaining)(2) | $23.9 | $16.2 | $59.5 | $41.9 |
| Lease payments (sustaining)(2),(5) | $4.3 | $5.4 | $12.6 | $5.4 |
| Capital expenditures (growth)(2) | $59.5 | $51.1 | $153.3 | $129.2 |
| Capital expenditures (capitalized exploration)(2) | $5.1 | $3.8 | $14.1 | $10.7 |
| Mine-site free cash flow(2),(5) | $72.4 | ($9.0) | $143.6 | ($8.0) |
| Cost of sales, including amortization per ounce of gold sold(1) | $1,345 | $1,345 | $1,401 | $1,068 |
| Total cash costs per ounce of gold sold(2) | $964 | $988 | $1,002 | $758 |
| Mine-site all-in sustaining costs per ounce of gold sold(2),(3) | $1,432 | $1,405 | $1,420 | $1,137 |
| Island Gold Mine | ||||
| Underground Operations | ||||
| Tonnes of ore mined | 121,864 | 82,132 | 345,272 | 283,706 |
| Tonnes of ore mined per day | 1,325 | 893 | 1,265 | 1,035 |
| Average grade of gold(4) | 12.05 | 14.61 | 11.69 | 12.92 |
| Metres developed | 1,779 | 1,338 | 6,058 | 4,713 |
| Island Gold Mill Operations(9) | ||||
| Tonnes of ore processed | 23,906 | 82,446 | 234,174 | 282,364 |
| Tonnes of ore processed per day | 1,087 | 896 | 1,154 | 1,031 |
| Average grade of gold(4) | 13.20 | 14.42 | 12.03 | 12.97 |
| Contained ounces milled | 10,148 | 38,218 | 90,578 | 117,764 |
| Average recovery rate | 99% | 99% | 98% | 98% |
| Magino Mine | ||||
| Open Pit Operations | ||||
| Tonnes of ore mined – open pit(7) | 1,622,689 | 818,237 | 3,938,588 | 818,237 |
| Tonnes of ore mined per day | 17,638 | 10,228 | 14,427 | 10,228 |
| Total waste mined – open pit(8) | 3,764,681 | 2,882,392 | 11,104,219 | 2,882,392 |
| Total tonnes mined – open pit | 5,387,370 | 3,700,629 | 15,042,807 | 3,700,629 |
| Waste-to-ore ratio(8) | 2.32 | 4.52 | 2.82 | 4.52 |
| Average grade of gold(4) | 0.84 | 0.90 | 0.81 | 0.90 |
| Magino Mill Operations(10) | ||||
| Tonnes of ore processed | 776,796 | 550,475 | 2,210,908 | 550,475 |
| Tonnes of ore processed per day | 8,443 | 6,881 | 8,099 | 6,881 |
| Average grade of gold processed(4) | 2.28 | 0.92 | 1.42 | 0.92 |
| Contained ounces milled | 56,923 | 16,370 | 101,000 | 16,370 |
| Average recovery rate | 96% | 95% | 95% | 95% |
(1) Cost of sales includes mining and processing costs, royalties, and amortization.
(2) Refer to the “Non-GAAP Measures and Additional GAAP Measures” section of this press release and associated MD&A for a description and calculation of these measures.
(3) For the purposes of calculating mine-site all-in sustaining costs, the Company does not include an allocation of corporate and administrative expense and corporate share-based compensation expense.
(4) Grams per tonne of gold.
(5) Mine-site free cash flow does not include lease payments which are classified as cash flows used in financing activities on the condensed interim consolidated financial statements.
(6) Comparative figures reflect the inclusion of the Magino Mine as of its acquisition on July 12, 2024.
(7) Includes ore stockpiled during the periods.
(8) Total waste mined includes operating waste and capitalized stripping.
(9) The Island Gold mill operated for 22 days during the quarter. It was on care and maintenance from July 16 to September 23, 2025, during which time all Island Gold ore was processed at the Magino mill. Island Gold mill average tpd reflects only active operating days.
(10) Magino mill results include Island Gold ore processed at Magino mill from July 16 through September 23, 2025.
The Island Gold District produced 66,800 ounces in the third quarter of 2025, a 17% increase from the prior year period reflecting higher tonnes processed. Production is expected to increase in the fourth quarter driven by an increase in total tonnes processed between the Island Gold and Magino mills.
Island Gold Operational Review
Underground mining rates averaged 1,325 tpd in the third quarter, a 48% increase over the prior year period and 7% increase from the second quarter. Grades mined averaged 12.05 g/t Au, consistent with annual guidance and 18% lower than in the prior year period.
Subsequent to quarter end, a seismic event occurred underground at Island Gold on October 17, 2025. Mining rates are expected to be within guided levels for the fourth quarter; however, this has delayed access to higher grade stopes within one mining front. As a result, grades mined are expected to be lower than budgeted in the fourth quarter, contributing to reduced 2025 production guidance.
In mid-July, the Island Gold mill was shut down as part of the long-term plan to transition to processing higher-grade underground ore within the larger Magino mill. The transition was successful with recoveries of the higher-grade and blended ore consistent with expectations, and milling rates continuing to increase through the quarter until the last week of September when a capacitor failure resulted in one week of unplanned downtime. Given the downtime, the decision was made to restart the Island Gold mill to both provide additional milling capacity within the Island Gold District, and capitalize on the higher gold price environment. Island Gold mill processed a total of 23,906 tonnes of underground ore in the 22 active operating days.
The operation of both the Island Gold and Magino mills will support additional gold production, higher cash flow, and increased profitability. Given the higher gold price environment, the Island Gold mill will be operated through the remainder of the year. The Company is evaluating the ongoing operation of the Island Gold mill into 2026 as part of the Expansion Study which is expected to be completed in the first quarter of 2026.
Magino Operational Review
Total mining rates averaged 58,558 tpd during the third quarter, including 17,638 tpd of ore, up 4% and 28%, respectively, from the second quarter. Mining rates and grades mined of 0.84 g/t Au were both consistent with annual guidance.
Magino milling rates steadily improved subsequent to the installation of a redesigned liner and bolt configuration within the SAG mill, which was completed during the second week of July. For the full third quarter, milling rates averaged 8,443 tpd. Post liner change, and excluding the impact of the downtime at the end of September, milling rates averaged approximately 9,200 tpd for the quarter, a nearly 10% increase from the second quarter.
During the last week of September, a capacitor failure within the electrical house impacted the electrical drive for the SAG and Ball mills, resulting in one-week of unplanned downtime within the Magino mill. The capacitor and electrical drive module were replaced by the end of September following which milling rates have continued to improve, approaching 10,000 tpd for the month of October. Milling rates are expected to continue increasing further through the fourth quarter. A further review of electrical components was completed, which will supplement other critical spares that are already on site to minimize potential unplanned downtime within the Magino mill in future.
Combined grades from underground and open pit ore processed during the third quarter was 2.28 g/t Au, consistent with guidance.
Island Gold District Financial Review
Revenues of $213.0 million in the third quarter were 61% higher than the prior year period, driven by higher realized gold prices and an increase in ounces sold reflecting higher tonnes processed from the Island Gold District. Similarly, revenues of $575.8 million during the first nine months of the year were 94% higher than the prior year period, primarily due to higher realized gold prices and increased ounces sold given the acquisition of Magino in July 2024.
Cost of sales of $83.4 million in the third quarter and $251.2 million for the first nine months of the year were 16% and 85% higher than the comparative periods, respectively, due to the increase in ounces sold. On a per ounce basis, cost of sales in the third quarter were consistent with the prior year period, but increased by 31% for the first nine months of the year, reflecting the inclusion of relatively higher cost ounces from Magino since July 2024.
Total cash costs were $964 per ounce and mine-site AISC were $1,432 per ounce in the third quarter. AISC was slightly higher than the prior year period driven by higher sustaining capital. For the first nine months of the year, total cash costs of $1,002 per ounce and mine-site AISC of $1,420 per ounce were above the revised annual guidance range, driven by lower mill throughput at Magino, and higher royalty expense, which was impacted by increases in realized gold prices during the third quarter. Costs are expected to trend lower into the fourth quarter reflecting higher combined milling rates from the Magino and Island Gold mills, driving higher gold production.
Total capital expenditures were $83.4 million in the third quarter, including $45.6 million of growth capital and $5.1 million of capitalized exploration. Capital spending is expected to increase in the fourth quarter to be consistent with guidance. Growth capital spending remained primarily focused on the Phase 3+ Expansion, including shaft site infrastructure, paste plant, and shaft sinking. The shaft sink advanced to a depth of 1,350 m at the end of the third quarter, 98% of its ultimate planned depth. The shaft sink is scheduled to be completed early 2026, with initial production from the shaft infrastructure expected in the second half of 2026. The expansion of the Magino mill to 12,400 tpd is expected to be completed in the second half of 2026, to coincide with the completion of the Phase 3+ Expansion at Island Gold.
Island Gold District generated record mine-site free cash flow of $72.4 million in the third quarter and $143.6 million in the first nine months of the year, net of the significant capital investment related to the Phase 3+ Expansion and exploration. At current gold prices, the Island Gold District is expected to continue to generate strong free cash flow while funding the Phase 3+ Expansion and a robust exploration program, with significant free cash flow growth expected in 2026 onwards following the completion of the expansion.
Young-Davidson Financial and Operational Review
| Three Months Ended September 30, | Nine Months Ended September 30, | |||
| 2025 | 2024 | 2025 | 2024 | |
| Gold production (ounces) | 37,900 | 44,200 | 112,000 | 128,300 |
| Gold sales (ounces) | 37,406 | 42,966 | 111,095 | 127,833 |
| Financial Review (in millions) | ||||
| Operating Revenues | $130.0 | $106.0 | $357.3 | $294.8 |
| Cost of sales(1) | $65.2 | $63.9 | $195.5 | $196.0 |
| Earnings from operations | $64.6 | $98.4 | $159.7 | $153.8 |
| Cash provided by operating activities | $82.5 | $61.5 | $220.6 | $155.4 |
| Capital expenditures (sustaining)(2) | $10.2 | $15.8 | $33.8 | $35.1 |
| Capital expenditures (growth)(2) | $5.8 | $8.3 | $17.5 | $25.8 |
| Capital expenditures (capitalized exploration)(2) | $4.2 | $1.5 | $9.1 | $3.9 |
| Mine-site free cash flow(2) | $62.3 | $35.9 | $160.2 | $90.6 |
| Cost of sales, including amortization per ounce of gold sold(1) | $1,743 | $1,487 | $1,760 | $1,533 |
| Total cash costs per ounce of gold sold(2) | $1,200 | $1,033 | $1,248 | $1,080 |
| Mine site all-in sustaining costs per ounce of gold sold(2),(3) | $1,476 | $1,406 | $1,555 | $1,358 |
| Underground Operations | ||||
| Tonnes of ore mined | 667,801 | 663,295 | 1,930,719 | 2,047,922 |
| Tonnes of ore mined per day | 7,259 | 7,210 | 7,072 | 7,474 |
| Average grade of gold(4) | 1.92 | 2.11 | 1.98 | 2.08 |
| Metres developed | 1,800 | 2,220 | 6,135 | 6,320 |
| Mill Operations | ||||
| Tonnes of ore processed | 720,933 | 668,058 | 1,959,516 | 2,059,483 |
| Tonnes of ore processed per day | 7,836 | 7,261 | 7,178 | 7,516 |
| Average grade of gold(4) | 1.79 | 2.07 | 1.94 | 2.07 |
| Contained ounces milled | 41,387 | 44,555 | 122,354 | 136,996 |
| Average recovery rate | 91% | 92% | 91% | 91% |
(1) Cost of sales includes mining and processing costs, royalties and amortization.
(2) Refer to the “Non-GAAP Measures and Additional GAAP Measures” section of this press release and associated MD&A for a description and calculation of these measures.
(3) For the purposes of calculating mine-site all-in sustaining costs, the Company does not include an allocation of corporate and administrative expense and corporate share-based compensation expense.
(4) Grams per tonne of gold.
Operational review
Young-Davidson produced 37,900 ounces of gold in the third quarter, similar to the second quarter with a 12% increase in milling rates offset by lower grades processed. Relative to the prior year period, production decreased 14%.
Mining rates averaged 7,259 tpd in the third quarter, below the annual guidance due to planned downtime of the Northgate shaft for maintenance. As previously guided, mining rates were impacted early in the quarter by a planned shutdown of the Northgate shaft in July for a scheduled replacement of the head ropes. Mining rates have since returned to guided levels, averaging approximately 8,000 tpd in September and October, and are expected to remain at similar levels through the rest of the year.
Milling rates averaged 7,836 tpd in the third quarter, a 12% improvement from the second quarter and an 8% increase compared to the prior year period. Given the lower underground mining rates earlier in the quarter, excess mill capacity, and higher gold prices, low-grade stockpiled ore was processed, maximizing the profitability of the operation. The higher milling rates also allowed for a more consistent supply of paste to support underground operations.
Processed grades averaged 1.79 g/t Au in the third quarter, 14% lower than the prior year period due to lower underground grades mined and the addition of the low-grade stockpiles. Grades mined are expected to increase towards the upper end of full year guidance of 2.25 g/t Au in the fourth quarter. Combined with higher mining and processing rates, this is expected to drive a significant increase in production in the fourth quarter. Mill recoveries averaged 91% for the third quarter, in line with annual guidance.
Financial Review
Revenues increased to $130.0 million in the third quarter, 23% higher than the prior year period, driven by higher realized gold prices, partially offset by lower ounces sold. For the first nine months of the year, revenues of $357.3 million were 21% higher than the prior year, driven by the same factors.
Cost of sales of $65.2 million in the third quarter were 2% higher than the prior year period, reflecting increased share-based compensation and royalty expenses, and ongoing labour inflation, partially offset by lower ounces sold. Cost of sales of $195.5 million for the first nine months of the year were consistent with the comparative period, driven by the same factors.
Third quarter total cash costs of $1,200 per ounce and mine-site AISC of $1,476 per ounce were higher than the prior year period, primarily due to lower grades processed, higher royalty expense, and ongoing labour inflation. Total cash costs of $1,248 per ounce and mine-site AISC of $1,555 per ounce for the first nine months of year were higher than the comparative period, driven by the same factors.
Capital expenditures in the third quarter totaled $20.2 million, including $10.2 million of sustaining capital and $5.8 million of growth capital. Additionally, $4.2 million was invested in capitalized exploration during the quarter. Capital expenditures, inclusive of capitalized exploration, totaled $60.4 million for the first nine months of 2025 and are on track to meet annual guidance.
Young-Davidson continues to generate strong ongoing mine-site free cash flow, including a record $62.3 million in the third quarter and $160.2 million for the first nine months of the year, already surpassing the previous annual record of $141 million in 2024. With a 14-year Mineral Reserve life, the operation is well-positioned to generate strong ongoing free cash flow over the long-term.
Mulatos District Financial and Operational Review
| Three Months Ended September 30, | Nine Months Ended September 30, | |||
| 2025 | 2024 | 2025 | 2024 | |
| Gold production (ounces) | 37,000 | 50,500 | 101,500 | 166,100 |
| Gold sales (ounces) | 37,056 | 48,793 | 98,631 | 163,802 |
| Financial Review(in millions) | ||||
| Operating Revenues | $130.8 | $122.8 | $325.4 | $380.1 |
| Cost of sales(1) | $45.5 | $68.2 | $143.3 | $218.2 |
| Earnings from operations | $85.3 | $51.1 | $175.6 | $151.2 |
| Cash provided by operating activities | $84.6 | $70.0 | $148.1 | $201.3 |
| Capital expenditures (sustaining)(2) | $0.7 | $0.7 | $1.8 | $3.1 |
| Capital expenditures (growth)(2) | $2.9 | $1.5 | $7.0 | $5.8 |
| Capital expenditures (capitalized exploration)(2) | $7.6 | $0.9 | $10.1 | $5.9 |
| Mine-site free cash flow(2) | $73.4 | $66.9 | $129.2 | $186.5 |
| Cost of sales, including amortization per ounce of gold sold(1) | $1,228 | $1,398 | $1,453 | $1,332 |
| Total cash costs per ounce of gold sold(2) | $761 | $937 | $971 | $892 |
| Mine site all-in sustaining costs per ounce of gold sold(2),(3) | $831 | $1,002 | $1,045 | $954 |
| La Yaqui Grande Mine | ||||
| Open Pit Operations | ||||
| Tonnes of ore mined – open pit | 997,286 | 978,139 | 3,007,335 | 2,986,057 |
| Total waste mined – open pit | 3,895,690 | 4,041,811 | 12,115,215 | 11,996,870 |
| Total tonnes mined – open pit | 4,892,976 | 5,019,950 | 15,122,550 | 14,982,927 |
| Waste-to-ore ratio | 3.91 | 4.13 | 4.03 | 4.02 |
| Crushing and Heap Leach Operations | ||||
| Tonnes of ore stacked | 1,011,191 | 967,387 | 3,050,211 | 2,969,064 |
| Average grade of gold processed(4) | 1.48 | 1.36 | 1.25 | 1.38 |
| Contained ounces stacked | 48,037 | 42,302 | 122,927 | 131,720 |
| Average recovery rate | 61% | 90% | 62% | 98% |
| Ore crushed per day (tonnes) | 11,000 | 10,600 | 11,200 | 10,900 |
(1) Cost of sales includes mining and processing costs, royalties, and amortization expense.
(2) Refer to the “Non-GAAP Measures and Additional GAAP Measures” section of this press release and associated MD&A for a description and calculation of these measures.
(3) For the purposes of calculating mine-site all-in sustaining costs, the Company does not include an allocation of corporate and administrative expense and corporate share-based compensation expense.
(4) Grams per tonne of gold.
Mulatos District Operational Review
Production totaled 37,000 ounces in the third quarter, a 9% increase from the second quarter, reflecting stronger ongoing stacking rates and grades and the recovery of previously stacked ounces on the leach pad. Production is expected to increase further in the fourth quarter with the operation expected to continue benefiting from the recovery of higher grades stacked in the second and third quarters. Given the strong year-to-date performance and the fourth quarter expected to be the strongest of the year, the Company is increasing 2025 production guidance at the Mulatos District.
La Yaqui Grande produced 29,300 ounces in the third quarter, 23% lower than the prior year period. Grades stacked averaged 1.48 g/t Au during the third quarter, consistent with annual guidance, with similar grades expected in the fourth quarter.
Stacking rates averaged 11,000 tpd in the third quarter with grades and stacking rates both an improvement over the prior year period. This drove an increase in contained ounces stacked to 48,037 ounces. Recovery rates of 61% in the third quarter were below the annual guidance range, reflecting timing of recovery of ounces stacked on the leach pad. Given the increased leach pad height, the recovery of a significant portion of ounces stacked over the past two quarters will be realized in the fourth quarter and into 2026.
Mulatos commenced residual leaching in December 2023 and produced 7,700 ounces in the third quarter, in-line with expectations. The operation is expected to benefit from ongoing gold production at decreasing rates through the remainder of 2025.
Mulatos District Financial Review
Revenues of $130.8 million in the third quarter were 7% higher than the prior year period, reflecting higher realized gold prices, partially offset by lower ounces sold. For the first nine months of the year, revenues of $325.4 million were 14% lower than the prior year period, reflecting lower ounces sold, partially offset by higher realized gold prices.
Cost of sales of $45.5 million in the third quarter were 33% lower than the prior year period, driven by lower ounces sold. For the first nine months of the year, cost of sales were $143.3 million, 34% lower than the prior year period, also driven by lower ounces sold.
Total cash costs of $761 per ounce and mine-site AISC of $831 per ounce in the third quarter were lower than the prior year quarter reflecting a higher contribution of ounces from La Yaqui Grande. For the first nine months of the year, total cash costs were $971 per ounce and mine-site AISC were $1,045 per ounce, consistent with annual guidance. Both costs are expected to decrease through the remainder of the year, keeping full year costs in-line with guidance.
Capital expenditures totaled $11.2 million in the third quarter, including $0.7 million of sustaining capital and $7.6 million of capitalized exploration. Growth capital spending of $2.9 million was primarily related to procurement activities and detailed engineering for PDA. Spending on PDA is expected to increase in the fourth quarter with procurement of long-lead time orders for the mill, and more significantly in 2026, with the ramp up of construction activities. Capital guidance for 2025 has been decreased by $20 million with the remainder of the total initial capital estimate of $165 million will be spent in 2026 and 2027 with first production remaining on track for mid-2027.
The Mulatos District generated record mine-site free cash flow of $73.4 million in the third quarter, 10% higher than the prior year period, driven by higher realized gold prices and lower costs. Mine-site free cash flow was $129.2 million for the first nine months of the year, lower than the prior year period, reflecting lower gold sales and higher cash taxes. The strong free cash flow generation was net of $16.7 million of cash tax payments in the third quarter, and $80.4 million in the first nine months of the year, primarily related to 2024 income and mining taxes payable, and 2025 income tax installments. The Company expects cash tax payments of between $20 and $25 million for the fourth quarter, related to the 2025 tax year. At current gold prices, the Mulatos District is expected to generate stronger mine-site free cash flow in the fourth quarter, reflecting higher production and lower costs.
Third Quarter 2025 Development Activities
Island Gold District (Ontario, Canada)
Phase 3+ Expansion
In 2022, the Company announced the Phase 3+ Expansion at Island Gold to 2,400 tpd from the current rate of 1,200 tpd, which includes various infrastructure investments. These include the installation of a shaft, paste plant, as well as accelerated development to support the higher mining rates. Following the completion of the expansion in 2026, the operation will transition from trucking ore and waste up the ramp to skipping ore and waste to surface through the new shaft infrastructure, driving production higher and costs significantly lower.
On June 23, 2025, the Company announced the Base Case LOM Plan, which outlined average annual gold production of 411,000 ounces starting in 2026, at average mine-site AISC of $915 per ounce over the initial 12 years. As part of the Base Case LOM Plan, total estimated growth capital for the Phase 3+ Expansion was revised to $835 million, a 10% increase from the original growth capital estimate prepared in 2022. The increase reflected ongoing labour inflation, as well as the use of a contractor to support off shaft development, and construction activities related to the ore and waste handling system. As at September 30, 2025, 84% of the total growth capital has been spent and committed on the Phase 3+ Expansion.
The Company is also evaluating the addition of a pebble crusher and auxiliary mill to the Magino mill to support the expansion to 12,400 tpd. This would represent a potential scope change at an additional cost of approximately $40 million. These component changes are being evaluated to assess if they will be required as part of a potential larger expansion of up to 20,000 tpd. This evaluation process is ongoing and the Expansion Study is expected to be released in the first quarter of 2026.
Given the unplanned downtime of the Magino mill at the end of September, and higher gold price environment, the decision was made to restart the Island Gold mill late in the third quarter. Given the higher gold price environment, the Company will continue operating the Island Gold mill through the remainder of the year, in addition to the Magino mill. This will provide higher combined milling capacity from the Island Gold District, supporting additional gold production, higher cash flow, and increased profitability. The Company will evaluate the ongoing operation of the Island Gold mill into 2026 as part of the Expansion Study.
During the third quarter of 2025, the Company spent $59.5 million on the Phase 3+ Expansion and capital development. Progress on the Phase 3+ Expansion during the third quarter is summarized as follows:
The Phase 3+ Expansion is on schedule to be completed in the second half of 2026.
| (in US$M) Growth capital (including indirects and contingency) |
P3+ Estimate June 20251 | Spent to date1,2 | Committed to date1 | % of Spent & Committed |
| Shaft & Shaft Surface Complex | 324 | 247 | 39 | 88% |
| Mill Expansion | 67 | 50 | 15 | 97% |
| Paste Plant | 60 | 40 | 8 | 80% |
| Power Upgrade | 38 | 42 | 4 | 121% |
| General Indirect Costs | 91 | 70 | 3 | 80% |
| Total Growth Capital | $580 | $449 | $69 | 89% |
| Underground Equipment, Infrastructure & Accelerated Development | 255 | 187 | — | 73% |
| Total Growth Capital (including Accelerated Spend) | $835 | $636 | $69 | 84% |
1 Reflects updated initial capital estimates released in June 2025 as part of the Base Case LOM Plan, based on USD/CAD exchange $0.73:1 in 2025 and $0.74:1 in 2026 and 2027. Spent to date based on average USD/CAD of $0.73:1 since the start of 2022. Committed to date based on the spot USD/CAD rate as at September 30, 2025 of $0.72:1.
2 Amount spent to date accounted for on an accrual basis, including working capital movements.
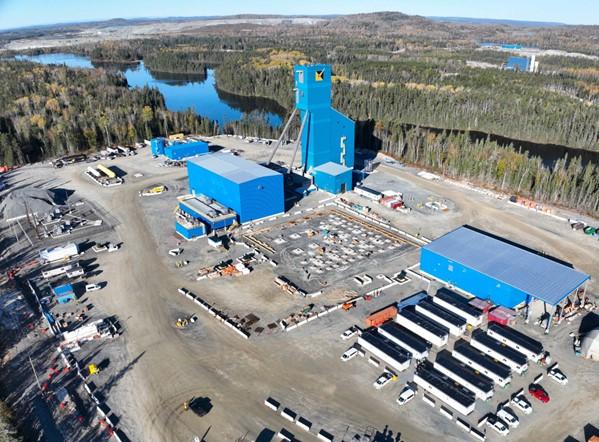
Island Gold shaft site area – October 2025
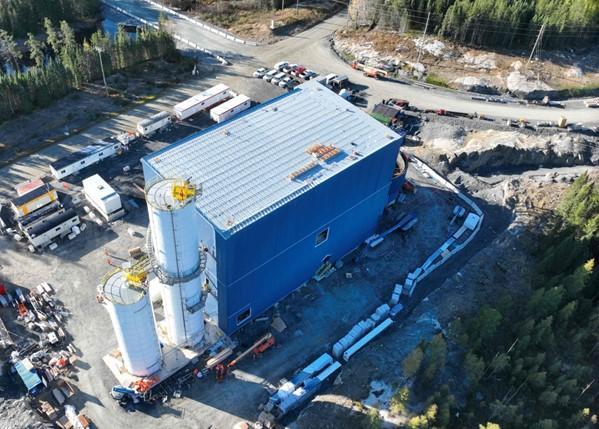
Island Gold paste plant – October 2025
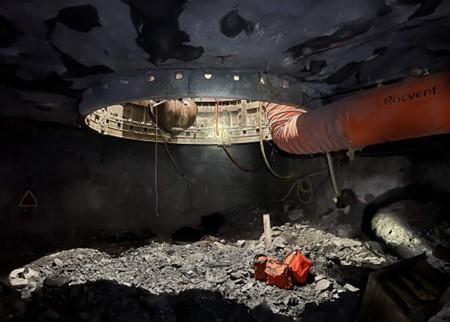
Island Gold 1350L shaft station (depth of 1,350 m) – October 2025
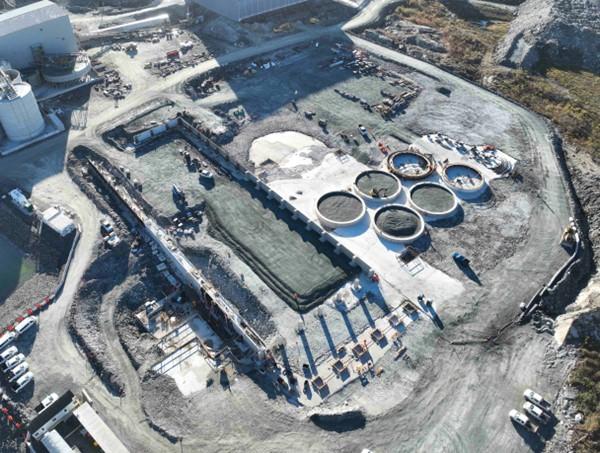
Magino mill expansion to 12,400 tpd – October 2025
Lynn Lake (Manitoba, Canada)
On January 13, 2025, the Company announced a positive construction decision on the Lynn Lake project. With the approval of the Closure Plan in January 2025, the required permitting and pre-construction conditions have been met allowing for the start of construction on the Lynn Lake project. During the first quarter of 2025, the Company also signed an Impact Benefit Agreement (“IBA”) with Mathias Colomb Cree Nation (“MCCN”). The Company now has IBAs in place with both of the First Nation communities proximal to the Lynn Lake project.
Construction activities at the Lynn Lake project were temporarily paused during the second quarter of 2025 due to wildfires affecting communities across northern Manitoba. Given the impact of wildfires and evacuation orders which lasted well into September, the ramp up of construction activities on the Lynn Lake project that had been planned for 2025 has been delayed. With the evacuation order lifted, the project team will continue returning to Lynn Lake over the coming weeks with limited construction activities to be completed ahead of and during the winter months. As a result, the more cost effective and lower risk approach is a ramp up of construction activities in the spring of 2026, with completion of the Lynn Lake project now expected in the first half of 2029. This represents a change from previous schedule of the second half of 2028 given the loss of the full construction season in 2025. With average annual production of 176,000 ounces over its first ten years at first quartile mine-site AISC, Lynn Lake is expected to increase consolidated production to approximately 900,000 ounces per year.
Total initial growth capital for Lynn Lake was estimated to be $632 million in the 2023 Feasibility Study, based on input costs as of the fourth quarter of 2022. With the Manitoba wildfires adding an additional year to the project schedule, the Company is evaluating the impact of the delay on initial capital in addition to three years of inflation since the capital estimates were completed, which has averaged 5% annually. The Company will provide an updated estimate during the first quarter of 2026 with the release of its three-year guidance.
Growth capital spending at Lynn Lake in 2025 is being revised to between $60 million and $70 million, from $100 million and $120 million, due to the loss of the summer construction season with this capital to be deferred into 2026 and 2027.
On February 13, 2025, the Company reported positive results of an internal economic study completed on its Burnt Timber and Linkwood satellite deposits located in proximity to the Lynn Lake project. The 2023 Study was based only on the Gordon and MacLellan deposits which are to be mined over the first 11 years, with the processing of lower grade stockpiled ore for the remainder of the 17-year mine life. The BT and Linkwood deposits are expected to provide a source of additional mill feed to the Lynn Lake project starting in year 12, deferring the lower grade stockpiles until later in the mine plan. This is expected to extend the mine life of the combined Lynn Lake project to 27 years, increase longer term production rates, and enhance its economics as a low-capital, high-return satellite project.
The two deposits are expected to produce an average of 83,000 ounces of gold per year over a 10-year mine life. By leveraging mining equipment and planned processing infrastructure at Lynn Lake, the project is expected to be developed for low initial capital of $67 million. This is expected to contribute to high returns for the BT and Linkwood satellite deposits, with an after-tax internal rate of return (“IRR”) of 54%, and after-tax net present value (“NPV”) (5%) of $177 million at a base case gold price assumption of $2,200 per ounce and CAD/USD foreign exchange rate of $0.75:1. At a gold price of $2,800 per ounce and CAD/USD foreign exchange rate of $0.70:1, returns increase to an after-tax IRR of 83% and after-tax NPV (5%) of $292 million.
Development spending (excluding exploration) was $14.5 million in the third quarter of 2025, primarily on procurement, process design engineering and project owner’s team.
PDA (Sonora, Mexico)
On September 4, 2024, the Company reported the results of the development plan for the PDA project located within the Mulatos District. PDA is a higher-grade underground deposit adjacent to the Mulatos open pit and will benefit from the use of existing crushing infrastructure from Cerro Pelon, supporting lower initial capital and project execution risk.
On January 29, 2025, the Company announced it has been granted approval of an amendment to its existing environmental impact assessment (Manifestación de Impacto Ambiental) by Mexico’s Secretariat of Environment and Natural Resources, allowing for the start of construction on the PDA project. Spending on PDA is expected to increase in the fourth quarter with procurement of long-lead time orders for the mill, and more significantly in 2026, with the ramp up of construction activities. Capital guidance for 2025 has been decreased by $20 million, and the remainder of the total initial capital estimate of $165 million will be spent in 2026 and 2027 with first production remaining on track for mid-2027.
As outlined in the 2024 development plan, PDA is expected to produce an average of 127,000 ounces per year over the first four years and 104,000 ounces over the current mine life (based on Mineral Reserves as at December 31, 2023). Total cash costs are expected to average $921 per ounce and mine-site AISC $1,003 per ounce, consistent with the Company’s overall low cost structure.
Reflecting the low cost structure and low initial capital, PDA is expected to be a high-return project with significant exploration upside. PDA has an estimated after-tax IRR of 46% and after-tax NPV (5%) of $269 million using base case gold price assumption of $1,950 per ounce and a MXN/USD foreign exchange rate of 18:1. Using a $2,500 per ounce gold price, PDA’s after-tax IRR increases to 73%, and after-tax NPV (5%) increases to $492 million.
Development spending (excluding exploration) was $2.9 million in the third quarter of 2025, primarily focused on procurement activities and detailed engineering.
Kirazlı (Çanakkale, Türkiye)
On October 14, 2019, the Company suspended all construction activities on its Kirazlı project following the Turkish government’s failure to grant a routine renewal of the Company’s mining licenses, despite the Company having met all legal and regulatory requirements for their renewal. On April 20, 2021, the Company announced that the Netherlands Subsidiaries would be filing an investment treaty claim against the Republic of Türkiye for expropriation and unfair and inequitable treatment. The claim was filed under the Treaty. The Netherlands Subsidiaries had their claim against the Republic of Türkiye registered on June 7, 2021 with the International Centre for Settlement of Investment Disputes (World Bank Group).
On September 14, 2025, the Company announced that the Netherlands Subsidiaries have entered into a definitive agreement to sell their wholly owned Turkish subsidiary, which owns the Kirazlı, Ağı Dağı and Çamyurt projects, to Tümad, a mining company operating in the Republic of Türkiye, for total cash consideration of $470 million. The transaction closed on October 27, 2025 upon which Alamos received the first payment of $160 million. The remaining cash payments, totalling $310 million, are expected to be received on the first and second anniversaries of the closing of the transaction and are secured by bank guarantees issued by international banks with investment grade rating.
In conjunction with the Transaction, the Netherlands Subsidiaries and the Republic of Türkiye have agreed that arbitration proceedings brought by the Netherlands Subsidiaries against the Republic of Türkiye under the Treaty shall remain suspended, and will be discontinued with prejudice after certain contractual milestones are reached.
The Company incurred $1.1 million in the third quarter of 2025 primarily related to transaction expenses as well as ongoing care and maintenance costs. These costs were expensed during the quarter.
Third Quarter 2025 Exploration Activities
Island Gold District (Ontario, Canada)
A total of $27 million is budgeted for exploration at the Island Gold District in 2025, up from $20 million spent in 2024. The exploration program will build on the success from 2024, with high-grade gold mineralization extended across the Island Gold deposit, as well as within multiple structures of the hanging wall and footwall.
As announced on June 23, 2025, Mineral Reserves at Island Gold underground increased 138% to 4.1 million ounces with grades increasing 5% to 10.85 g/t Au (11.8 mt) driven by Mineral Resource conversion. This marked the 12th consecutive year of Mineral Reserve growth. An updated classification methodology was adopted based on definition drilling, extensive historical and current production data, reconciliation, and underground mapping, which demonstrates that Indicated Mineral Resource continuity can be reliably established with an average drill spacing of 40 metres, versus 25 metres previously. This contributed to the conversion of a portion of the large Inferred Mineral Resource to Measured & Indicated Mineral Resources, which was subsequently converted to Mineral Reserves.
Reflecting the conversion to Mineral Reserves, Inferred Mineral Resources decreased 64% to 1.3 million ounces with grades increasing 16% to 16.88 g/t Au (2.4 mt). Consistent with the increase in Mineral Reserve grades, a key driver of the increase in Mineral Resource grades has been significantly higher-grade additions in the lower portions of Island East and Island Main. With the deposit open laterally and at depth, and some of the best intercepts ever drilled at Island Gold located within the lower portion of Island East, there is excellent potential for further growth in Mineral Reserves and Resources. The discovery cost of the high-grade Mineral Resource additions averaged an attractive $13 per ounce in 2024, and $13 per ounce over the past five years.
A total of 41,500 m of underground drilling is planned in 2025 with a focus on defining new Mineral Reserves and Resources in proximity to existing production horizons and infrastructure. Additionally, 18,000 m of surface exploration drilling has been budgeted, targeting the area between the Island Gold and Magino deposits, as well as the down-plunge extension of the Island Gold deposit, below a depth of 1,500 m. The focus at Magino is on expanding mineralization to the east of the pit, which was previously constrained by the border with Island Gold prior to the acquisition.
Included within sustaining capital, 30,800 m of underground delineation drilling is planned at Island Gold, and 18,000 m of surface delineation drilling at Magino, focused on the ongoing conversion of the large Mineral Resource base to Mineral Reserves.
The regional exploration program at the Island Gold District includes 10,000 m of surface drilling to follow up on high-grade mineralization intersected at the Cline-Pick and Edwards deposits, located approximately seven km northeast of the Island Gold mine. Drilling will also be completed at the Island Gold North Shear target, and to the east and along strike from the Island Gold mine to test the extension of the E1E-Zone.
During the third quarter, 12,246 m of underground exploration drilling was completed in 49 holes, and 1,821 m of surface directional exploration drilling was completed in two holes at Island Gold. Additionally, 14,412 m of underground delineation drilling was completed in 50 holes, focused on infill drilling to convert Mineral Resources to Mineral Reserves. The surface delineation program, which initially commenced during the second quarter, continued to target Mineral Resource-to-Reserve conversion in the lower portion of Island East with 6,614 m completed across 10 holes. Furthermore, a total of 107 m of underground exploration drift development was completed during the third quarter.
For the first nine months of 2025 at Island Gold, 33,381 m of underground exploration drilling was completed in 128 holes, and 3,735 m of surface directional exploration drilling was completed in three holes. In addition, 33,001 m of underground delineation drilling was completed in 112 holes, and 11,356 m of surface delineation drilling was completed in 12 holes.
At Magino, 4,771 m of surface drilling was completed in 14 holes during the third quarter focused on infill drilling to convert Mineral Resources to Mineral Reserves. For the first nine months of 2025 at Magino, 22,390 m of surface drilling was completed in 51 holes.
The regional exploration drilling program continued during the third quarter, with 285 m completed in one hole targeting mineralization at the past-producing Cline-Pick and Edwards mines. For the first nine months of 2025, 6,055 m of drilling in 20 holes have been completed at Cline-Pick and Edwards.
As detailed in the June 2025 exploration update, the program continues to have broad based success with drilling extending high-grade gold mineralization across the Island Gold Deposit, as well as within several hanging wall and footwall structures, highlighting the significant near-mine upside potential. Additionally, the regional exploration program has been successful in intersecting high-grade gold mineralization at the past-producing Cline-Pick and Edwards mines highlighting longer-term opportunities for further growth.
Total exploration expenditures during the third quarter of 2025 were $6.1 million, of which $5.1 million was capitalized. In the first nine months of the year, the Company incurred exploration expenditures of $17.9 million, of which $14.1 million was capitalized.
Young-Davidson (Ontario, Canada)
A total of $11 million is budgeted for exploration at Young-Davidson in 2025, an increase from $9 million spent in 2024. This includes 25,600 m of underground exploration drilling focused on extending mineralization in the syenite, and continuing to evaluate and expand on the newly defined hanging wall zones.
To support the program, 500 m of underground exploration development is planned, which includes approximately 400 m to establish a hanging wall exploration drift to the south, from the 9620 level. By the end of the third quarter, 412 m had been completed in the hanging wall drift. This will allow for drill platforms with more optimal locations and orientations to test the higher grade mineralization discovered in the hanging wall.
The regional program includes 6,000 m of drilling focused on evaluating the Otisse NE target, located approximately three km northeast of Young-Davidson, which is expected to commence in the fourth quarter. A comprehensive data compilation project is also planned for the Wydee and Matachewan projects, which were acquired in the third quarter of 2024, and located to the west and east of Young-Davidson, respectively.
During the third quarter, four underground exploration drills completed 11,028 m in 26 holes across multiple levels. Drilling is targeting syenite-hosted mineralization as well as continuing to test mineralization in the hanging wall sediments and mafic-ultramafic stratigraphy. For the first nine months of 2025, 21,327 m have been completed in 45 holes.
Total exploration expenditures during the third quarter of 2025 were $4.4 million, of which $4.2 million was capitalized. In the first nine months of 2025, exploration expenditures totaled $11.2 million, of which $9.1 million was capitalized.
Mulatos District (Sonora, Mexico)
A total of $19 million is budgeted at Mulatos for exploration in 2025, down slightly from $21 million spent in 2024. The near-mine and regional drilling program is expected to total 50,000 m. This includes 15,000 m of surface exploration drilling at the GAP-Victor and PDA Extension targets at PDA, and 20,000 m planned at Cerro Pelon. The regional exploration program includes 10,000 m of drilling focused on advanced and greenfield targets within the Mulatos District.
Ongoing exploration success at PDA in 2024 drove a 9% increase in Mineral Reserves to 1.1 million ounces, with grades largely unchanged at 5.45 g/t Au. PDA is a higher-grade underground deposit located adjacent to the main Mulatos pit. The results of a positive internal economic study were announced in September 2024 and highlighted an attractive, low-cost, high-return project. With the amendment to the environmental permit received earlier this year, construction activities are expected to begin ramping up in the fourth quarter with first production anticipated mid-2027.
The planned addition of a mill to process higher-grade sulphides has created new opportunities for growth within the Mulatos District. This includes Cerro Pelon, where drilling in 2024 followed up on wide high-grade underground oxide and sulphide intersections previously drilled below the pit. The program was successful in defining an initial Measured and Indicated Mineral Resource at Cerro Pelon totaling 104,000 ounces, grading 4.49 g/t Au. Cerro Pelon remains open in multiple directions and will be a focus of the 2025 exploration program as a significant opportunity for further growth. As the deposit is located within trucking distance of the planned PDA mill, this represents potential upside to the PDA project.
During the third quarter, exploration activities continued at PDA and the near-mine area with 3,276 m of drilling completed in 15 holes. The focus was on infill drilling the Mulatos North portion as well as the Estrella portion of the PDA zone.
Drilling continued at Cerro Pelon with the focus on evaluating the high-grade sulphide potential to the north of the historical open pit. A total of 8,903 m in 26 holes was completed in the third quarter. Additionally, 6,940 m was drilled in 20 holes, testing greenfield targets across the property.
For the first nine months of 2025, 47,740 m have been drilled in 143 holes.
Total exploration expenditures during the third quarter were $7.6 million, all of which was capitalized. In the first nine months of the year, exploration expenditures totaled $16.6 million, of which $10.1 million was capitalized.
Lynn Lake (Manitoba, Canada)
A total of $4 million is budgeted for exploration at the Lynn Lake project in 2025, down from $7 million spent in 2024, with the focus shifting to construction activities. The exploration program included 7,000 m of drilling focused on expanding Mineral Resources at the BT and Linkwood deposits. The Company will also continue prioritizing a pipeline of prospective exploration targets within the 58,000-ha Lynn Lake Property.
As reported on February 18, 2025, total Mineral Reserves for the Lynn Lake District increased 42% to 3.3 million ounces, with grades decreasing 15% to 1.29 g/t Au. This was driven by the successful conversion of Mineral Resources to Reserves at BT and Linkwood in 2024 resulting in an initial Mineral Reserve of 0.9 million ounces grading 0.95 g/t Au.
BT and Linkwood are satellite deposits to the Lynn Lake project and are expected to provide additional mill feed. An internal economic study on BT and Linkwood was released on February 13, 2025, outlining an attractive, low capital, high-return project. BT and Linkwood are expected to extend the mine life of the Lynn Lake project, increase longer term rates of production, and enhance the overall economics.
The 2025 surface exploration program was completed in the first quarter. The focus was on Mineral Resource expansion drilling at both BT and Linkwood, with 7,268 m completed in 41 holes. No exploration activity was conducted on Lynn Lake during the third quarter.
Exploration spending totaled $0.4 million in the third quarter and $3.0 million for the first nine months of the year, all of which was capitalized.
Qiqavik (Quebec, Canada)
A total of $7 million has been budgeted for exploration at the Qiqavik project in 2025, up from $4 million spent in 2024. The project was acquired in April 2024 through the acquisition of Orford Mining Corporation.
Qiqavik is a camp-scale property covering 63,474 ha in the Cape Smith Greenstone Belt in Nunavik, Quebec. The Qiqavik project covers 50 km of strike covering prospective gold hosting environments and several major crustal-scale structures such as the Qiqavik break and the Bergeron fault. Early-stage exploration completed to date indicates that high-grade gold occurrences are controlled by structural splays off the Qiqavik break.
The 2025 exploration program is focused on drilling prospective targets identified in 2024 through detailed geological mapping, prospecting, till sampling, and a high-resolution Lidar survey with photo imagery. A total of 7,000 m of helicopter supported surface drilling was planned with two rigs and focused on testing the highest priority target areas. The program is also focused on advancing other targets across the belt with ongoing geological mapping, drone magnetics, prospecting, and additional till sampling.
A total of 8,736 m of diamond drilling was completed in 29 holes across five target areas during the third quarter, with the majority of assay results pending. Geological mapping, prospecting, till sampling, and 1,619-line kilometers of drone magnetics surveys were also completed in several target areas with the goal of continuing to explore and develop new target areas for future work.
Exploration spending was $4.5 million in the third quarter and $6.2 million for first nine months of the year, all of which was expensed.
Review of Third Quarter Financial Results
During the third quarter of 2025, the Company sold 136,473 ounces of gold for record operating revenues of $462.3 million, representing a 28% increase from the prior year period. The increase was primarily due to higher realized gold prices, partially offset by lower ounces sold due to lower grades processed at Young-Davidson, and lower sales at La Yaqui Grande given the timing of recovery of ounces stacked on the leach pad.
The average realized gold price in the third quarter was $3,359 per ounce, 37% higher than the prior year period. This was $98 per ounce less than the London PM Fix price for the quarter, primarily reflecting the delivery of the 12,346 ounces into the gold prepayment facility entered into in July 2024 based on the prepaid price of $2,524 per ounce.
Cost of sales (which includes mining and processing costs, royalties, and amortization expense) were $194.1 million in the third quarter, 5% lower than the prior year period, primarily due to lower ounces sold. On a per ounce basis, cost of sales of $1,422 per ounce for the third quarter, were consistent with the prior year period. Key drivers of changes to cost of sales as compared to the prior year period were as follows:
Mining and processing costs were $135.9 million, 5% lower than the prior year period. The decrease was primarily driven by lower ounces sold at the Mulatos District and Young-Davidson.
Total cash costs of $973 per ounce and AISC of $1,375 per ounce were consistent with the prior year period.
Royalty expense was $6.2 million in the third quarter, higher than the prior year period of $3.5 million, due to the higher average realized gold price.
Amortization of $52.0 million in the third quarter was 10% lower than the prior period. On a per ounce basis, amortization of $381 per ounce was 4% lower than the prior year period, due to the increased depletion base for the Island Gold District.
The Company recognized earnings from operations of $455.7 million in the third quarter, 149% higher than the prior year period, driven by higher operating revenues and the positive impact of an impairment reversal of $218.8 million for the Turkish Projects following the announcement of the definitive sale agreement.
As at September 30, 2025, the Company held forward contracts that were acquired as part of the acquisition of Argonaut. These legacy contracts, totaling 100,000 ounces in 2026 and 50,000 ounces in 2027, have an average forward price of $1,821 per ounce, and mature monthly throughout 2026 and 2027. The Company recognized unrealized losses of $80.0 million on the forward contracts inherited from Argonaut driven by the movement in gold price in the third quarter. The Company recognized unrealized losses of $28.2 million in the prior year period.
The Company reported net earnings of $276.3 million in the third quarter, compared to $84.5 million in the prior year period. Adjusted earnings were $155.5 million, or $0.37 per share, which included adjustments for unrealized losses on the legacy Argonaut commodity hedge derivatives, net of tax of $53.8 million, and an impairment reversal of $192.9 million, net of tax, related to the sale of the Turkish Projects. In addition, adjusted earnings reflect net unrealized foreign exchange losses recorded within deferred taxes and foreign exchange losses totaling $15.4 million, and other adjustments of $2.9 million.
Associated Documents
This press release should be read in conjunction with the Company’s consolidated financial statements for the three-month period ended September 30, 2025 and associated Management’s Discussion and Analysis, which are available from the Company’s website, www.alamosgold.com, in the “Investors” section under “Reports and Financials”, and on SEDAR+ (www.sedarplus.ca) and EDGAR (www.sec.gov).
Qualified Persons
Chris Bostwick, FAusIMM, Alamos’ Senior Vice President, Technical Services, who is a qualified person within the meaning of National Instrument 43-101 (“Qualified Person”), has reviewed and approved the scientific and technical information contained in this press release.
About Alamos
Alamos is a Canadian-based intermediate gold producer with diversified production from three operations in North America. This includes the Island Gold District and Young-Davidson mine in northern Ontario, Canada, and the Mulatos District in Sonora State, Mexico. Additionally, the Company has a strong portfolio of growth projects, including the Phase 3+ Expansion at Island Gold, and the Lynn Lake project in Manitoba, Canada. Alamos employs more than 2,400 people and is committed to the highest standards of sustainable development.
Hudbay Minerals Inc. (TSX:HBM) (NYSE: HBM) today released its ann... READ MORE
Strategic acquisition of an established operating gold mine, loca... READ MORE
Cerro de Pasco Resources Inc. (TSX-V: CDPR) (OTCQB: GPPRF) (FRA: ... READ MORE
The Garneau Titanium Project Features Ilmenite-Rich Boulder with ... READ MORE
ValOre Metals Corp. (TSX‐V: VO) (OTCQB: KVLQF) (Frankfurt: KEQ0... READ MORE


