


![]()
Alamos Gold Inc. (TSX:AGI) (NYSE:AGI) today reported its financial results for the quarter and year ended December 31, 2024.
“We delivered another record year operationally and financially driven by strong performances across our operations. Production grew 7% to 567,000 ounces, meeting our increased guidance and achieving a new annual record for the second consecutive year. Full year costs were in line with guidance and combined with the rising gold price, we set a number of financial records. This included record free cash flow of $272 million while funding additional high-return growth, including the Phase 3+ Expansion and our largest exploration budget ever,” said John A. McCluskey, President and Chief Executive Officer.
“Our significant investment in exploration continues to create value with global Mineral Reserves increasing 31% to 14 million ounces, including another substantial increase in higher-grade Reserves and Resources at Island Gold. We will be incorporating this growth into the Island Gold District Life of Mine Plan and Expansion Study to be released later this year that we expect will outline a larger, and more valuable operation,” Mr. McCluskey added.
Fourth Quarter and Full Year 2024 Highlights
Operational and Financial Highlights
Mineral Reserves and Resources, Growth Projects, Acquisitions, and Other Highlights
(1) Refer to the “Non-GAAP Measures and Additional GAAP Measures” disclosure at the end of this press release and associated MD&A for a description and calculation of these measures.
Highlight Summary
| Three Months Ended December 31, | Years Ended December 31, | |||
| 2024 | 2023 | 2024 | 2023 | |
| Financial Results (in millions) | ||||
| Operating revenues | $375.8 | $254.6 | $1,346.9 | $1,023.3 |
| Cost of sales (1) | $200.9 | $166.7 | $751.1 | $637.7 |
| Earnings from operations | $158.4 | $71.9 | $561.9 | $318.1 |
| Earnings before income taxes | $157.2 | $51.2 | $502.2 | $293.7 |
| Net earnings | $87.6 | $47.1 | $284.3 | $210.0 |
| Adjusted net earnings (2) | $103.2 | $49.2 | $328.9 | $208.4 |
| Adjusted earnings before interest, taxes, depreciation and amortization (2) | $207.2 | $103.6 | $691.5 | $487.3 |
| Cash provided by operations before working capital and taxes paid (2) | $207.9 | $120.2 | $726.2 | $518.9 |
| Cash provided by operating activities | $192.2 | $124.1 | $661.1 | $472.7 |
| Capital expenditures (sustaining) (2)(3) | $30.0 | $26.6 | $110.1 | $104.2 |
| Sustaining finance leases | $5.2 | $— | $10.6 | $— |
| Capital expenditures (growth) (2) | $101.2 | $73.0 | $279.5 | $216.7 |
| Capital expenditures (capitalized exploration) | $7.5 | $10.1 | $28.0 | $28.0 |
| Free cash flow (2) | $53.5 | $14.4 | $272.3 | $123.8 |
| Operating Results | ||||
| Gold production (ounces) | 140,200 | 129,500 | 567,000 | 529,300 |
| Gold sales (ounces) | 141,258 | 129,005 | 560,234 | 526,258 |
| Per Ounce Data | ||||
| Average realized gold price | $2,632 | $1,974 | $2,379 | $1,944 |
| Average spot gold price (London PM Fix) | $2,663 | $1,971 | $2,386 | $1,941 |
| Cost of sales per ounce of gold sold (includes amortization) (1) | $1,422 | $1,292 | $1,341 | $1,212 |
| Total cash costs per ounce of gold sold (2) | $981 | $900 | $927 | $850 |
| All-in sustaining costs per ounce of gold sold (2) | $1,333 | $1,233 | $1,281 | $1,160 |
| Share Data | ||||
| Earnings per share, basic | $0.21 | $0.12 | $0.70 | $0.53 |
| Earnings per share, diluted | $0.21 | $0.12 | $0.69 | $0.53 |
| Adjusted earnings per share, basic (2) | $0.25 | $0.12 | $0.81 | $0.53 |
| Weighted average common shares outstanding (basic) (000’s) | 420,192 | 396,577 | 408,165 | 395,509 |
| Financial Position (in millions) | ||||
| Cash and cash equivalents | $327.2 | $224.8 | ||
(1) Cost of sales includes mining and processing costs, royalties, and amortization expense.
(2) Refer to the “Non-GAAP Measures and Additional GAAP Measures” disclosure at the end of this press release and associated MD&A for a description and calculation of these measures.
(3) Sustaining capital expenditures include sustaining capital lease expenditures at Magino, which are not included as additions to mineral property, plant and equipment in cash flows used from investing activities.
| Three Months Ended December 31, | Years Ended December 31, | |||
| 2024 | 2023 | 2024 | 2023 | |
| Gold production (ounces) | ||||
| Young-Davidson | 45,700 | 49,800 | 174,000 | 185,100 |
| Island Gold | 39,400 | 31,600 | 155,000 | 131,400 |
| Magino (9) | 16,200 | — | 33,000 | — |
| Mulatos District (8) | 38,900 | 48,100 | 205,000 | 212,800 |
| Gold sales (ounces) | ||||
| Young-Davidson | 45,441 | 48,052 | 173,274 | 182,796 |
| Island Gold | 39,595 | 30,464 | 152,170 | 127,629 |
| Magino (9) | 16,505 | — | 31,271 | — |
| Mulatos District (8) | 39,717 | 50,489 | 203,519 | 215,833 |
| Cost of sales (in millions) (1) | ||||
| Young-Davidson | $65.9 | $64.6 | $261.9 | $248.2 |
| Island Gold | $34.7 | $33.8 | $132.2 | $123.6 |
| Magino (9) | $35.4 | — | $73.9 | — |
| Mulatos District (8) | $64.9 | $68.3 | $283.1 | $265.9 |
| Cost of sales per ounce of gold sold (includes amortization) (1) | ||||
| Young-Davidson | $1,450 | $1,344 | $1,511 | $1,358 |
| Island Gold | $876 | $1,110 | $869 | $968 |
| Magino (9) | $2,145 | — | $2,363 | — |
| Mulatos District (8) | $1,634 | $1,353 | $1,391 | $1,232 |
| Total cash costs per ounce of gold sold (2) | ||||
| Young-Davidson | $955 | $920 | $1,047 | $938 |
| Island Gold | $594 | $775 | $592 | $669 |
| Magino (9) | $1,672 | — | $1,836 | — |
| Mulatos District (8) | $1,113 | $957 | $935 | $883 |
| Mine-site all-in sustaining costs per ounce of gold sold (2)(3) | ||||
| Young-Davidson | $1,191 | $1,211 | $1,314 | $1,208 |
| Island Gold | $791 | $1,136 | $865 | $1,017 |
| Magino (9) | $2,666 | — | $2,824 | — |
| Mulatos District (8) | $1,198 | $1,030 | $1,001 | $967 |
| Capital expenditures (sustaining, growth, and capitalized exploration) (in millions) (2) | ||||
| Young-Davidson (4) | $21.3 | $24.0 | $86.1 | $67.2 |
| Island Gold (5) | $83.7 | $73.9 | $257.0 | $233.1 |
| Magino (7)(9)(10) | $24.7 | — | $38.6 | — |
| Mulatos District (6)(8) | $5.3 | $8.4 | $20.1 | $30.4 |
| Other | $8.9 | $3.4 | $26.4 | $18.2 |
(1) Cost of sales includes mining and processing costs, royalties, and amortization expense.
(2) Refer to the “Non-GAAP Measures and Additional GAAP Measures” disclosure at the end of this press release and associated MD&A for a description and calculation of these measures.
(3) For the purposes of calculating mine-site all-in sustaining costs, the Company does not include an allocation of corporate and administrative and share-based compensation expenses.
(4) Includes capitalized exploration at Young-Davidson of $2.0 million and $5.9 million for the three months and year ended December 31, 2024 ($1.3 million and $5.1 million for the three months and year ended December 31, 2023, respectively).
(5) Includes capitalized exploration at Island Gold of $1.7 million and $12.4 million for the three months and year ended December 31, 2024 ($3.3 million and $11.1 million for the three months and year ended December 31, 2023, respectively).
(6) Includes capitalized exploration at Mulatos District of $1.6 million and $7.5 million for the three months and year ended December 31, 2024 ($5.5 million and $11.8 million for the three months and year ended December 31, 2023).
(7) Includes capitalized exploration at Magino of $2.2 million and $2.2 million for the three months and year ended December 31, 2024.
(8) The Mulatos District includes La Yaqui Grande and Mulatos pit.
(9) The 2024 full year results for Magino are for Alamos’ ownership period from July 12, 2024 to December 31, 2024.
(10) Sustaining capital expenditures for Magino include certain finance leases classified as sustaining.
Environment, Social and Governance Summary Performance
Health and Safety
During the fourth quarter of 2024, Alamos had 25 recordable injuries across its sites including one lost time injury. For the full year, Alamos had 84 recordable injuries across its sites including 4 LTIs.
Alamos strives to maintain a safe, healthy working environment for all, with a strong safety culture where everyone is continually reminded of the importance of keeping themselves and their colleagues healthy and injury-free. The Company’s overarching commitment is to have all employees and contractors return Home Safe Every Day.
Environment
Two minor reportable events occurred during the fourth quarter. At the Magino mine, an effluent grab sample slightly exceeded the daily limit for phosphorus, which has since been rectified. The other minor reportable event was at Young-Davidson, where minor seepage was identified at the toe of the dam and quickly contained within the tailings management facility with no impact to the surrounding environment.
The Company is committed to preserving the long-term health and viability of the natural environment that surrounds its operations and projects. This includes investing in new initiatives to reduce the Company’s environmental footprint with the goal of minimizing the impacts of our activities.
Community
Ongoing donations, medical support and infrastructure investments were provided to local communities, including:
The Company believes that excellence in sustainability provides a net benefit to all stakeholders. The Company continues to engage with local communities to understand local challenges and priorities. Ongoing investments in local infrastructure, health care, education, cultural and community programs remain a focus of the Company.
Governance and Disclosure
The Company maintains the highest standards of corporate governance to ensure that corporate decision-making reflects its values, including the Company’s commitment to sustainable development.
(1) Frequency rate is calculated as incidents per 200,000 hours worked.
Outlook and Strategy
| 2025 Guidance | |||||
| Island Gold District | Young-Davidson | Mulatos | Lynn Lake | Total | |
| Gold production(000’s ounces) | 275 – 300 | 175 – 190 | 130 – 140 | — | 580 – 630 |
| Cost of sales, including amortization(in millions) (3) | $805 | ||||
| Cost of sales, including amortization($ per ounce) (3) | $1,330 | ||||
| Total cash costs($ per ounce) (1) | $725 – $775 | $1,075 – $1,125 | $925 -$975 | — | $875- $925 |
| All-in sustaining costs($ per ounce) (1) | $1,250 – $1,300 | ||||
| Mine-site all-in sustaining costs ($ per ounce) (1)(2) | $1,100 – $1,150 | $1,390 – $1,440 | $1,025 – $1,075 | — | |
| Capital expenditures(in millions) | |||||
| Sustaining capital(1) | $80 – $85 | $55 – $60 | $3 – $5 | — | $138 – $150 |
| Growth capital(1) | $270 – $300 | $15 – $20 | $37 – $40 | $100-120 | $422- $480 |
| Total Sustaining and Growth Capital(1) | $350 – $385 | $70 – $80 | $40 – $45 | $100-120 | $560 – $630 |
| Capitalized exploration (1) | $20 | $9 | $6 | $4 | $39 |
| Total capital expenditures and capitalized exploration (1) | $370 – $405 | $79 – $89 | $46 – $51 | $104-124 | $599- $699 |
(1) Refer to the “Non-GAAP Measures and Additional GAAP” disclosure at the end of this press release and associated MD&A for a description of these measures.
(2) For the purposes of calculating mine-site all-in sustaining costs at individual mine sites, the Company does not include an allocation of corporate and administrative and share-based compensation expenses to the mine sites.
(3) Cost of sales includes mining and processing costs, royalties, and amortization expense, and is calculated based on the mid-point of total cash cost guidance.
The Company’s objective is to operate a sustainable business model that supports growing returns to all stakeholders over the long-term, through growing production, expanding margins, and increasing profitability. This includes a balanced approach to capital allocation focused on generating strong ongoing free cash flow while re-investing in high-return internal growth opportunities and supporting higher returns to shareholders.
2024 Year in Review
The Company delivered another record operational and financial performance in 2024. Full year production was in-line with guidance and increased 7% from 2023 to a record 567,000 ounces, reflecting the acquisition of the Magino mine in July, and strong ongoing performances from Island Gold and the Mulatos District. Through record production, sales, and gold prices, 2024 revenues increased 32% from 2023 to a record $1.3 billion. Full year costs were also in-line with guidance contributing to strong margin expansion. Through growing production and increasing margins, the Company generated record free cash flow of $272.3 million while continuing to fund its high-return growth initiatives including the Phase 3+ Expansion at Island Gold, and a record exploration program.
The Mulatos District had another strong year with production exceeding increased guidance, and the operation generating record mine-site free cash flow of $239.9 million in 2024. Young-Davidson also generated a record $140.9 million in mine-site free cash flow, marking the fourth consecutive year free cash flow has exceeded $100 million. Island Gold had another solid year on multiple fronts with production at the top end of guidance, significant progress made on the Phase 3+ Expansion, and ongoing exploration success driving another year of substantial growth in Mineral Reserves and Resources. With the strong operational performance, this significant investment in growth was all self-financed by Island Gold.
The integration of the Magino and Island Gold operations continues to advance providing significant synergies. Immediate capital savings have already been realized, with the previously planned mill and tailings expansions at Island Gold no longer required. The utilization of the larger and more efficient Magino mill to process Island Gold ore is expected to drive operating cost synergies starting in 2025 with further improvements in 2026 upon completion of the Phase 3+ Expansion. The Magino mill is expected to ramp up to 11,200 tpd by the end of the first quarter of 2025 after which it will begin processing ore from Island Gold at significantly lower processing costs.
The acquisition has also de-risked the Phase 3+ Expansion and unlocked longer term upside potential across the Island Gold District. The shaft sink has advanced to a depth of 1,000 metres as of mid-February and is expected to reach the ultimate planned depth of 1,373 metres in the third quarter. The expansion remains on track to be completed in the first half of 2026, which will be a significant driver of further free cash flow growth over the longer-term through increasing production and declining costs.
The Company continues to advance its other high-return internal growth opportunities, including PDA and Lynn Lake. As outlined in the September 2024 development plan, PDA is an attractive, low-cost, high-return underground project with an estimated after-tax IRR of 46% at a conservative gold price of $1,950 per ounce, increasing to 73% at $2,500 per ounce. Based on its existing Mineral Reserves at year-end 2024, PDA is expected to more than triple the Mulatos District mine life to at least 2036, with excellent exploration upside. In January 2025, an amendment to the existing MIA was received allowing for the start of construction. Development activities are expected to ramp up in the second half of the year with initial production expected mid-2027.
Detailed engineering on the Lynn Lake project continued through 2024 in advance of the construction decision made in January 2025. With the Closure Plan filed, and all key permits needed to start development of the project approved, construction activities are expected to ramp up starting in the first quarter of 2025 putting first gold production on track for the first half of 2028.
Additionally, a positive internal study on the Burnt Timber and Linkwood satellite deposits was completed in February 2025 outlining a low capital intensity, high-return project that will leverage existing infrastructure from the Lynn Lake project. As satellite deposits to the Lynn Lake project, the incorporation of Burnt Timber and Linkwood is expected to extend the combined mine life, and increase longer term production rates at a low all in cost, enhancing already attractive economics.
Global Mineral Reserves and Resources continue to grow supporting this strong portfolio of growth assets. Mineral Reserves increased 31% in 2024 to 14.0 million ounces (298 mt grading 1.45 g/t Au), reflecting the addition of Magino, an initial Reserve at Burnt Timber and Linkwood, and tremendous ongoing exploration success at Island Gold. This marks the sixth consecutive year of growth in Mineral Reserves for a cumulative increase of 44% over that time frame.
Island Gold continues to be a significant driver of growth with its combined Mineral Reserve and Resources increasing 9% to 6.7 million ounces at substantially higher grades. This included a 32% increase in Mineral Reserves to 2.3 million ounces with grades increasing 11% to 11.40 g/t Au. Inferred Mineral Resources also increased 2% to 3.8 million ounces, with additions more than replacing the conversion to Mineral Reserves, while grades increased an impressive 13% to 16.52 g/t Au. Island Gold continues to establish itself as one of the highest-grade and fastest growing deposits in the world.
This growth will be incorporated into the Island Gold District Life of Mine plan to be released mid-2025 and an Expansion Study expected to be released in the fourth quarter. The growing deposit and significant increase in grades are expected to support higher average annual gold production over the longer term.
2025 Outlook
The Company provided three-year production and operating guidance in January 2025, which outlined growing production at declining costs over the next three years. Refer to the Company’s January 13, 2025 guidance press release for a summary of the key assumptions and related risks associated with the comprehensive 2025 guidance and three-year production, cost and capital outlook.
On February 1, 2025, the United States introduced tariffs on imports from countries including Canada and Mexico. In response, the Canadian and Mexican governments announced retaliatory tariffs on imports from the United States. Subsequently, all three countries postponed their previously announced tariffs for 30 days. The Company does not expect its revenue structure will be impacted by the tariffs as its gold production is refined in Canada or Europe. While there is uncertainty as to whether the tariffs or retaliatory tariffs will be implemented, and the quantum of such tariffs, the Company’s cost structure predominantly relates to input costs which are not expected to be directly affected by the tariffs, including labour and contractors. The Company will continue to monitor developments and may take steps to limit the impact of any tariffs as may be appropriate in the circumstances. The Company’s cost and capital guidance released in January 2025 does not factor any potential impact from such tariffs.
Gold production in 2025 is expected to range between 580,000 and 630,000 ounces, a 7% increase from 2024 (based on the mid-point) driven by the ramp up of production at Island Gold, and a full year of operation at Magino. First quarter production is expected to be between 125,000 and 140,000 ounces at costs consistent with the top end of guidance for the first half of the year. Production is expected to increase and costs decrease into the second quarter, with a more significant improvement expected in the second half of the year.
Total cash costs and AISC are expected to decrease slightly in 2025 compared with 2024, with costs higher in the first half of the year and decreasing in the second half of the year. AISC are expected to decrease approximately 15% in the second half of 2025, relative to the first half of the year, driven by higher grades and mining rates at Island Gold, higher grades at La Yaqui Grande, as well as a lower contribution from residual leaching from Mulatos. Production from residual leaching carries higher reported costs though is very profitable from a cash flow perspective, with the majority of these costs previously incurred and recorded in inventory.
By 2027, production is expected to increase 24% to a range of 680,000 to 730,000 ounces, and AISC to decrease 8%, relative to 2024, driven by low-cost growth from Island Gold following the completion of the Phase 3+ Expansion. A further increase in production and decrease in costs is expected into 2028 with the startup of production from Lynn Lake. With average annual production of 176,000 ounces over its first 10 years at first quartile mine-site AISC, Lynn Lake is expected to increase consolidated production to approximately 900,000 ounces per year.
Capital spending is expected to increase in 2025 reflecting the inclusion of development capital for Lynn Lake and PDA, with the start of construction on both projects in 2025, as well as the final full year of capital on the Phase 3+ Expansion. Capital spending is expected to increase modestly into 2026 with the lower capital at the Island Gold District offset by the ramp up in spending on Lynn Lake and PDA. In 2027, capital spending is expected to decrease 27% relative to 2026 driven by significantly lower capital at the Island Gold District, and the completion of construction of PDA. A further decrease in capital is expected in 2028 with the completion of construction of Lynn Lake.
The global exploration budget for 2025 is $72 million, a 16% increase from $62 million spent in 2024, and the largest in the Company’s history reflecting broad based exploration success across its assets. This includes expanded exploration programs at the Island Gold District and Qiqavik, as well as significant ongoing programs at Young-Davidson and the Mulatos District.
Given the strong ongoing profitability of the Mulatos District operation, the Company expects to pay between $70 and $80 million in cash tax payments in Mexico in 2025, which includes the 2024 year-end tax payment due in the first quarter of 2025 of approximately $45 million. Additionally, as previously guided, the Company’s cash flow during 2025 will be impacted by the planned delivery of 49,384 ounces into the gold prepayment facility. The ounces will be delivered monthly in 2025 (approximately 4,115 ounces per month) and recorded as revenue based on the prepay price of $2,524 per ounce. There will be no cash flow associated with the sale of these ounces in 2025, with proceeds already received in 2024.
The Company remains well positioned to fund its high-return growth projects internally with strong ongoing free cash flow, $327.2 million of cash and cash equivalents at the end of 2024, and approximately $827.2 million of total liquidity. Cash and cash equivalents increased by 12% from the third quarter driven by continued free cash flow generation. At current gold prices, the Company expects to continue generating positive free cash flow while funding its growth projects, with a significant increase in free cash flow expected following the completion of the Phase 3+ Expansion in 2026, PDA in 2027, and Lynn Lake in 2028.
Fourth Quarter and Year-End 2024 results
Young-Davidson Financial and Operational Review
| Three Months Ended December 31, | Years Ended December 31, | |||||||
| 2024 | 2023 | 2024 | 2023 | |||||
| Gold production (ounces) | 45,700 | 49,800 | 174,000 | 185,100 | ||||
| Gold sales (ounces) | 45,441 | 48,052 | 173,274 | 182,796 | ||||
| Financial Review (in millions) | ||||||||
| Operating Revenues | $120.5 | $94.8 | $415.3 | $355.3 | ||||
| Cost of sales (1) | $65.9 | $64.6 | $261.9 | $248.2 | ||||
| Earnings from operations | $53.7 | $29.8 | $207.5 | $104.2 | ||||
| Cash provided by operating activities | $71.6 | $59.0 | $227.0 | $184.8 | ||||
| Capital expenditures (sustaining) (2) | $10.6 | $13.9 | $45.7 | $49.0 | ||||
| Capital expenditures (growth) (2) | $8.7 | $8.8 | $34.5 | $13.1 | ||||
| Capital expenditures (capitalized exploration) (2) | $2.0 | $1.3 | $5.9 | $5.1 | ||||
| Mine-site free cash flow (2) | $50.3 | $35.0 | $140.9 | $117.6 | ||||
| Cost of sales, including amortization per ounce of gold sold (1) | $1,450 | $1,344 | $1,511 | $1,358 | ||||
| Total cash costs per ounce of gold sold (2) | $955 | $920 | $1,047 | $938 | ||||
| Mine-site all-in sustaining costs per ounce of gold sold (2),(3) | $1,191 | $1,211 | $1,314 | $1,208 | ||||
| Underground Operations | ||||||||
| Tonnes of ore mined | 738,717 | 687,738 | 2,786,639 | 2,878,155 | ||||
| Tonnes of ore mined per day | 8,030 | 7,475 | 7,614 | 7,885 | ||||
| Average grade of gold (4) | 2.10 | 2.39 | 2.08 | 2.20 | ||||
| Metres developed | 1,953 | 2,045 | 8,274 | 9,085 | ||||
| Mill Operations | ||||||||
| Tonnes of ore processed | 746,709 | 724,670 | 2,806,192 | 2,878,047 | ||||
| Tonnes of ore processed per day | 8,116 | 7,877 | 7,667 | 7,885 | ||||
| Average grade of gold (4) | 2.10 | 2.38 | 2.08 | 2.20 | ||||
| Contained ounces milled | 50,325 | 55,412 | 187,321 | 203,791 | ||||
| Average recovery rate | 91 | % | 91 | % | 91 | % | 90 | % |
(1) Cost of sales includes mining and processing costs, royalties and amortization.
(2) Refer to the “Non-GAAP Measures and Additional GAAP Measures” disclosure at the end of this press release and associated MD&A for a description and calculation of these measures.
(3) For the purposes of calculating mine-site all-in sustaining costs, the Company does not include an allocation of corporate and administrative and share based compensation expenses.
(4) Grams per tonne of gold.
Operational review
Young-Davidson produced 45,700 ounces of gold in the fourth quarter, 8% lower than the prior year period with lower grades mined partially offset by stronger mining rates. Production for the full year totaled 174,000 ounces, slightly below guidance and the prior year, due to lower tonnes and grades mined.
Mining rates averaged 8,030 tonnes per day in the fourth quarter, in-line with guidance and a 7% increase compared to the prior year period. Mining rates averaged 7,614 tpd for the full year, reflecting temporary lower scoop availability earlier in the year.
Milling rates averaged 8,116 tpd in the fourth quarter, 3% higher than the prior year period. For the full year, milling rates averaged 7,667 tpd, 3% lower than the prior year. Milling rates for both the fourth quarter and full year were consistent with mining rates. For the fourth quarter, milled grades averaged 2.10 g/t Au, up slightly from the third quarter. Mill recoveries averaged 91% for the fourth quarter and full year, in-line with annual guidance.
Financial Review
Revenues increased to $120.5 million in the fourth quarter, 27% higher than the prior year period, driven by higher realized gold prices, partially offset by lower ounces sold. Similarly, revenues for the full year of $415.3 million were 17% higher than the prior year with higher realized gold prices partially offset by lower ounces sold.
Cost of sales were $65.9 million in the fourth quarter, marginally higher than the prior year period. Cost of sales were $261.9 million for the full year, a 6% increase compared to the prior year, primarily driven by labour inflation.
Total cash costs were $955 per ounce in the fourth quarter, a 4% increase compared to the prior year period. Total cash costs were $1,047 per ounce for the full year, higher than the prior year as a result of inflation, but in-line with annual guidance.
Mine-site AISC were $1,191 per ounce for the fourth quarter, a 2% decrease compared to the prior year period due to timing of sustaining capital expenditures. Mine-site AISC averaged $1,314 per ounce for the full year, above the prior year and annual guidance reflecting higher sustaining capital per ounce.
Capital expenditures in the fourth quarter totaled $21.3 million, including $10.6 million of sustaining capital and $8.7 million of growth capital. Additionally, $2.0 million was invested in capitalized exploration during the quarter. Capital expenditures, inclusive of capitalized exploration, totaled $86.1 million for the full year.
Young-Davidson generated record mine-site free cash flow of $50.3 million in the fourth quarter, and a record $140.9 million for 2024. This marked the fourth consecutive year the operation has generated more than $100 million of mine-site free cash flow. With a 14-year Mineral Reserve life, Young-Davidson is well positioned to generate similar levels of free cash flow over the long-term.
Island Gold Financial and Operational Review
| Three Months Ended December 31, | Years Ended December 31, | |||||||
| 2024 | 2023 | 2024 | 2023 | |||||
| Gold production (ounces) | 39,400 | 31,600 | 155,000 | 131,400 | ||||
| Gold sales (ounces) | 39,595 | 30,464 | 152,170 | 127,629 | ||||
| Financial Review (in millions) | ||||||||
| Operating Revenues | $103.9 | $60.0 | $363.1 | $247.8 | ||||
| Cost of sales(1) | $34.7 | $33.8 | $132.2 | $123.6 | ||||
| Earnings from operations | $68.2 | $25.3 | $225.9 | $120.5 | ||||
| Cash provided by operating activities | $81.8 | $39.9 | $269.2 | $164.9 | ||||
| Capital expenditures (sustaining) (2) | $7.7 | $10.9 | $41.1 | $43.9 | ||||
| Capital expenditures (growth) (2) | $74.3 | $59.7 | $203.5 | $178.1 | ||||
| Capital expenditures (capitalized exploration) (2) | $1.7 | $3.3 | $12.4 | $11.1 | ||||
| Mine-site free cash flow (2) | ($1.9 | ) | ($34.0 | ) | $12.2 | ($68.2 | ) | |
| Cost of sales, including amortization per ounce of gold sold (1) | $876 | $1,110 | $869 | $968 | ||||
| Total cash costs per ounce of gold sold (2) | $594 | $775 | $592 | $669 | ||||
| Mine-site all-in sustaining costs per ounce of gold sold (2),(3) | $791 | $1,136 | $865 | $1,017 | ||||
| Underground Operations | ||||||||
| Tonnes of ore mined | 112,980 | 114,895 | 396,686 | 437,541 | ||||
| Tonnes of ore mined per day | 1,228 | 1,249 | 1,084 | 1,199 | ||||
| Average grade of gold (4) | 11.05 | 8.96 | 12.39 | 9.43 | ||||
| Metres developed | 1,914 | 1,730 | 6,626 | 8,031 | ||||
| Mill Operations | ||||||||
| Tonnes of ore processed | 110,096 | 116,440 | 392,460 | 439,008 | ||||
| Tonnes of ore processed per day | 1,197 | 1,266 | 1,072 | 1,203 | ||||
| Average grade of gold (4) | 11.19 | 8.76 | 12.47 | 9.48 | ||||
| Contained ounces milled | 39,614 | 32,797 | 157,379 | 133,826 | ||||
| Average recovery rate | 98 | % | 98 | % | 98 | % | 97 | % |
(1) Cost of sales includes mining and processing costs, royalties, and amortization.
(2) Refer to the “Non-GAAP Measures and Additional GAAP Measures” disclosure at the end of this press release and associated MD&A for a description and calculation of these measures.
(3) For the purposes of calculating mine-site all-in sustaining costs, the Company does not include an allocation of corporate and administrative and share based compensation expenses.
(4) Grams per tonne of gold.
Operational review
Island Gold produced 39,400 ounces in the fourth quarter of 2024, a 25% increase from the prior year period, driven by an increase in grades processed. For the full year, Island Gold produced a record 155,000 ounces, an 18% increase compared to the prior year and at the top-end of annual guidance.
Underground mining rates averaged 1,228 tpd in the fourth quarter, in-line with guidance. Full year mining rates averaged 1,084 tpd, below annual guidance reflecting scheduled downtime in July to upgrade the underground ventilation infrastructure, as well as a focus on maximizing the extraction of significantly higher-grade ore from within the 1025 mining horizon in the first half of the year. The upgrade to the ventilation infrastructure was successfully completed as part of the Phase 3+ Expansion project and will support increased development rates in the near term and higher underground mining rates over the longer term, following the completion of the expansion.
Grades mined averaged 11.05 g/t Au in the fourth quarter, 23% higher than in the prior year period. Grades mined averaged 12.47 g/t Au for the full year, 32% higher than in the prior year and consistent with the upper end of annual guidance.
Mill throughput averaged 1,197 tpd for the fourth quarter and 1,072 tpd for the full year, consistent with mining rates. Mill recoveries averaged 98% for the full year, above guidance and reflecting the higher grades processed in the quarter and for the year. Mill recoveries are expected to return to within the guided range of 96-97% in 2025.
As previously disclosed, the Island Gold mill is expected to be shut down at the end of the first quarter of 2025, following which ore from Island Gold will be trucked and processed through the larger and more cost-effective Magino mill.
Financial Review
Revenue of $103.9 million in the fourth quarter were 73% higher than the prior year period, driven by higher realized gold price and an increase in ounces sold. Similarly, revenues of $363.1 million for the full year were 47% higher than the prior year.
Cost of sales of $34.7 million in the fourth quarter and $132.2 million for the full year were 3% and 7% higher than the prior year periods, respectively, due to the increase in ounces sold. On a per ounce basis, cost of sales were 21% and 10% lower in the fourth quarter and the full year, respectively, as compared to the prior year periods due to the higher grades processed.
Total cash costs were $594 per ounce in the fourth quarter, and $592 per ounce for the full year, both lower than the prior year periods and consistent with guidance. Mine-site AISC of $791 per ounce for the fourth quarter and $865 per ounce for the full year, were lower than annual guidance, driven by higher grades processed and lower sustaining capital expenditures.
Total capital expenditures were $83.7 million in the fourth quarter, including $74.3 million of growth capital and $1.7 million of capitalized exploration. Growth capital spending remained primarily focused on the Phase 3+ Expansion shaft site infrastructure, paste plant, and shaft sinking, which advanced to a depth of 882 m by the end of the year, and is scheduled to be completed in the third quarter of 2025. Additionally, detailed engineering continued to advance on the expansion of the Magino mill to 12,400 tpd. The expansion of the Magino mill is expected to be completed by mid-2026 to coincide with the completion of the Phase 3+ Expansion at Island Gold. Capital expenditures, inclusive of capitalized exploration, totaled $257.0 million for the full year, in-line with guidance.
Mine-site free cash flow was negative $1.9 million for the fourth quarter and positive $12.4 million for the full year net of the significant capital investment related to the Phase 3+ Expansion, as well as a robust exploration program. At current gold prices, Island Gold is expected to continue self funding the Phase 3+ Expansion capital. The operation is expected to generate significant free cash flow from 2026 onward with the completion of the expansion.
Magino Mine Financial and Operational Review
The results for Magino are for Alamos’ ownership period from July 12, 2024 to December 31, 2024.
| Three months ended December 31, |
July 12 – December 31, | |||
| 2024 | 2024 | |||
| Gold production (ounces) | 16,200 | 33,000 | ||
| Gold sales (ounces) | 16,505 | 31,271 | ||
| Financial Review (in millions) | ||||
| Operating Revenues | $44.2 | $81.2 | ||
| Cost of sales (1) | $35.4 | $73.9 | ||
| Earnings from operations | $8.4 | $6.6 | ||
| Cash provided (used) by operating activities | $1.4 | ($12.2) | ||
| Capital expenditures (sustaining) (2) | $10.4 | $18.9 | ||
| Lease payments (sustaining) (2),(5) | $5.2 | $10.6 | ||
| Capital expenditures (growth) (2) | $6.9 | $6.9 | ||
| Capital expenditures (capitalized exploration) (2) | $2.2 | $2.2 | ||
| Mine-site free cash flow (2),(5) | ($18.1 | ) | ($40.2 | ) |
| Cost of sales, including amortization per ounce of gold sold (1) | $2,145 | $2,363 | ||
| Total cash costs per ounce of gold sold (2) | $1,672 | $1,836 | ||
| Mine-site all-in sustaining costs per ounce of gold sold (2),(3) | $2,666 | $2,824 | ||
| Open Pit Operations | ||||
| Tonnes of ore mined – open pit (4) | 1,020,260 | 1,838,496 | ||
| Tonnes of ore mined per day | 11,090 | 10,689 | ||
| Total waste mined – open pit (4) | 3,877,170 | 6,759,562 | ||
| Total tonnes mined – open pit | 4,897,430 | 8,598,059 | ||
| Waste-to-ore ratio | 3.96 | 4.18 | ||
| Average grade of gold (4) | 0.73 | 0.81 | ||
| Mill Operations | ||||
| Tonnes of ore processed | 615,076 | 1,165,551 | ||
| Tonnes of ore processed per day | 6,686 | 6,776 | ||
| Average grade of gold processed (4) | 0.89 | 0.91 | ||
| Contained ounces milled | 17,571 | 33,941 | ||
| Average recovery rate | 94 | % | 95 | % |
(1) Cost of sales includes mining and processing costs, royalties, and amortization.
(2) Refer to the “Non-GAAP Measures and Additional GAAP Measures” disclosure at the end of this press release and associated MD&A for a description and calculation of these measures.
(3) For the purposes of calculating mine-site all-in sustaining costs, the Company does not include an allocation of corporate and administrative and share-based compensation expenses.
(4) Grams per tonne of gold.
(5) Mine-site free cash flow does not include lease payments which are classified as cash flows from financing activities on the consolidated financial statements.
Operational Review (the fourth quarter and Alamos’ ownership period from July 12, 2024 to December 31, 2024)
Magino produced 16,200 ounces of gold in the fourth quarter and 33,000 ounces of gold during Alamos’ ownership period starting July 12, 2024.
Mining rates averaged 53,233 tpd during the fourth quarter, up from 46,258 tpd during the period of ownership in the third quarter. This included 11,090 tpd of ore in the fourth quarter up from 10,228 tpd during the third quarter. With a number of mill optimization initiatives implemented during the second half of 2024, mining activities were focused on stripping activities while continuing to stockpile lower grade ore for future processing.
Mill throughput averaged 6,686 tpd in the fourth quarter down slightly from the third quarter and lower than planned, primarily due to longer than expected downtime to replace the primary crusher. A number of optimization initiatives were implemented within the Magino mill which required downtime during the second half of 2024. This included replacing the secondary crusher during the third quarter, with additional downtime in the fourth quarter to replace the primary crusher.
These improvements were completed by the end of 2024 and will support higher throughput rates going forward. Mill throughput is expected to increase to approximately 11,200 tpd by the end of the first quarter of 2025, at which point the Island Gold mill will be shut down and ore from Island Gold will be trucked and processed through the larger and more cost-effective Magino mill.
Grades processed during the fourth quarter and Alamos’ period of ownership in 2024 were 0.89 g/t Au and 0.91 g/t Au, respectively. Recoveries for the period of ownership were 95%, above expectations reflecting the strong performance of the gravity circuit.
Financial Review (for Alamos’ ownership period from July 12, 2024 to December 31, 2024)
Revenues were $44.2 million for the fourth quarter and $81.2 million for the period of Alamos’ ownership during the second half of the year, with cost of sales of $35.4 million and $73.9 million for the same respective periods. Total cash costs were $1,672 per ounce in the fourth quarter and impacted by lower gold production due to the crushing circuit downtime to replace the primary crusher. Mine-site AISC for the fourth quarter were $2,666 per ounce, an 11% decrease from Alamos’ ownership in the third quarter.
Total capital expenditures, excluding lease payments, were $19.5 million in the fourth quarter and $28.0 million for the period of Alamos’ ownership in the second half of the year, in-line with guidance. Capital spending primarily included capitalized stripping costs, and mobile and fixed plant equipment.
The operation was negative $18.1 million of mine-site free cash flow in the fourth quarter, and negative $40.2 million of mine-site free cash flow during the period of Alamos’ ownership, driven primarily by changes in working capital and mill downtime for the crusher replacements which impacted gold production. The Company expects an improvement to the profitability of the operation in 2025 reflecting higher production and lower costs.
Mulatos District Financial and Operational Review
| Three Months Ended December 31, | Years Ended December 31, | |||||||
| 2024 | 2023 | 2024 | 2023 | |||||
| Gold production (ounces) | 38,900 | 48,100 | 205,000 | 212,800 | ||||
| Gold sales (ounces) | 39,717 | 50,489 | 203,519 | 215,833 | ||||
| Financial Review (in millions) | ||||||||
| Operating Revenues | $107.2 | $99.8 | $487.3 | $420.2 | ||||
| Cost of sales (1) | $64.9 | $68.3 | $283.1 | $265.9 | ||||
| Earnings from operations | $39.9 | $31.0 | $191.1 | $144.4 | ||||
| Cash provided by operating activities | $58.7 | $35.8 | $260.0 | $172.5 | ||||
| Capital expenditures (sustaining) (2) | $1.3 | $1.8 | $4.4 | $11.3 | ||||
| Capital expenditures (growth) (2) | $2.4 | $1.1 | $8.2 | $7.3 | ||||
| Capital expenditures (capitalized exploration) (2) | $1.6 | $5.5 | $7.5 | $11.8 | ||||
| Mine-site free cash flow (2) | $53.4 | $27.4 | $239.9 | $142.1 | ||||
| Cost of sales, including amortization per ounce of gold sold (1) | $1,634 | $1,353 | $1,391 | $1,232 | ||||
| Total cash costs per ounce of gold sold (2) | $1,113 | $957 | $935 | $883 | ||||
| Mine site all-in sustaining costs per ounce of gold sold (2),(3) | $1,198 | $1,030 | $1,001 | $967 | ||||
| La Yaqui Grande Mine | ||||||||
| Open Pit Operations | ||||||||
| Tonnes of ore mined – open pit (4) | 965,182 | 920,058 | 3,951,240 | 3,867,172 | ||||
| Total waste mined – open pit (6) | 4,188,162 | 4,918,849 | 16,185,032 | 22,069,019 | ||||
| Total tonnes mined – open pit | 5,153,345 | 5,838,907 | 20,136,272 | 25,936,191 | ||||
| Waste-to-ore ratio (operating) | 4.34 | 4.97 | 4.10 | 4.99 | ||||
| Crushing and Heap Leach Operations | ||||||||
| Tonnes of ore stacked | 991,160 | 954,127 | 3,960,225 | 3,936,145 | ||||
| Average grade of gold processed (5) | 0.93 | 1.64 | 1.27 | 1.55 | ||||
| Contained ounces stacked | 29,484 | 50,422 | 161,205 | 196,619 | ||||
| Average recovery rate | 98 | % | 67 | % | 98 | % | 78 | % |
| Ore crushed per day (tonnes) | 10,800 | 10,400 | 10,800 | 10,800 | ||||
| Mulatos Mine | ||||||||
| Open Pit Operations | ||||||||
| Tonnes of ore mined – open pit (4) | — | — | — | 2,250,380 | ||||
| Total waste mined – open pit (6) | — | — | — | 1,309,034 | ||||
| Total tonnes mined – open pit | — | — | — | 3,559,415 | ||||
| Waste-to-ore ratio (operating) | — | — | — | 0.58 | ||||
| Crushing and Heap Leach Operations | ||||||||
| Tonnes of ore stacked | — | 758,627 | — | 4,488,365 | ||||
| Average grade of gold processed (5) | — | 2.17 | — | 1.34 | ||||
| Contained ounces stacked | — | 52,924 | — | 193,299 | ||||
| Average recovery rate | — | 27% | — | 31% | ||||
| Ore crushed per day (tonnes) | — | 8,200 | — | 12,300 | ||||
(1) Cost of sales includes mining and processing costs, royalties, and amortization expense.
(2) Refer to the “Non-GAAP Measures and Additional GAAP Measures” disclosure at the end of this press release and associated MD&A for a description and calculation of these measures.
(3) For the purposes of calculating mine-site all-in sustaining costs, the Company does not include an allocation of corporate and administrative and share based compensation expenses.
(4) Includes ore stockpiled during the quarter.
(5) Grams per tonne of gold.
(6) Total waste mined includes operating waste and capitalized stripping.
Mulatos District Operational Review
The Mulatos District produced 38,900 ounces in the fourth quarter, 19% lower than the prior year period due to planned lower grades processed at La Yaqui Grande. Production for the full year totaled 205,000 ounces, exceeding the top end of the revised annual guidance by 5%, reflecting the strong ongoing performance from La Yaqui Grande.
La Yaqui Grande produced 28,900 ounces in the fourth quarter and 158,600 ounces for the full year, exceeding expectations, reflecting higher stacking and recovery rates. Grades stacked averaged 0.93 g/t Au for the fourth quarter, in-line with expectations. Grades stacked over the full year averaged 1.27 g/t Au, consistent with guidance. Stacking rates of 10,800 tpd in both the fourth quarter and full year were above annual guidance of 10,000 tpd. The recovery rate of 98% in the fourth quarter and for the full year was above full year guidance reflecting the timing of ounces stacked relative to their recovery. Recoveries are expected to normalize in 2025 to between 70% and 90%.
Mulatos commenced residual leaching in December 2023 and produced 10,000 ounces in the fourth quarter and 46,400 ounces for the full year, in-line with expectations.
Mulatos District Financial Review
Revenues of $107.2 million in the fourth quarter and $487.3 million for the full year were 7% and 16%, respectively, higher than the comparative periods, reflecting higher realized gold prices, partially offset by lower ounces sold.
Cost of sales decreased to $64.9 million in the fourth quarter, 5% lower than the prior year period, driven by the weaker Mexican peso and lower ounces sold. Cost of sales were $283.1 million for the full year, a 6% increase compared to the prior year due to inflationary pressures, partially offset by lower ounces sold.
Total cash costs of $1,113 per ounce and mine-site AISC of $1,198 per ounce in the fourth quarter were higher than the prior year period, primarily driven by inflation and lower grades stacked at La Yaqui Grande. Full year total cash costs of $935 per ounce and mine-site AISC of $1,001 per ounce were at the low end of guidance, and slightly higher than the prior year due to lower grades stacked.
Capital expenditures totaled $5.3 million in the fourth quarter, including $1.3 million of sustaining capital and $1.6 million of capitalized exploration. For the full year, capital spending totaled $20.1 million, including $4.4 million of sustaining capital and $7.5 million of capitalized exploration. Growth capital spending of $8.2 million for the full year was focused on the completion of the water treatment plant construction at La Yaqui Grande, as well as completion of the hydro electric line connecting the Mulatos District to the national grid at the end of November. This eliminates the need for on-site diesel generated power, greatly reducing GHG emissions, and provides a significant energy cost savings moving forward which has been factored into 2025 guidance.
The Mulatos District generated mine-site free cash flow of $53.4 million for the fourth quarter and a record $239.9 million for the full year, 95% and 69% higher than the prior year periods, respectively. The strong free cash flow generation was net of $7.4 million of cash tax payments in the fourth quarter and $82.2 million in the year. Given the strong profitability of the operation in 2024, the Company expects to make significant cash tax payments in Mexico in 2025, similar to 2024. This includes the 2024 year end tax payment due in the first quarter, which is expected to be approximately $45 million.
Fourth Quarter 2024 Development Activities
Island Gold (Ontario, Canada)
Phase 3+ Expansion
In 2022, the Company released the Phase 3+ Expansion Study conducted on its Island Gold mine. The Phase 3+ Expansion to 2,400 tpd from the current rate of 1,200 tpd will involve various infrastructure investments. These include the installation of a shaft, paste plant, as well as accelerated development to support the higher mining rates. Following the completion of the expansion in 2026, the operation will transition from trucking ore and waste up the ramp to skipping ore and waste to surface through the new shaft infrastructure, driving production higher and costs significantly lower.
On September 4, 2024, the Company announced an update to the initial capital estimate for the Phase 3+ Expansion, reflecting inflation and scope changes since the P3+ Study was completed in the first half of 2022, as well as synergies from the acquisition of Magino. Initial capital for the Phase 3+ Expansion was increased by approximately $40 million to $796 million, a 5% increase from the initial capital estimate provided in the first half of 2022. As of December 31, 2024, 72% of the total initial capital has been spent and committed on the project.
The increase was driven by ongoing inflationary pressures since 2022, and scope changes to the project, partially offset by synergies from the Magino acquisition, and the weaker Canadian dollar. The key changes within the updated capital estimate are as follows:
During the fourth quarter of 2024, the Company spent $74.3 million on the Phase 3+ Expansion and capital development. Progress on the Phase 3+ Expansion during the fourth quarter is summarized as follows:
The Phase 3+ Expansion remains on schedule to be completed in the first half of 2026.
| (in US$M) Growth capital (including indirects and contingency) |
P3+ Estimate Sep 20241 | Spent to date1,2 | Committed to date1 | % of Spent & Committed | |
| Shaft & Shaft Surface Complex | 297 | 217 | 35 | 85 | % |
| Mill Expansion (including Magino mill)4 | 54 | 25 | 27 | 96 | % |
| Paste Plant | 55 | 18 | 13 | 56 | % |
| Power Upgrade | 35 | 18 | 7 | 71 | % |
| Effluent Treatment Plant | 19 | — | — | — | % |
| General Indirect Costs | 80 | 54 | 6 | 75 | % |
| Contingency3 | 18 | — | — | — | |
| Total Growth Capital | $558 | $332 | $88 | 75 | % |
| Underground Equipment, Infrastructure & Accelerated Development | 238 | 154 | — | 65 | % |
| Total Growth Capital (including Accelerated Spend) | $796 | $486 | $88 | 72 | % |
Figure 1. Island Gold shaft site area – January 2025
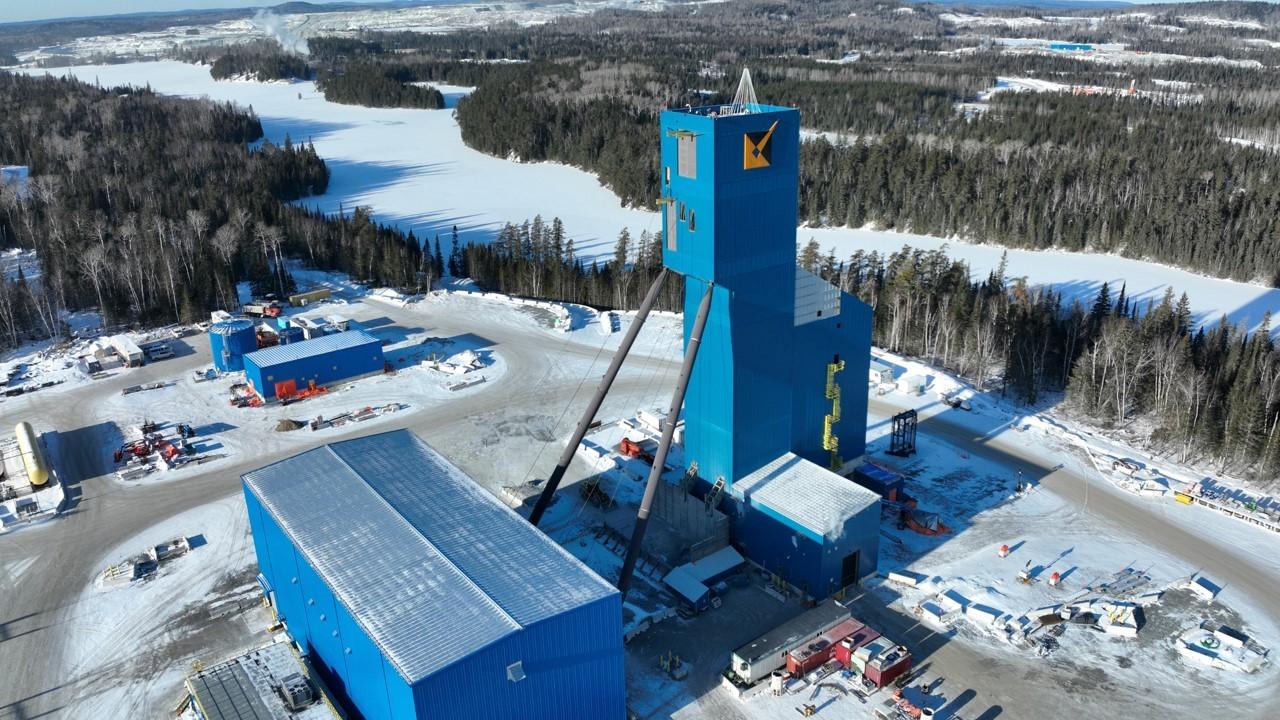
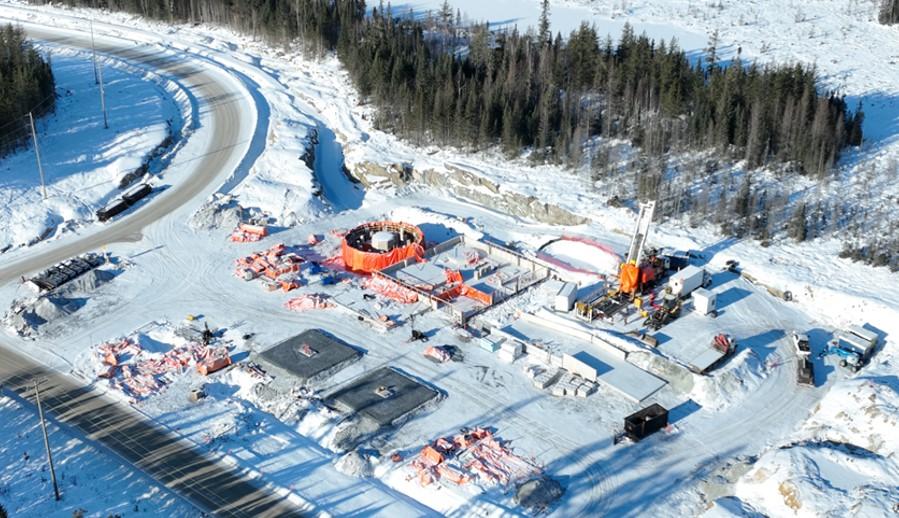
Figure 2. Island Gold paste plant – January 2025
Lynn Lake (Manitoba, Canada)
On January 13, 2025, the Company announced a positive construction decision on the Lynn Lake project. With the approval of the Closure Plan in January 2025, the required permitting and pre-construction conditions have been met allowing for the start of construction on the Lynn Lake project. Construction activities will begin ramping up during the first quarter of 2025 with initial production expected during the first half of 2028.
With average annual production of 176,000 ounces over its first ten years at first quartile mine-site AISC, Lynn Lake is expected to increase consolidated production to approximately 900,000 ounces per year. Growth capital spending at Lynn Lake is expected to be between $100 million and $120 million in 2025 and will be focused on access road upgrades, camp construction, bulk earthworks, and orders for long lead-time items.
Construction activities and capital spending are expected to increase in 2026 and 2027 with first gold production expected in the first half of 2028. Total initial capital for Lynn Lake was estimated to be $632 million in the 2023 Study, based on input costs as of the fourth quarter of 2022. Given ongoing industry-wide labour and materials inflation, which has averaged close to 5% per year since the end of 2022, initial capital is expected to increase by approximately 10%.
Highlights of the 2023 Study include:
Development spending (excluding exploration) was $7.8 million in the fourth quarter of 2024, primarily on detailed engineering and long lead time items. For the full year, development spending (excluding exploration) was $19.7 million.
Burnt Timber and Linkwood
On February 13, 2025, the Company reported positive results of an internal economic study completed on its Burnt Timber and Linkwood satellite deposits located in proximity to the Lynn Lake project in Manitoba, Canada.
In August 2023, the 2023 Study was released on the Lynn Lake project outlining a long-life, low-cost project in Canada with attractive economics. The 2023 Study was based only on the Gordon and MacLellan deposits which are to be mined over the first 11 years, with the processing of lower-grade stockpiled ore for the remainder of the 17-year mine life. The Burnt Timber and Linkwood deposits are expected to provide a source of additional mill feed to the Lynn Lake project starting in year 12, deferring the lower grade stockpiles until later in the mine plan. This is expected to extend the mine life of the combined Lynn Lake project to 27 years, increase longer term production rates, and enhance its economics as a low-capital, high-return satellite project.
Highlights of the Burnt Timber and Linkwood Study include:
Highlights of the combined Lynn Lake, Burnt Timber and Linkwood projects:
PDA (Sonora, Mexico)
On September 4, 2024, the Company reported the results of the development plan for the PDA project located within the Mulatos District. PDA is a higher-grade underground deposit adjacent to the Mulatos open pit and will benefit from the use of existing crushing infrastructure from Cerro Pelon, supporting lower initial capital and project execution risk.
On January 29, 2025, the Company announced it has been granted approval of an amendment to its existing MIA by SEMARNAT, allowing for the start of construction on the PDA project. Construction activities on PDA are expected to begin ramping up toward the middle of 2025. Capital spending on PDA is expected to total $37 to $40 million in 2025 to advance underground development and procurement of mill long lead time items. The remainder of the total initial capital estimate of $165 million will be spent in 2026 and 2027 with first production anticipated mid-2027.
PDA Project Highlights
Kirazlı (Çanakkale, Türkiye)
On October 14, 2019, the Company suspended all construction activities on its Kirazlı project following the Turkish government’s failure to grant a routine renewal of the Company’s mining licenses, despite the Company having met all legal and regulatory requirements for their renewal. In October 2020, the Turkish government refused the renewal of the Company’s Forestry Permit.
The Company had been granted approval of all permits required to construct Kirazlı including the Environmental Impact Assessment approval, Forestry Permit, and GSM (Business Opening and Operation) permit, and certain key permits for the nearby Ağı Dağı and Çamyurt Gold Mines. These permits were granted by the Turkish government after the project earned the support of the local communities and passed an extensive multi-year environmental review and community consultation process.
On April 20, 2021, the Company announced that its Netherlands wholly-owned subsidiaries Alamos Gold Holdings Coöperatief U.A, and Alamos Gold Holdings B.V. would be filing an investment treaty claim against the Republic of Türkiye for expropriation and unfair and inequitable treatment. The claim was filed under the Netherlands-Türkiye Bilateral Investment Treaty. Alamos Gold Holdings Coöperatief U.A. and Alamos Gold Holdings B.V. had their claim against the Republic of Türkiye registered on June 7, 2021 with the International Centre for Settlement of Investment Disputes (World Bank Group).
Bilateral investment treaties are agreements between countries to assist with the protection of investments. The Treaty establishes legal protections for investment between Türkiye and the Netherlands. The Subsidiaries directly own and control the Company’s Turkish assets. The Subsidiaries invoking their rights pursuant to the Treaty does not mean that they relinquish their rights to the Turkish project, or otherwise cease the Turkish operations. The Company will continue to work towards a constructive resolution with the Republic of Türkiye.
The Company incurred $2.2 million in the fourth quarter of 2024 related to ongoing care and maintenance and arbitration costs to progress the Treaty claim, which was expensed. For the full year, the Company incurred $6.5 million.
Fourth Quarter 2024 Exploration Activities
Island Gold District (Ontario, Canada)
Total exploration expenditures during the fourth quarter of 2024 were $5.3 million, of which $3.9 million was capitalized. For 2024, the Company incurred exploration expenditures of $20.3 million of which $14.6 million was capitalized. The focus of the 2024 near mine exploration program was on defining new Mineral Reserves and Resources in proximity to existing production horizons and underground infrastructure through both underground and surface exploration drilling.
The 2024 program was successful in driving another significant year of growth at Island Gold with combined Mineral Reserve and Resources increasing 9% to 6.7 million ounces at substantially higher grades. This included a 32% increase in Mineral Reserves to 2.3 million ounces, with grades increasing 11% to 11.40 g/t Au (6.2 mt). Inferred Mineral Resources also grew 2% to 3.8 million ounces with grades increasing 13% to 16.52 g/t Au.
A total of 50,416 m of underground exploration drilling was completed in 185 holes in 2024. Additionally, 9,849 m of surface exploration drilling was completed in 11 holes. This drilling focused on evaluating targets across the strike extent of the main Island Gold Deposit (E1E and C-Zones), as well as expanding newly defined zones in the hanging wall and footwall of Island Gold.
In addition to the exploration program, 36,686 m of underground delineation drilling was completed in 155 holes in 2024, which focused on the conversion of the large Mineral Resource base to Mineral Reserves. A total of 326m of underground exploration drift development was also completed in 2024. These platforms will allow for ongoing Mineral Resource conversion and Resource growth across the Island Gold deposit.
The regional exploration drilling program at the Island Gold District continued in the fourth quarter, with 2,376m of drilling completed in 11 holes at Cline and Edwards, bringing the year-to-date regional drilling to 10,330 m across 35 holes.
A surface drilling program commenced at Magino subsequent to the acquisition of Argonaut to focus on Mineral Resource expansion and conversion. At year-end, 14,583 m of drilling was completed in 26 holes which were successful in both infilling and expanding mineralization.
The Company provided a comprehensive exploration update in January 2025 on its continued exploration success at Island Gold. Exploration drilling continues to extend high-grade gold mineralization across the Island Gold Deposit, as well as within several hanging wall and footwall structures. A significant portion of the following exploration results were completed after the year-end cut-off for Mineral Reserves and Resource estimates, highlighting the potential for ongoing growth.
Island Gold Main zone exploration highlights: high-grade mineralization extended outside of Mineral Reserves and Resources in the E1E and C-Zones. These zones are the main structures that host the majority of currently defined Mineral Reserves and Resources at Island Gold. Previously reported highlights include1:
Island Gold Hanging Wall and Footwall exploration highlights: high-grade gold mineralization intersected within new and recently defined hanging wall and footwall zones across the main Island Gold Deposit. These zones represent significant opportunities to continue to grow near mine Mineral Reserves and Resources, which are low-cost to develop and produce from given their proximity to existing infrastructure. Previously reported highlights include1:
B Zone
NS2 Zone: expanding a new structure parallel and 200 m east of NS1 Zone
D1 Zone
DN2 Zone: newly defined zone
E1D1 Zone
NTH3 Zone
Other Hanging Wall and Footwall intersections within yet to be defined zones (Unknown Zones): drilling continues to intersect high-grade mineralization beyond currently defined zones and in proximity to existing underground infrastructure. This includes drill hole 890-461-42 (584.20 g/t Au over 6.80 m), located 10 m north of the main C-Zone in Island West. These are part of more than 2,000 intersections above 3 g/t Au outside of existing Mineral Reserves and Resources in the hanging wall and footwall. Through additional drilling, there is excellent potential to define additional new zones supporting significant growth in near-mine Mineral Reserves and Resources. Previously reported highlights include2:
Footwall
Hanging Wall
1 All reported composite intervals are calculated true width of the mineralized zones. Drillhole composite intervals reported as “cut” may include higher grade samples which have been cut to: Island West and Island Main (C-zone) @ 225 g/t Au; Island Main and East (E1E Zone) @ 185 g/t Au; E1D Zone @ 100 g/t; B-Zone, E1D1 and NS1 @ 90 g/t Au; NTH3 @ 60 g/t; D1 and G1 @ 45 g/t Au, DN, DN2, NS2 and NTH zones @ 35 g/t Au.
2 All reported composite intervals are core length, true width is unknown at this time, and gold grades are reported as uncut.
Young-Davidson (Ontario, Canada)
Total exploration expenditures during the fourth quarter of 2024 were $2.9 million, of which $2.0 million was capitalized. For 2024, exploration expenditures totaled $8.9 million of which $5.9 million was capitalized. The majority of the underground exploration drilling program was focused on extending mineralization within the Young-Davidson syenite, which hosts the majority of Mineral Reserves and Resources. Drilling also tested the hanging wall and footwall of the deposit where higher grades have been previously intersected.
In 2024, 24,296 m of underground exploration drilling was completed in 55 holes, which intersected a new style of higher-grade gold mineralization in zones within the hanging wall of the Young-Davidson deposit. These zones are located between 10 and up to 200 m south of existing infrastructure and are in close proximity to already defined Mineral Reserves and Resources, highlighting the upside potential with grades intersected well above the current Mineral Reserve grade of 2.26 g/t of gold. In 2025, 400 m of underground exploration development is planned to establish a hanging wall exploration drift to the south, from the 9620-level. This will allow for drill platforms with more optimal locations and orientations to test the higher-grade mineralization discovered in the hanging wall in 2024.
Regional exploration drilling was undertaken during the year, with 3,454 m of surface drilling completed in 11 holes to test near-surface targets within the 5,900 hectare Young-Davidson Property that could potentially provide future supplemental mill feed.
Mulatos District (Sonora, Mexico)
Total exploration expenditures during the fourth quarter of 2024 were $4.0 million, of which $1.6 million was capitalized. For 2024, exploration expenditures totaled $20.6 million, of which $7.5 million was capitalized.
In 2024, 46,224 m of near-mine drilling was completed in 168 holes, and 18,430 m of regional drilling was completed in 54 holes. The 2024 surface exploration drilling program focused on defining higher-grade mineralization at PDA and Cerro Pelon.
Drilling at Cerro Pelon followed up on wide, high-grade underground oxide and sulphide intersections previously drilled below the Cerro Pelon open pit. Additionally, surface drilling was successful at extending higher-grade mineralization across multiple zones within the PDA area. This drove a 9% increase in Mineral Reserves at PDA within the 2024 year-end update to 1.1 million ounces, with grades largely unchanged at 5.45 g/t Au. Additionally, the 2024 program was successful in defining an initial Measured and Indicated Mineral Resource at Cerro Pelon totaling 104,000 ounces grading 4.49 g/t Au.
During the fourth quarter, exploration activities continued at PDA and the near-mine area with 7,764 m of drilling completed in 28 holes. Drilling was focused on infill drilling the GAP-Victor portion of the Mineral Resource.
At Cerro Pelon, drilling continued to evaluate the high-grade sulphide potential to the north of the historical open pit with a total of 2,872 m completed in eleven holes. West of the pit area, 1,395 m in four holes were drilled targeting sulphide mineralization.
Regional drilling was also initiated at the Halcon Project in the fourth quarter with three drill holes for a total of 633 m. This target, located approximately three kilometres northwest of the La Yaqui Grande Mine, is being evaluated for sulphide mineralization potential.
Lynn Lake (Manitoba, Canada)
Exploration spending totaled $1.2 million in the fourth quarter and $7.4 million for 2024, all of which was capitalized. 2024 exploration was primarily focused on the conversion of Mineral Resources to Mineral Reserves at the Burnt Timber and Linkwood deposits, and to also evaluate the potential for Mineral Resources at Maynard, an advanced stage greenfield target.
In 2024, 16,134 m of drilling were completed in 87 holes and was focused on converting Mineral Resources to Mineral Reserves at Burnt Timber and Linkwood as well as extending mineralization at Maynard. The program was successful with an initial Mineral Reserve of 0.9 million ounces grading 0.95 g/t Au (30.7 mt) declared at Burnt Timber and Linkwood. This drove a 42% increase in total Mineral Reserves within the Lynn Lake District to 3.3 million ounces grading 1.29 g/t Au (80.1 mt).
Qiqavik (Quebec, Canada)
On April 3, 2024, the Company completed the acquisition of Orford Mining, acquiring a 100% interest in the Qiqavik gold project. Qiqavik is a camp scale property covering 438 square kilometres in the Cape Smith Greenstone Belt in Nunavik, Quebec. The Qiqavik Property covers 40 kilometres of strike along the Qiqavik Break, a major crustal-scale structure controlling gold mineralization within the belt. Early-stage exploration completed to date indicates that high-grade gold occurrences are controlled by structural splays off the Qiqavik Break.
Exploration spending totaled $0.8 million in the fourth quarter and $3.7 million for 2024, all of which was expensed.
Exploration activities completed in Q3 2024 were focused on the evaluation of targets with the objective of identifying the highest-priority areas to drill in 2025. This included detailed geological mapping, prospecting, till sampling, and Quaternary field investigations to determine glacial dispersal direction and transport distances. A 500 km2 high-resolution Lidar survey with photo imagery, and a 25 m line-spacing drone magnetic survey, was also flown over four prospective areas.
Review of Fourth Quarter Financial Results
During the fourth quarter of 2024, the Company sold 141,258 ounces of gold for record operating revenues of $375.8 million, representing a 48% increase from the prior year period. The increase was due to higher realized gold prices, and higher sales volumes due to the inclusion of ounces from Magino.
The average realized gold price in the fourth quarter was $2,632 per ounce, 33% higher than the prior year period, and $31 per ounce less the London PM Fix price. The Company’s realized gold price in the fourth quarter was impacted slightly by hedges entered into earlier in the year.
Cost of sales (which includes mining and processing costs, royalties, and amortization) were $200.9 million in the fourth quarter, 21% higher than the prior year period, primarily due to higher cost ounces from Magino with the operation undergoing downtime to implement a number of improvements to the mill. Excluding costs incurred at Magino, cost of sales were $165.5 million which was 1% lower than the prior year period. Key drivers of changes to cost of sales as compared to the prior year period were as follows:
Mining and processing costs were $137.9 million, 22% higher than the prior year period. Excluding costs incurred at Magino, mining and processing costs were $111.6 million, 2% lower than the prior year period. The decrease was driven by the weaker Mexican peso and Canadian Dollar, and lower ounces sold at the Mulatos District.
Total cash costs of $981 per ounce and AISC of $1,333 per ounce were higher than the prior year period driven by the inclusion of the higher cost Magino ounces. Excluding Magino, total cash costs and AISC for the fourth quarter would have been $10 and $74 per ounce lower, respectively, than the prior year period. The decreases were driven by higher grades mined and lower sustaining capital expenditure at Island Gold, partially offset by inflation and lower grades stacked at La Yaqui Grande.
Royalty expense was $4.7 million in the fourth quarter, higher than the prior year period of $2.7 million, due to the higher average realized gold price, and higher number of ounces sold with inclusion of ounces from Magino.
Amortization of $58.3 million in the fourth quarter was higher than the prior year period due to the higher number of ounces sold and the inclusion of amortization from the Magino mine in the current period. On a per ounce basis, amortization of $413 per ounce was higher than the prior year period due to the higher depletion base of the leased assets inherited from Magino.
The Company recognized earnings from operations of $158.4 million in the fourth quarter, 120% higher than the prior year period, driven by record revenues.
As at December 31, 2024, the Company held forward contracts that were acquired as part of the acquisition of Argonaut. These contracts, totaling 100,000 ounces in 2026 and 50,000 ounces in 2027, ensure an average forward price of $1,821 per ounce, and mature monthly throughout 2026 and 2027. Additionally, the Company held certain gold option contracts which matured monthly in 2024. The Company recognized unrealized gains on these gold option and forward contracts of $5.9 million driven by the movement in gold price in the quarter. The Company recognized unrealized losses of $2.0 million on gold option contracts in the prior year period.
The Company reported net earnings of $87.6 million in the fourth quarter, compared to $47.1 million in the prior year period. Adjusted earnings(1) were $103.2 million, or $0.25 per share, which included adjustments for unrealized gains on commodity hedge derivatives, net of tax. In addition, adjusted earnings reflect unrealized net foreign exchange losses recorded within deferred taxes and foreign exchange of $19.6 million and other adjustments totaling $0.4 million.
(1) Refer to the “Non-GAAP Measures and Additional GAAP Measures” disclosure at the end of this press release and associated MD&A for a description and calculation of these measures.
Review of 2024 Financial Results
During the year ended December 31, 2024, the Company sold 560,234 ounces for record operating revenues of $1.3 billion, 32% higher than the prior year, primarily driven by a higher average realized gold price, and higher sale volumes including Magino ounces from the date of acquisition.
Cost of sales (which includes mining and processing costs, royalties, and amortization) for the full year were $751.1 million, an 18% increase compared to the prior year, partly due to the inclusion of Magino. Excluding Magino, cost of sales were $677.2 million, which was 6% higher than the prior year. Key drivers of cost of sales changes as compared to the prior year were as follows:
Mining and processing costs increased to $518.9 million from $437.3 million in the prior year. Excluding the costs incurred at Magino, mining and processing costs would have been $463.1 million, 6% higher than the prior year. This increase was driven by inflationary pressures across the Company’s operations, higher sales volumes at Island Gold, and the inclusion of silver sales as an offset to mining and processing costs in the prior year.
Total cash costs of $927 per ounce and AISC of $1,281 per ounce in 2024 were both higher than the prior year due to the inclusion of the higher-cost ounces from Magino subsequent to the date of acquisition and the impact of inflation. Additionally, both metrics were affected by lower grades milled at Young-Davidson; partially offset by higher grades processed at Island Gold.
Royalty expense was $13.8 million, a 35% increase compared to $10.2 million in the prior year, due to the higher average realized gold price and higher number of ounces sold, with inclusion of ounces from Magino.
Amortization of $218.4 million or $390 per ounce sold, was 15% higher than the prior year, driven by an increase in ounces sold. On a per ounce basis, amortization was higher than the prior year due to the higher depletion base of the leased assets inherited from Magino.
There was a reversal of impairment losses for mineral properties, plant and equipment recorded during 2024 related to the Young-Davidson mine, driven by an increase in long-term gold price assumptions and consistent with the assumptions utilized by the Company in its valuation of the Magino mine. The recoverable amount was determined to be greater than the carrying amount which resulted in an impairment reversal of $57.1 million ($38.6 million, net of tax), which was recorded to mineral property, plant and equipment and an intangible asset.
The Company recognized earnings from operations of $561.9 million, a 77% increase from $318.1 million in the prior year, as a result of higher production and realized gold prices, and a reversal of impairment of $57.1 million related to Young-Davidson.
As at December 31, 2024, the Company held forward contracts that were acquired as part of the acquisition of Argonaut. These contracts, totaling 100,000 ounces in 2026 and 50,000 ounces in 2027, ensure an average forward price of $1,821 per ounce, and mature monthly throughout 2026 and 2027. The Company recognized unrealized losses on the gold option and forward contracts of $24.2 million, compared to unrealized losses of $0.9 million in the prior year, primarily due to the hedge book inherited from Argonaut.
The Company reported net earnings of $284.3 million compared to $210.0 million in the prior year. Included in net earnings was a reversal of impairment of $38.6 million, net of tax, offset by $24.2 million of unrealized losses on commodity hedge derivatives. On an adjusted basis, earnings in 2024 were $328.9 million, or $0.81 per share, which included adjustments for the reversal of impairment, net of tax, and unrealized losses on commodity hedge derivatives, net of tax. In addition, adjusted earnings reflects unrealized foreign exchange losses recorded in deferred taxes of $49.7 million, Argonaut transaction and integration costs of $9.3 million, and other adjustments totaling $6.0 million.
Associated Documents
This press release should be read in conjunction with the Company’s consolidated financial statements for the year ended December 31, 2024 and associated Management’s Discussion and Analysis, which are available from the Company’s website, www.alamosgold.com, in the “Investors” section under “Reports and Financials”, and on SEDAR+ (www.sedarplus.ca) and EDGAR (www.sec.gov).
Reminder of Fourth Quarter and Year-End 2024 Results Conference Call
The Company’s senior management will host a conference call on Thursday, February 20, 2025 at 11:00 am ET to discuss the fourth quarter and year-end 2024 results. Participants may join the conference call via webcast or through the following dial-in numbers:
| Toronto and International: | (416) 406-0743 |
| Toll free (Canada and the United States): | (800) 898-3989 |
| Participant passcode: | 7495836# |
| Webcast: | www.alamosgold.com |
A playback will be available until March 22, 2025 by dialling (905) 694-9451 or (800) 408-3053 within Canada and the United States. The pass code is 4604832#. The webcast will be archived at www.alamosgold.com.
Qualified Persons
Chris Bostwick, FAusIMM, Alamos’ Senior Vice President, Technical Services, who is a qualified person within the meaning of National Instrument 43-101, has reviewed and approved the scientific and technical information contained in this press release.
About Alamos
Alamos is a Canadian-based intermediate gold producer with diversified production from three operations in North America. This includes the Island Gold District and Young-Davidson mine in northern Ontario, Canada, and the Mulatos District in Sonora State, Mexico. Additionally, the Company has a strong portfolio of growth projects, including the Phase 3+ Expansion at Island Gold, and the Lynn Lake project in Manitoba, Canada. Alamos employs more than 2,400 people and is committed to the highest standards of sustainable development. The Company’s shares are traded on the TSX and NYSE under the symbol “AGI”.
GoldHaven Resources Corp. (CSE: GOH) (OTCQB: GHVNF) (FSE: 4QS) is... READ MORE
Brixton Metals Corporation (TSX-V: BBB) (OTCQX: BBBXF) is pleased... READ MORE
2,090,000 MTS OF CONTAINED Cu (Indicated Resource) and 1,385,000 ... READ MORE
Five-year agreements with US$1,000t floor price, no discount to spot pri... READ MORE
29.8 g/t gold over 3.0 meters within 6.0 meters grading 15.0 g/t ... READ MORE


