


![]()
Alamos Gold Inc. (TSX:AGI) (NYSE:AGI) reported its financial results for the quarter ended March 31, 2025.
“We produced 125,000 ounces in the first quarter, meeting the low end of quarterly guidance with a solid performance from Island Gold offset by a slower ramp up of the Magino mill, as well as lower production from Young-Davidson. Both operations have demonstrated a significant improvement in April and we expect this to contribute to stronger production and lower costs in the second quarter. With a further increase in production and decrease in costs expected in the second half of the year, we remain on track to achieve our full year production guidance,” said John A. McCluskey, President and Chief Executive Officer.
“We expect this improvement to continue over the next several years through our portfolio of high-return, low-cost growth projects. The Phase 3+ Expansion continues to track well for completion in 2026, and with construction activities ramping up on Lynn Lake and PDA this year, we expect steady growth over the next several years towards a run rate of 900,000 ounces per year. Longer-term, we see excellent potential to grow production to one million ounces per year through a further expansion of the Island Gold District. Nearly all of this growth is in Canada, it’s all lower cost, and it’s all fully funded providing one of the strongest outlooks in our sector,” Mr. McCluskey added.
First Quarter 2025 Operational and Financial Highlights
(1) Refer to the “Non-GAAP Measures and Additional GAAP Measures” disclosure at the end of this press release and associated MD&A for a description and calculation of these measures.
Highlight Summary
| Three Months Ended March 31, | ||
| 2025 | 2024 | |
| Financial Results (in millions) | ||
| Operating revenues | $333.0 | $277.6 |
| Cost of sales (1) | $195.2 | $173.6 |
| Earnings from operations | $94.7 | $81.4 |
| Earnings before income taxes | $25.7 | $75.6 |
| Net earnings | $15.2 | $42.1 |
| Adjusted net earnings (2) | $59.8 | $51.2 |
| Adjusted earnings before interest, taxes, depreciation and amortization (2) |
$145.4 | $127.2 |
| Cash provided by operating activities before changes in working capital and taxes paid (2) | $131.4 | $135.4 |
| Cash provided by operating activities | $79.6 | $109.4 |
| Capital expenditures (sustaining) (2) | $26.8 | $26.5 |
| Sustaining finance leases (3) | $4.3 | $— |
| Capital expenditures (growth) (2) | $66.3 | $51.6 |
| Capital expenditures (capitalized exploration) | $6.6 | $6.4 |
| Free cash flow (2)(3) | ($20.1) | $24.9 |
| Operating Results | ||
| Gold production (ounces) | 125,000 | 135,700 |
| Gold sales (ounces) | 117,583 | 132,849 |
| Per Ounce Data | ||
| Average realized gold price (5) | $2,802 | $2,069 |
| Average spot gold price (London PM Fix) | $2,859 | $2,070 |
| Cost of sales per ounce of gold sold (includes amortization) (1) |
$1,660 | $1,307 |
| Total cash costs per ounce of gold sold (2) | $1,193 | $910 |
| All-in sustaining costs per ounce of gold sold (2) | $1,805 | $1,265 |
| Share Data | ||
| Earnings per share, basic | $0.04 | $0.11 |
| Earnings per share, diluted | $0.04 | $0.11 |
| Adjusted earnings per share, basic (2) | $0.14 | $0.13 |
| Weighted average common shares outstanding (basic) (000’s) | 420,415 | 396,817 |
| Financial Position (in millions) | ||
| Cash and cash equivalents (4) | $289.5 | $327.2 |
| Three Months Ended March 31, | ||
| 2025 | 2024 | |
| Gold production (ounces) | ||
| Island Gold District (7) | 59,200 | 33,400 |
| Young-Davidson | 35,400 | 40,100 |
| Mulatos District (8) | 30,400 | 62,200 |
| Gold sales (ounces) | ||
| Island Gold District (7) | 53,388 | 34,130 |
| Young-Davidson | 35,475 | 39,810 |
| Mulatos District (8) | 28,720 | 58,909 |
| Cost of sales (in millions) (1) | ||
| Island Gold District (7) | $79.5 | $33.4 |
| Young-Davidson | $65.1 | $65.4 |
| Mulatos District (8) | $50.6 | $74.8 |
| Cost of sales per ounce of gold sold (includes amortization) (1) | ||
| Island Gold District (7) | $1,489 | $979 |
| Young-Davidson | $1,835 | $1,643 |
| Mulatos District (8) | $1,762 | $1,270 |
| Total cash costs per ounce of gold sold (2) | ||
| Island Gold District (7) | $1,068 | $706 |
| Young-Davidson | $1,350 | $1,188 |
| Mulatos District (8) | $1,233 | $840 |
| Mine-site all-in sustaining costs per ounce of gold sold (2)(3) | ||
| Island Gold District (7) | $1,446 | $1,105 |
| Young-Davidson | $1,655 | $1,482 |
| Mulatos District (8) | $1,320 | $905 |
| Capital expenditures (sustaining, growth, and capitalized exploration) (in millions) (2) | ||
| Island Gold District (4)(7)(9) | $72.3 | $54.6 |
| Young-Davidson (5) | $18.8 | $20.2 |
| Mulatos District (6)(8) | $4.0 | $3.9 |
| Other | $8.9 | $5.8 |
(1) Cost of sales includes mining and processing costs, royalties, and amortization expense.
(2) Refer to the “Non-GAAP Measures and Additional GAAP Measures” disclosure at the end of this press release and associated MD&A for a description and calculation of these measures.
(3) For the purposes of calculating mine-site all-in sustaining costs, the Company does not include an allocation of corporate and administrative expense and corporate share-based compensation expense.
(4) Includes capitalized exploration at Island Gold District of $3.9 million for the three months ended March 31, 2025 ($3.5 million for the three months ended March 31, 2024).
(5) Includes capitalized exploration at Young-Davidson of $2.0 million for the three months ended March 31, 2025 ($1.0 million for the three months ended March 31, 2024).
(6) Includes capitalized exploration at Mulatos District of $0.7 million for the three months ended March 31, 2025 ($1.9 million for the three months ended March 31, 2024).
(7) The Island Gold District includes Island Gold and Magino mines for the three months ended March 31, 2025. Comparative prior year period figures do not include the Magino mine, as the acquisition of the Magino mine was completed on July 12, 2024.
(8) The Mulatos District includes Mulatos and La Yaqui Grande mines.
(9) Sustaining capital expenditures for Island Gold District include certain finance leases classified as sustaining.
Environment, Social and Governance Summary Performance
Health and Safety
Alamos strives to maintain a safe, healthy working environment for all, with a strong safety culture where everyone is continually reminded of the importance of keeping themselves and their colleagues healthy and injury-free. The Company’s overarching commitment is to have all employees and contractors return Home Safe Every Day.
Environment
Two minor reportable events occurred during the first quarter. At Young-Davidson, a minor spill of process water occurred within the paste plant which was promptly contained and recovered, preventing it from entering the surrounding environment. The second reportable incident involved a supplier’s equipment malfunction during the transfer of natural gas tanks. Both incidents were promptly reported to regulators.
The Company is committed to preserving the long-term health and viability of the natural environment that surrounds its operations and projects. This includes investing in new initiatives to reduce the Company’s environmental footprint with the goal of minimizing the impacts of its activities.
Community
Ongoing donations, medical support and infrastructure investments were provided to local communities, including:
The Company believes that excellence in sustainability provides a net benefit to all stakeholders. The Company continues to engage with local communities to understand local challenges and priorities. Ongoing investments in local infrastructure, health care, education, cultural and community programs remain a focus of the Company.
Governance and Disclosure
The Company maintains the highest standards of corporate governance to ensure that corporate decision-making reflects its values, including the Company’s commitment to sustainable development.
(1) Frequency rate is calculated as incidents per 200,000 hours worked.
Outlook and Strategy
| 2025 Guidance | |||||||||
| Island Gold District | Young-Davidson | Mulatos District | Lynn Lake | Total | |||||
| Gold production (000’s ounces) | 275 – 300 | 175 – 190 | 130 – 140 | — | 580 – 630 | ||||
| Cost of sales, including amortization (in millions)(3) | $805 | ||||||||
| Cost of sales, including amortization ($ per ounce)(3) | $1,330 | ||||||||
| Total cash costs ($ per ounce)(1) | $725 – $775 | $1,075 – $1,125 | $925 -$975 | — | $875- $925 | ||||
| All-in sustaining costs ($ per ounce)(1) | $1,250 – $1,300 | ||||||||
| Mine-site all-in sustaining costs ($ per ounce)(1)(2) | $1,100 – $1,150 | $1,390 – $1,440 | $1,025 – $1,075 | — | |||||
| Capital expenditures (in millions) | |||||||||
| Sustaining capital(1) | $80 – $85 | $55 – $60 | $3 – $5 | — | $138 – $150 | ||||
| Growth capital(1) | $270 – $300 | $15 – $20 | $37 – $40 | $100 – $120 | $422- $480 | ||||
| Total Sustaining and Growth Capital (1) | $350 – $385 | $70 – $80 | $40 – $45 | $100 – $120 | $560 – $630 | ||||
| Capitalized exploration(1) | $20 | $9 | $6 | $4 | $39 | ||||
| Total capital expenditures and capitalized exploration(1) | $370 – $405 | $79 – $89 | $46 – $51 | $104 – $124 | $599 – $699 | ||||
The Company’s objective is to operate a sustainable business model that supports growing returns to all stakeholders over the long-term, through growing production, expanding margins, and increasing profitability. This includes a balanced approach to capital allocation focused on generating strong ongoing free cash flow while re-investing in high-return internal growth opportunities and supporting higher returns to shareholders.
In January 2025, the Company provided three-year production and operating guidance, which outlined growing production at declining costs over the next three years. Refer to the Company’s guidance press release for a summary of the key assumptions and related risks associated with the comprehensive 2025 guidance and three-year production, cost and capital outlook. The Company’s cost and capital guidance does not factor any potential impact from tariffs introduced by the United States on imports from countries including Canada and Mexico or potential retaliatory tariffs on imports from the United States. The
Company does not expect its revenue structure will be impacted by the tariffs as its gold production is refined in Canada or Europe. The Company’s cost structure predominantly relates to input costs which are not expected to be directly affected by the tariffs, including labour and contractors. The Company will continue to monitor developments and may take steps to limit the impact of any tariffs as may be appropriate in the circumstances.
First quarter production of 125,000 ounces was in-line with the low end of quarterly guidance with a solid quarter from Island Gold offsetting lower production from Young-Davidson and Magino. Following the implementation of a number of optimization initiatives within the Magino mill during the second half of 2024, and early 2025, the operation demonstrated significant improvements in the latter portion of the first quarter. This progress has continued into the second quarter with milling rates averaging approximately 9,500 tonnes per day (“tpd”) in the last two weeks of April with further improvement expected in May.
Higher milling rates at Magino along with increased grades at Young-Davidson and La Yaqui Grande are expected to drive stronger production in the second quarter of between 135,000 and 150,000 ounces. A more significant increase in production is expected into the second half of 2025 driven by higher grades and mining rates at Island Gold, and increasing grades at La Yaqui Grande. The Company remains on track to achieve annual production guidance of between 580,000 and 630,000 ounces.
Reflecting the expected stronger performance moving forward, the Company expects AISC to decrease approximately 20% in the second quarter, with further decreases the remainder of the year. The Company is monitoring its full year cost guidance given higher share-based compensation and royalty costs compared to guidance, which are impacted by factors outside of the Company’s control. Excluding the impact of these variables, the Company remains confident with its full year cost guidance.
The Company’s pipeline of high-return organic growth projects, including the Phase 3+ Expansion, Lynn Lake and PDA all continue to advance supporting one of the strongest growth profiles in the sector. The Phase 3+ Expansion remains on track to be completed during the first half of 2026, driving further production growth at lower costs in 2026. The shaft sink has advanced to a depth of 1,154 metres (“m”) as of late April and remains on track to reach the ultimate planned depth of 1,373 m in the third quarter. The integration of the Magino and Island Gold operations continues to progress with the transition to processing Island Gold ore through the larger and more efficient Magino mill expected to be completed in early May 2025. This is expected to drive significant operating cost synergies starting in the second quarter of 2025, with further improvements in 2026 upon completion of the Phase 3+ Expansion.
Production is expected to increase further to a range of 680,000 to 730,000 ounces in 2027, a 24% increase from 2024, at 8% lower AISC, driven by additional low-cost growth from Island Gold. A further increase in production and decrease in costs is expected into 2028 with the startup of production from Lynn Lake. With average annual production of 176,000 ounces over its first 10 years at first quartile mine-site AISC, Lynn Lake is expected to increase consolidated production to approximately 900,000 ounces per year.
Longer-term, there is excellent potential to increase consolidated production to approximately one million ounces per year through a further expansion of the Island Gold District. This is supported by the large Mineral Reserve and Resource base at Island Gold and Magino, and significant ongoing growth in higher grade Mineral Reserves at Island Gold. An expansion study is currently underway and is expected to be completed during the fourth quarter of 2025.
Capital spending in 2025 will be focused on the ramp up of construction activities at Lynn Lake and PDA, as well as the final full year of spending at the Phase 3+ Expansion. Capital spending is expected to increase modestly into 2026 with lower capital at the Island Gold District offset by the ramp up in spending on Lynn Lake and PDA. In 2027, capital spending is expected to decrease 27% relative to 2026 driven by significantly lower capital at the Island Gold District, and the completion of construction of PDA. A further decrease in capital is expected in 2028 with the completion of construction of Lynn Lake.
The global exploration budget for 2025 is $72 million, a 16% increase from $62 million spent in 2024, and the largest in the Company’s history reflecting broad based exploration success across its assets. The Company continues to demonstrate its long-term track record of value creation through exploration with Global Mineral Reserves increasing 31% in 2024 to 14.0 million ounces (298 mt grading 1.45 g/t Au). This reflected an initial Mineral Reserve at Burnt Timber and Linkwood, tremendous ongoing exploration success at Island Gold, as well as the addition of Magino. Mineral Reserves have now increased for six consecutive years for a cumulative increase of 44% over that time frame.
As previously guided, the Company’s cash flow during 2025 will be impacted by the planned delivery of 49,384 ounces into the gold prepayment facility. The ounces will be delivered monthly in 2025 (4,115 ounces per month) and recorded as revenue based on the prepaid price of $2,524 per ounce. There will be no cash flow associated with the delivery of these ounces in 2025, with proceeds already received in 2024. The Company delivered 12,346 ounces in the first quarter, representing 25% of the gold prepayment facility.
The Company remains well positioned to fund its high-return growth projects internally with strong ongoing free cash flow, $289.5 million of cash and cash equivalents at the end of the first quarter of 2025, and $789.5 million of total liquidity. At current gold prices, the Company expects to generate strong free cash flow through the remainder of 2025 while funding its growth projects, with a significant increase in free cash flow expected following the completion of the Phase 3+ Expansion in 2026, PDA in 2027, and Lynn Lake in 2028.
First Quarter 2025 Results
Island Gold District Financial and Operational Review
| Three Months Ended March 31, | ||
| 2025 | 2024 | |
| Gold production (ounces) | 59,200 | 33,400 |
| Gold sales (ounces) | 53,388 | 34,130 |
| Financial Review (in millions) | ||
| Operating Revenues | $152.0 | $71.0 |
| Cost of sales (1) | $79.5 | $33.4 |
| Earnings from operations | $71.4 | $36.9 |
| Cash provided by operating activities | $86.9 | $40.9 |
| Capital expenditures (sustaining) (2) | $15.5 | $13.5 |
| Lease payments (sustaining) (2),(5) | $4.3 | $— |
| Capital expenditures (growth) (2) | $48.6 | $37.6 |
| Capital expenditures (capitalized exploration) (2) | $3.9 | $3.5 |
| Mine-site free cash flow (2),(5) | $18.9 | ($13.7) |
| Cost of sales, including amortization per ounce of gold sold (1) | $1,489 | $979 |
| Total cash costs per ounce of gold sold (2) | $1,068 | $706 |
| Mine-site all-in sustaining costs per ounce of gold sold (2),(3) | $1,446 | $1,105 |
| Island Gold Mine | ||
| Underground Operations | ||
| Tonnes of ore mined | 110,226 | 106,737 |
| Tonnes of ore mined per day | 1,225 | 1,173 |
| Average grade of gold (4) | 11.50 | 10.53 |
| Metres (“m”) developed | 2,157 | 1,787 |
| Mill Operations | ||
| Tonnes of ore processed | 109,067 | 107,215 |
| Tonnes of ore processed per day | 1,212 | 1,178 |
| Average grade of gold (4) | 11.36 | 10.63 |
| Contained ounces milled | 39,838 | 36,651 |
| Average recovery rate | 98% | 97% |
| Magino Mine | ||
| Open Pit Operations | ||
| Tonnes of ore mined – open pit (7) | 1,064,870 | — |
| Tonnes of ore mined per day | 11,832 | — |
| Total waste mined – open pit (8) | 3,446,128 | — |
| Total tonnes mined – open pit | 4,510,998 | — |
| Waste-to-ore ratio (8) | 3.24 | — |
| Average grade of gold (4) | 0.77 | — |
| Mill Operations | ||
| Tonnes of ore processed | 651,153 | — |
| Tonnes of ore processed per day | 7,235 | — |
| Average grade of gold processed (4) | 0.86 | — |
| Contained ounces milled | 17,920 | — |
| Average recovery rate | 92% | — |
(1) Cost of sales includes mining and processing costs, royalties, and amortization.
(2) Refer to the “Non-GAAP Measures and Additional GAAP Measures” disclosure at the end of this press release and associated MD&A for a description and calculation of these measures.
(3) For the purposes of calculating mine-site all-in sustaining costs, the Company does not include an allocation of corporate and administrative expense and corporate share-based compensation expense.
(4) Grams per tonne of gold (“g/t Au”).
(5) Mine-site free cash flow does not include lease payments which are classified as cash flows used in financing activities on the condensed interim consolidated financial statements.
(6) Comparative prior year period figures do not include the Magino mine, as the acquisition of the Magino mine was completed on July 12, 2024.
(7) Includes ore stockpiled during the quarter.
(8) Total waste mined includes operating waste and capitalized stripping.
The Island Gold District produced 59,200 ounces in the first quarter of 2025, a 77% increase from the prior year period, driven by the inclusion of the Magino mine, which was acquired in July 2024, as well as an increase in tonnes and grades processed from Island Gold.
Island Gold Operational Review
Underground mining rates averaged 1,225 tpd in the first quarter, consistent with guidance. Grades mined averaged 11.50 g/t Au in the first quarter, 9% higher than in the prior year period and consistent with annual guidance.
Mill throughput averaged 1,212 tpd and mill recoveries averaged 98% during the first quarter, consistent with guidance.
Magino Operational Review
Mining rates averaged 50,122 tpd during the first quarter. This included 11,832 tpd of ore, slightly lower than planned for the first quarter. Given lower mill availability, mining rates were focused on waste stripping activities. Mining rates have subsequently improved to average over 15,000 tpd of ore in April, consistent with annual guidance.
Mill throughput increased 8% from the fourth quarter to average 7,235 tpd in the first quarter. Grades processed during the first quarter of 0.86 g/t Au were slightly below the low-end of annual guidance, but are expected to increase to be consistent with guidance for the remainder of the year.
Milling rates were lower than planned due to restricted ore flow through the crushing and conveying circuit. This was caused by deficiencies in the initial ore flow design for winter conditions, which created blockages within the feeders and undersized transfer chutes. The chutes were expanded during the quarter and combined with the various optimization activities undertaken in the second half of 2024, milling rates increased substantially towards the end of the quarter averaging 8,200 tpd in March. This improvement has continued into April with milling rates averaging approximately 9,500 tpd in the last two weeks of April with further improvement expected in May.
In advance of the transition to processing Island Gold ore through the Magino mill, approximately 8,000 tonnes of high grade ore from Island Gold was blended with Magino ore and processed through the Magino mill in April. The batch test was successful, with recoveries in line with expectations.
Reflecting the increased milling rates at Magino, significant improvement in the consistency of the operation, and successful batch test, Island Gold’s mill is expected to be shut down in early May, following which ore from Island Gold will be trucked and processed through the larger and more cost-effective Magino mill.
Financial Review (Island Gold District)
Revenues of $152.0 million in the first quarter were 114% higher than the prior year period, driven by higher realized gold prices and an increase in ounces sold given the acquisition of Magino in mid 2024.
Cost of sales of $79.5 million in the first quarter were 138% higher than the prior year period due to the increase in ounces sold. On a per ounce basis, cost of sales were 52% higher for the first quarter compared to the prior year period due to the inclusion of relatively higher cost ounces from Magino.
Total cash costs were $1,068 per ounce in the first quarter, above the annual guidance range and driven by lower grades processed at Magino and higher unit costs given lower mill throughput. Mine-site AISC were $1,446 per ounce in the first quarter, also higher than the annual guidance range. Costs are expected to trend lower through the remainder of the year as milling rates increase at Magino and mining rates gradually increase at Island Gold and Magino, both driving lower unit operating costs for the district.
Total capital expenditures were $72.3 million in the first quarter, including $48.6 million of growth capital and $3.9 million of capitalized exploration. Growth capital spending remained primarily focused on the Phase 3+ Expansion, including shaft site infrastructure, paste plant, and shaft sinking. The shaft sink advanced to a depth of 1,154 m at the end of April and is scheduled to be completed in the third quarter of 2025. Additionally, bulk earthworks commenced for the expansion of the Magino mill to 12,400 tpd. The expansion of the Magino mill is expected to be completed by mid-2026 to coincide with the completion of the Phase 3+ Expansion at Island Gold.
Mine-site free cash flow was $18.9 million for the first quarter, net of the significant capital investment related to the Phase 3+ Expansion and exploration. At current gold prices, the Island Gold District is expected to continue self funding the Phase 3+ Expansion, exploration and sustaining capital. The operation is expected to generate significant free cash flow from 2026 onward after the completion of the expansion.
Young-Davidson Financial and Operational Review
| Three Months Ended March 31, | ||
| 2025 | 2024 | |
| Gold production (ounces) | 35,400 | 40,100 |
| Gold sales (ounces) | 35,475 | 39,810 |
| Financial Review (in millions) | ||
| Operating Revenues | $101.2 | $82.7 |
| Cost of sales (1) | $65.1 | $65.4 |
| Earnings from operations | $35.1 | $16.8 |
| Cash provided by operating activities | $58.0 | $34.8 |
| Capital expenditures (sustaining) (2) | $10.7 | $11.6 |
| Capital expenditures (growth) (2) | $6.1 | $7.6 |
| Capital expenditures (capitalized exploration) (2) | $2.0 | $1.0 |
| Mine-site free cash flow (2) | $39.2 | $14.6 |
| Cost of sales, including amortization per ounce of gold sold (1) | $1,835 | $1,643 |
| Total cash costs per ounce of gold sold (2) | $1,350 | $1,188 |
| Mine-site all-in sustaining costs per ounce of gold sold (2),(3) | $1,655 | $1,482 |
| Underground Operations | ||
| Tonnes of ore mined | 608,601 | 667,062 |
| Tonnes of ore mined per day | 6,762 | 7,330 |
| Average grade of gold (4) | 2.00 | 1.94 |
| Metres developed | 2,132 | 1,914 |
| Mill Operations | ||
| Tonnes of ore processed | 599,215 | 665,778 |
| Tonnes of ore processed per day | 6,658 | 7,316 |
| Average grade of gold (4) | 2.01 | 1.94 |
| Contained ounces milled | 38,765 | 41,609 |
| Average recovery rate | 91% | 89% |
(1) Cost of sales includes mining and processing costs, royalties and amortization.
(2) Refer to the “Non-GAAP Measures and Additional GAAP Measures” disclosure at the end of this press release and associated MD&A for a description and calculation of these measures.
(3) For the purposes of calculating mine-site all-in sustaining costs, the Company does not include an allocation of corporate and administrative expense and corporate share-based compensation expense.
(4) Grams per tonne of gold (“g/t Au”).
Operational review
Young-Davidson produced 35,400 ounces of gold in the first quarter, 12% lower than the prior year period due to lower tonnes mined, partially offset by higher grades processed and recovery rates.
Mining rates averaged 6,762 tpd in the first quarter, below annual guidance of 8,000 tpd and an 8% decrease compared to the prior year period. This reflected lower production drilling and scoop availability, which impacted stope productivity and the mining sequence. Production drilling metres and scoop availability improved throughout the quarter with mining rates returning to planned levels of 8,000 tpd in March and April, and are expected to remain at similar rates through the rest of the year.
Milling rates averaged 6,658 tpd in the first quarter, 9% lower than the prior year period as a result of lower underground mining rates. During the first quarter, processed grades averaged 2.01 g/t Au, 4% higher than the prior year period and consistent with the low-end of full year guidance. Grades mined are expected to increase in the second quarter and combined with higher mining and processing rates, this is expected to drive stronger production in the second quarter and through the remainder of the year. Mill recoveries averaged 91% for the first quarter, in-line with annual guidance.
Financial Review
Revenues increased to $101.2 million in the first quarter, 22% higher than the prior year period, driven by higher realized gold prices, partially offset by lower ounces sold. Cost of sales were $65.1 million in the first quarter, comparable with the prior year period.
Total cash costs of $1,350 per ounce and mine-site AISC of $1,655 per ounce in the first quarter were higher than the prior year period, primarily due to higher unit costs given the lower mining and processing rates. Costs are expected to decrease through the remainder of the year reflecting higher mining rates and grades.
Capital expenditures in the first quarter totaled $18.8 million, including $10.7 million of sustaining capital and $6.1 million of growth capital. Additionally, $2.0 million was invested in capitalized exploration during the quarter.
Young-Davidson continues to generate strong ongoing mine-site free cash flow, including $39.2 million in the first quarter. Young-Davidson has generated over $100 million in annual mine-site free cash flow for four consecutive years. The operation is well positioned to generate similar free cash flow in 2025 and over the long-term, with a 14 year Mineral Reserve life.
Mulatos District Financial and Operational Review
| Three Months Ended March 31, | ||
| 2025 | 2024 | |
| Gold production (ounces) | 30,400 | 62,200 |
| Gold sales (ounces) | 28,720 | 58,909 |
| Financial Review (in millions) | ||
| Operating Revenues | $84.0 | $123.9 |
| Cost of sales (1) | $50.6 | $74.8 |
| Earnings from operations | $31.1 | $45.8 |
| Cash provided by operating activities | $4.6 | $53.6 |
| Capital expenditures (sustaining) (2) | $0.6 | $1.4 |
| Capital expenditures (growth) (2) | $2.7 | $0.6 |
| Capital expenditures (capitalized exploration) (2) | $0.7 | $1.9 |
| Mine-site free cash flow (2) | $0.6 | $49.7 |
| Cost of sales, including amortization per ounce of gold sold (1) | $1,762 | $1,270 |
| Total cash costs per ounce of gold sold (2) | $1,233 | $840 |
| Mine site all-in sustaining costs per ounce of gold sold (2),(3) | $1,320 | $905 |
| La Yaqui Grande Mine | ||
| Open Pit Operations | ||
| Tonnes of ore mined – open pit | 994,813 | 986,214 |
| Total waste mined – open pit | 4,085,874 | 4,076,910 |
| Total tonnes mined – open pit | 5,080,687 | 5,063,125 |
| Waste-to-ore ratio | 4.11 | 4.13 |
| Crushing and Heap Leach Operations | ||
| Tonnes of ore stacked | 1,022,583 | 981,740 |
| Average grade of gold processed (4) | 0.75 | 1.31 |
| Contained ounces stacked | 24,610 | 41,398 |
| Average recovery rate | 84% | 121% |
| Ore crushed per day (tonnes) | 11,400 | 10,800 |
(1) Cost of sales includes mining and processing costs, royalties, and amortization expense.
(2) Refer to the “Non-GAAP Measures and Additional GAAP Measures” disclosure at the end of this press release and associated MD&A for a description and calculation of these measures.
(3) For the purposes of calculating mine-site all-in sustaining costs, the Company does not include an allocation of corporate and administrative expense and corporate share-based compensation expense.
(4) Grams per tonne of gold (“g/t Au”).
Mulatos District Operational Review
The Mulatos District produced 30,400 ounces in the first quarter, 51% lower than the prior year period due to the planned stacking of lower grades at La Yaqui Grande. Production is expected to increase sequentially through the remainder of the year reflecting the stacking of higher grades.
La Yaqui Grande produced 20,700 ounces in the first quarter, 59% lower than the prior year period. Grades stacked averaged 0.75 g/t Au for the first quarter, consistent with the low-end of annual guidance. As previously guided, grades stacked are expected to increase through the year, from the low end of guidance in the first quarter to the high end by the fourth quarter. Stacking rates were 11,400 tpd in the first quarter, exceeding annual guidance. The recovery rate of 84% in the first quarter was consistent with the annual guidance range of 70% to 90%.
Mulatos commenced residual leaching in December 2023 and produced 9,700 ounces in the first quarter, in-line with expectations. The operation is expected to benefit from ongoing gold production at decreasing rates through the remainder of 2025.
Mulatos District Financial Review
Revenues of $84.0 million in the first quarter were 32% lower than the prior year period, reflecting lower ounces sold, partially offset by higher realized gold prices. Cost of sales decreased to $50.6 million in the first quarter, 32% lower than the prior year period, driven by lower ounces sold.
Total cash costs of $1,233 per ounce and mine-site AISC of $1,320 per ounce in the first quarter were higher than the prior year period, primarily due to lower grades processed at La Yaqui Grande. Costs are expected to decrease through the remainder of the year as higher grades are mined and processed, consistent with plan.
Capital expenditures totaled $4.0 million in the first quarter, including $0.6 million of sustaining capital and $0.7 million of capitalized exploration. Growth capital spending of $2.7 million was primarily related to procurement and detailed engineering for PDA.
The Mulatos District generated mine-site free cash flow of $0.6 million in the first quarter, net of $48.3 million of cash tax payments, primarily related to the 2024 income and mining taxes payable reflecting the profitability of the operation. Cash tax payments are expected to decrease to average between $10 and $15 million per quarter for the remainder of the year, related to the 2025 tax year. The Mulatos District is expected to generate stronger mine-site free cash flow through the remainder of the year reflecting higher production, lower costs and lower cash tax payments.
First Quarter 2025 Development Activities
Island Gold (Ontario, Canada)
Phase 3+ Expansion
In 2022, the Company announced the Phase 3+ Expansion at Island Gold to 2,400 tpd from the current rate of 1,200 tpd, which will involve various infrastructure investments. These include the installation of a shaft, paste plant, as well as accelerated development to support the higher mining rates. Following the completion of the expansion in 2026, the operation will transition from trucking ore and waste up the ramp to skipping ore and waste to surface through the new shaft infrastructure, driving production higher and costs significantly lower.
On September 4, 2024, the Company announced an update to the Phase 3+ Expansion with initial capital increased by approximately $40 million to $796 million, a 5% increase from the initial capital estimate provided in 2022. The increase reflects inflation and scope changes since the Phase 3+ Expansion commenced in 2022, partially offset by synergies from the acquisition of Magino, and the weaker Canadian dollar. As of March 31, 2025, 75% of the total initial capital has been spent and committed on the project.
During the first quarter of 2025, the Company spent $46.3 million on the Phase 3+ Expansion and capital development. Progress on the Phase 3+ Expansion during the first quarter is summarized as follows:
The Phase 3+ Expansion remains on schedule to be completed in the first half of 2026.
| (in US$M) Growth capital (including indirects and contingency) |
P3+ Estimate Sep 20241 |
Spent to date1,2 | Committed to date1 | % of Spent & Committed |
| Shaft & Shaft Surface Complex | 297 | 224 | 24 | 84% |
| Mill Expansion (including Magino mill) 4 | 54 | 32 | 24 | 104% |
| Paste Plant | 55 | 25 | 10 | 64% |
| Power Upgrade | 35 | 22 | 5 | 77% |
| Effluent Treatment Plant | 19 | — | — | —% |
| General Indirect Costs | 80 | 60 | 4 | 80% |
| Contingency3 | 18 | — | — | — % |
| Total Growth Capital | $558 | $363 | $67 | 77% |
| Underground Equipment, Infrastructure & Accelerated Development | 238 | 165 | — | 69% |
| Total Growth Capital (including Accelerated Spend) | $796 | $528 | $67 | 75% |
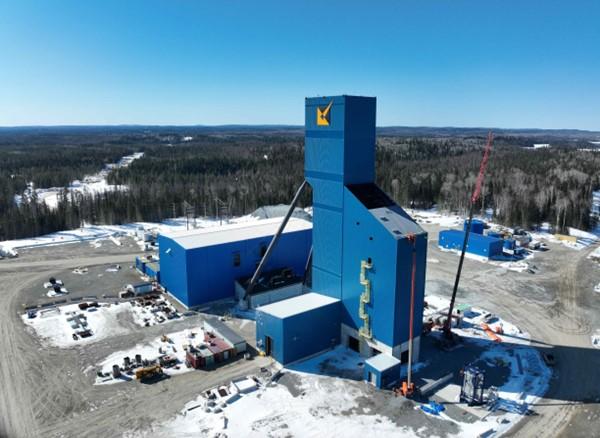
Island Gold shaft site area – April 2025
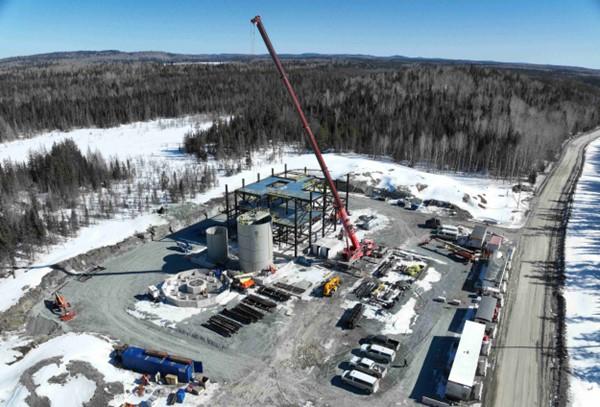
Island Gold paste plant – April 2025
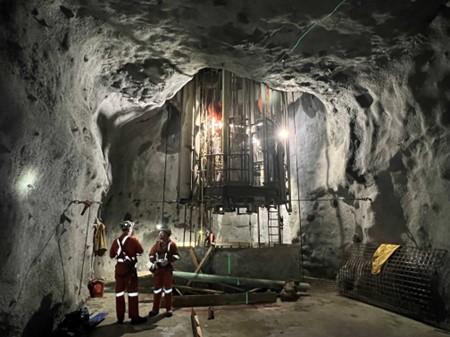
Island Gold 1050L shaft station with galloway – March 2025
Lynn Lake (Manitoba, Canada)
On January 13, 2025, the Company announced a positive construction decision on the Lynn Lake project. With the approval of the Closure Plan in January 2025, the required permitting and pre-construction conditions have been met allowing for the start of construction on the Lynn Lake project. During the quarter, the Company also signed an IBA with MCCN. Concurrently, MCCN withdrew its application for judicial review of the positive Decision statement issued by the Minister of Environment and Climate Change Canada in respect of the Lynn Lake Project and its corresponding internal appeal of the Environment Act Licenses issued by the Province of Manitoba. The Company now has IBA’s in place with both of the First Nation communities proximate to the Lynn Lake project.
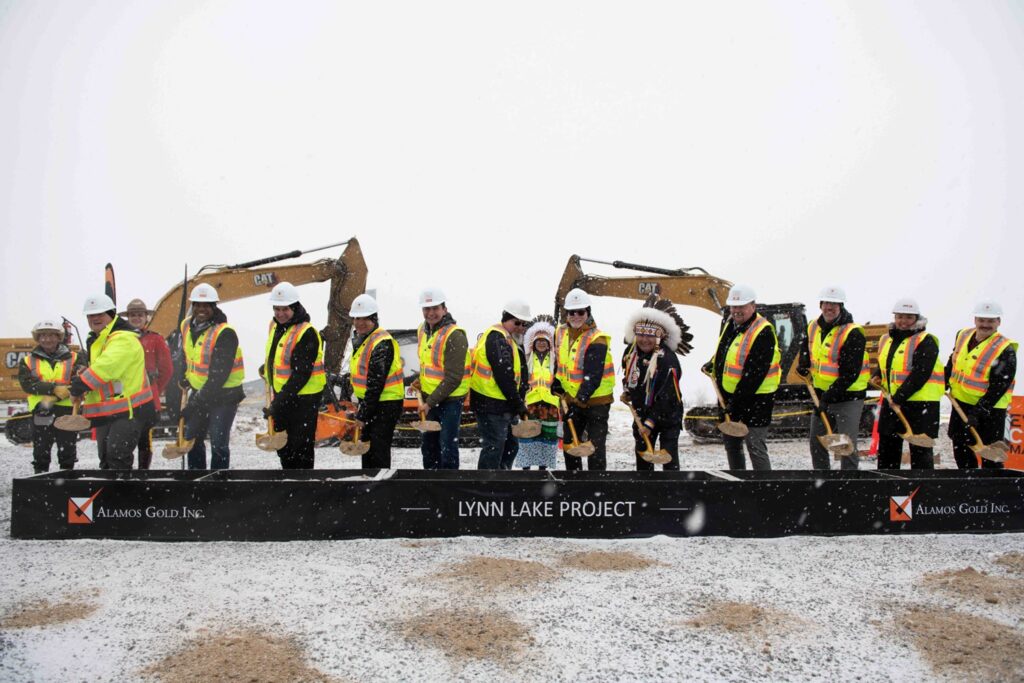
Alamos’ senior leadership team attended a groundbreaking ceremony at the end of March 2025, alongside the Premier of Manitoba, Provincial Ministers, the Mayor of Lynn Lake, as well as representatives from the First Nations and local communities. Construction activities began ramping up during the quarter with initial production expected during the first half of 2028. With average annual production of 176,000 ounces over its first ten years at first quartile mine-site AISC, Lynn Lake is expected to increase consolidated production to approximately 900,000 ounces per year.
Growth capital spending at Lynn Lake is expected to be between $100 million and $120 million in 2025 and will be focused on access road upgrades, camp construction, bulk earthworks, and orders for long lead-time items. Construction activities and capital spending are expected to increase in 2026 and 2027 with first gold production expected in the first half of 2028. Total initial capital for Lynn Lake was estimated to be $632 million in the 2023 Study, based on input costs as of the fourth quarter of 2022. Given ongoing industry-wide labour and materials inflation, which has averaged close to 5% per year since the end of 2022, initial capital is expected to increase by approximately 10%.
On February 13, 2025, the Company reported positive results of an internal economic study completed on its Burnt Timber and Linkwood satellite deposits located in proximity to the Lynn Lake project. The 2023 Study for Lynn Lake was based only on the Gordon and MacLellan deposits which are to be mined over the first 11 years, with the processing of lower grade stockpiled ore for the remainder of the 17-year mine life. The Burnt Timber and Linkwood deposits are expected to provide a source of additional mill feed to the Lynn Lake project starting in year 12, deferring the lower grade stockpiles until later in the mine plan. This is expected to extend the mine life of the combined Lynn Lake project to 27 years, increase longer term production rates, and enhance its economics as a low-capital, high-return satellite project.
The two deposits are expected to have an average annual production of 83,000 ounces of gold over a 10 year mine life. By leveraging mining equipment and planned processing infrastructure at Lynn Lake, the project is expected to be developed for low initial capital of $67 million. This is expected to contribute to high returns for the Burnt Timber and Linkwood satellite deposits, with an after-tax IRR of 54%, and after-tax NPV (5%) of $177 million at a base case gold price assumption of $2,200 per ounce and CAD/USD foreign exchange rate of $0.75:1. At a gold price of $2,800 per ounce and CAD/USD foreign exchange rate of $0.70:1, returns increase to an after-tax IRR of 83% and after-tax NPV (5%) of $292 million.
Development spending (excluding exploration) was $6.7 million in the first quarter of 2025, primarily on temporary camp installation, site facilities, tree clearing, recruitment, process design engineering, construction planning, and community relations efforts. Development spending is expected to ramp up throughout the year.
Lynn Lake ground breaking ceremony – March 2025
PDA (Sonora, Mexico)
On September 4, 2024, the Company reported the results of the development plan for the PDA project located within the Mulatos District. PDA is a higher-grade underground deposit adjacent to the Mulatos open pit and will benefit from the use of existing crushing infrastructure from Cerro Pelon, supporting lower initial capital and project execution risk.
On January 29, 2025, the Company announced it has been granted approval of an amendment to its existing MIA by SEMARNAT, allowing for the start of construction on the PDA project. Construction activities on PDA are expected to begin ramping up toward the middle of 2025. Capital spending on PDA is expected to total $37 to $40 million in 2025 to advance underground development and procurement of mill long lead time items. The remainder of the total initial capital estimate of $165 million will be spent in 2026 and 2027 with first production anticipated mid-2027.
As outlined in the 2024 development plan, PDA is expected to produce an average of 127,000 ounces per year over the first four years and 104,000 ounces over the current mine life (based on Mineral Reserves as at December 31, 2023). Total cash costs are expected to average $921 per ounce and mine-site AISC $1,003 per ounce, consistent with the Company’s overall low cost structure.
Reflecting the low cost structure and low initial capital, PDA is expected to be a high-return project with significant exploration upside. PDA has an estimated after-tax IRR of 46% and after-tax NPV (5%) of $269 million using base case gold price assumption of $1,950 per ounce and a MXN/USD foreign exchange rate of 18:1. Using a $2,500 per ounce gold price, PDA’s after-tax IRR increases to 73%, and after-tax NPV (5%) increases to $492 million.
Development spending (excluding exploration) was $2.7 million in the first quarter of 2025, primarily on detailed engineering and refurbishing the crushing equipment from Cerro Pelon. Spending on PDA is expected to progressively increase throughout the year with underground development commencing in the second half of the year.
Kirazlı (Çanakkale, Türkiye)
On October 14, 2019, the Company suspended all construction activities on its Kirazlı project following the Turkish government’s failure to grant a routine renewal of the Company’s mining licenses, despite the Company having met all legal and regulatory requirements for their renewal. In October 2020, the Turkish government refused the renewal of the Company’s Forestry Permit. The Company had been granted approval of all permits required to construct Kirazlı including the Environmental Impact Assessment approval, Forestry Permit, and GSM (Business Opening and Operation) permit, and certain key permits for the nearby Ağı Dağı and Çamyurt Gold Mines. These permits were granted by the Turkish government after the project earned the support of the local communities and passed an extensive multi-year environmental review and community consultation process.
On April 20, 2021, the Company announced that its Netherlands wholly-owned subsidiaries Alamos Gold Holdings Coöperatief U.A, and Alamos Gold Holdings B.V. (the “Subsidiaries”) would be filing an investment treaty claim against the Republic of Türkiye for expropriation and unfair and inequitable treatment. The claim was filed under the Netherlands-Türkiye Bilateral Investment Treaty (the “Treaty”). Alamos Gold Holdings Coöperatief U.A. and Alamos Gold Holdings B.V. had their claim against the Republic of Türkiye registered on June 7, 2021 with the International Centre for Settlement of Investment Disputes (World Bank Group).
Bilateral investment treaties are agreements between countries to assist with the protection of investments. The Treaty establishes legal protections for investment between Türkiye and the Netherlands. The Subsidiaries directly own and control the Company’s Turkish assets. The Subsidiaries invoking their rights pursuant to the Treaty does not mean that they relinquish their rights to the Turkish project, or otherwise cease the Turkish operations. The Company will continue to work towards a constructive resolution with the Republic of Türkiye.
The Company incurred $1.1 million in the first quarter of 2025 related to ongoing care and maintenance and arbitration costs to progress the Treaty claim, which was expensed.
First Quarter 2025 Exploration Activities
Island Gold District (Ontario, Canada)
A total of $27 million is budgeted for exploration at the Island Gold District in 2025, up from $20 million spent in 2024. The exploration program will build on the success from 2024, with high-grade gold mineralization extended across the Island Gold deposit, as well as within multiple structures within the hanging wall and footwall.
As announced on February 18, 2025, Mineral Reserves increased 32% to 2.3 million ounces with grades increasing 11% to 11.40 g/t Au (6.2 mt). This marked the 12th consecutive year of Mineral Reserve growth. Inferred Mineral Resources increased 2% to 3.8 million ounces with grades also increasing 13% to 16.52 g/t Au (7.1 mt). Consistent with the increase in Mineral Reserve grades, a key driver of the increase in Mineral Resource grades has been significantly higher-grade additions in the lower portions of Island East and Island Main where 324,000 ounces were added. With the deposit open laterally and at depth, and some of best intercepts ever drilled at Island Gold located within the lower portion of Island East, there is excellent potential for further growth in Mineral Reserves and Resources. The discovery cost of the high-grade Mineral Resource additions averaged an attractive $13 per ounce in 2024, and $13 per ounce over the past five years.
Following up on this success, a total of 41,500 m of underground drilling is planned in 2025 with a focus on defining new Mineral Reserves and Resources in proximity to existing production horizons and infrastructure. This includes drilling across the strike extent of the main Island Gold deposit (E1E and C-Zones), as well as within a growing number of newly defined hanging-wall and footwall zones.
Additionally, 18,000 m of surface exploration drilling has been budgeted targeting the area between the Island Gold and Magino deposits, as well as the down-plunge extension of the Island Gold deposit, below a depth of 1,500 m. Included within sustaining capital, 30,800 m of underground delineation drilling is planned and focused on the conversion of the large Mineral Resource base to Mineral Reserves.
Magino’s exploration program has been incorporated into the broader Island Gold District budget which totals $27 million. The focus in 2025 will be expanding mineralization to the east of the pit which was previously constrained by the border with Island Gold prior to the acquisition. Included within 2025 sustaining capital guidance is 18,000 m of surface delineation drilling planned at Magino. The focus of the delineation drilling is the conversion of the large Mineral Resource base to Mineral Reserves.
The regional exploration program at the Island Gold District includes 10,000 m of surface drilling, consistent with the 2024 program. The focus will be following up on high-grade mineralization intersected at the Cline and Edwards deposits located approximately seven km northeast of the Island Gold mine. Drilling will also be completed at the Island Gold North Shear target, and to the east and along strike from the Island Gold mine to test the extension of the E1E-zone.
During the first quarter, at Island Gold, 8,504 m of underground exploration drilling was completed in 32 holes, and 3,492 m of surface drilling was completed in six holes. Additionally, a total of 7,416 m of underground delineation drilling was completed in 26 holes, focused on in-fill drilling to convert Mineral Resources to Mineral Reserves. A total of 72 m of underground exploration drift development was also completed during the first quarter.
At Magino, 7,664 m of surface drilling was completed in 16 holes during the first quarter, focused on in-fill drilling to convert Mineral Resources to Mineral Reserves.
The regional exploration drilling program also commenced in the first quarter, with 854 m completed in three holes targeting mineralization at the past-producing Cline-Edwards Mines.
Total exploration expenditures during the first quarter of 2025 were $5.0 million, of which $3.9 million was capitalized.
Young-Davidson (Ontario, Canada)
A total of $11 million is budgeted for exploration at Young-Davidson in 2025, an increase from $9 million spent in 2024. This includes 25,600 m of underground exploration drilling focused on extending mineralization in the syenite, and continuing to evaluate and expand on the newly defined hanging wall zones.
To support the program, 500 m of underground exploration development is planned, including 400 m to establish a hanging wall exploration drift to the south, from the 9620 level. This will allow for drill platforms with more optimal locations and orientations to test the higher grade mineralization discovered in the hanging wall.
The regional program includes 6,000 m of drilling focused on evaluating the Otisse NE target, located approximately three km northeast of Young-Davidson. A comprehensive data compilation project will also commence in 2025 for the Wydee and Matachewan projects, which were acquired in the third quarter of 2024, and located to the west and east of Young-Davidson, respectively.
During the first quarter, two underground exploration drills completed 5,290 m in ten holes from the 9305 and 9500 levels. Drilling is targeting syenite-hosted mineralization as well as continuing to test mineralization in the hanging wall sediments and mafic-ultramafic stratigraphy.
Total exploration expenditures during the first quarter of 2025 were $3.0 million, of which $2.0 million was capitalized.
Mulatos District (Sonora, Mexico)
A total of $19 million is budgeted at Mulatos for exploration in 2025, down slightly from $21 million spent in 2024. The near-mine and regional drilling program is expected to total 45,000 m. This includes 15,000 m of surface exploration drilling at the GAP-Victor and PDA Extension targets at PDA, and 20,000 m planned at Cerro Pelon.
The regional exploration program includes 10,000 m of drilling focused on advanced and greenfield targets within the Mulatos District.
Ongoing exploration success at PDA in 2024 drove a 9% increase in Mineral Reserves to 1.1 million ounces, with grades largely unchanged at 5.45 g/t Au. PDA is a higher-grade underground deposit located adjacent to the main Mulatos pit. The results of a positive internal economic study were announced in September 2024 and highlighted an attractive, low-cost, high-return project. With the amendment to the environmental permit received earlier this year, construction activities are expected to begin ramping up towards the middle of the year with first production anticipated mid-2027.
The planned addition of a mill to process higher-grade sulphides has created new opportunities for growth within the Mulatos District. This includes Cerro Pelon, where drilling in 2024 followed up on wide high-grade underground oxide and sulphide intersections previously drilled below the pit. The 2024 program was successful in defining an initial Measured and Indicated Mineral Resource at Cerro Pelon totaling 104,000 ounces, grading 4.49 g/t Au. Cerro Pelon remains open in multiple directions and will be a focus of the 2025 exploration program as a significant opportunity for further growth. As the deposit is located within trucking distance of the planned PDA mill, this represents upside to the PDA project.
During the first quarter, exploration activities continued at PDA and the near-mine area with 2,390 m of drilling completed in nine holes. The focus was on infill drilling the GAP-Victor portion as well as the eastern extent of the PDA zone.
Drilling also commenced at Cerro Pelon to evaluate the high-grade sulphide potential to the north of the historical open pit. A total of 1,900 m in five holes were completed in the first quarter. Additionally, 1,690 m was drilled in five holes, testing greenfield targets across the property.
Total exploration expenditures during the first quarter of 2025 were $3.0 million, of which $0.7 million was capitalized.
Lynn Lake (Manitoba, Canada)
A total of $4 million is budgeted for exploration at the Lynn Lake project in 2025, down from $7 million spent in 2024, with the focus shifting to the ramp up of construction activities. The exploration program includes 7,000 m of drilling focused on expanding Mineral Resources at the Burnt Timber and Linkwood deposits. The Company will also continue prioritizing a pipeline of prospective exploration targets within the 58,000 ha Lynn Lake Property.
As reported on February 18, 2025, total Mineral Reserves for the Lynn Lake District increased 42% to 3.3 million ounces, with grades decreasing 15% to 1.29 g/t Au. This was driven by the successful conversion of Mineral Resources to Reserves at Burnt Timber and Linkwood in 2024 resulting in an initial Mineral Reserve of 0.9 million ounces grading 0.95 g/t Au.
Burnt Timber and Linkwood are satellite deposits to the Lynn Lake project and are expected to provide additional mill feed. An internal economic study on Burnt Timber and Linkwood was released on February 13, 2025, outlining an attractive, low capital, high-return project. Burnt Timber and Linkwood are expected to extend the mine life of the Lynn Lake project, increase longer term rates of production, and enhance the overall economics. The combined mine life of the Lynn Lake project is expected to increase to 27 years, up from the 17 years outlined in the Lynn Lake Feasibility Study.
Surface exploration drilling in the first quarter focused on Mineral Resource expansion drilling at both Burnt Timber and Linkwood, with 7,268 m completed in 41 holes. The drill program was completed at the end of the quarter.
Exploration spending totaled $1.9 million in the first quarter, all of which was capitalized.
Qiqavik (Quebec, Canada)
A total of $7 million has been budgeted for exploration at the Qiqavik project in 2025, up from $4 million spent in 2024. The project was acquired in April 2024 through the acquisition of Orford Mining Corporation.
Qiqavik is a camp-scale property covering 60,400 ha in the Cape Smith Greenstone Belt in Nunavik, Quebec. The Qiqavik project covers 50 km of strike covering prospective gold hosting environments and several major crustal-scale structures such as the Qiqavik break and the Bergeron fault. Early-stage exploration completed to date indicates that high-grade gold occurrences are controlled by structural splays off the Qiqavik break.
The 2025 exploration program will focus on drilling prospective targets identified in 2024 through detailed geological mapping, prospecting, till sampling, and a high-resolution Lidar survey with photo imagery. A total of 7,000 m of heli-supported surface drilling is planned with two rigs and focused on testing the highest priority target areas. The program will also focus on advancing other targets across the belt with ongoing geological mapping, drone magnetics, prospecting, and additional till sampling.
Exploration activities in the first quarter were focused on ongoing data interpretation to support targeting ahead of the drill program which is expected to commence late in the second quarter.
Exploration spending totaled $0.3 million in the first quarter, all of which was expensed.
Review of First Quarter Financial Results
During the first quarter of 2025, the Company sold 117,583 ounces of gold for operating revenues of $333.0 million, representing a 20% increase from the prior year period. The increase was due to higher realized gold prices and the inclusion of ounces at Magino given its acquisition in July 2024, partially offset by lower sales volumes at La Yaqui Grande due to planned stacking of lower grades. Ounces sold were 6% lower than production in the quarter due to timing, with the sale of these ounces to benefit future quarters.
The average realized gold price in the first quarter was $2,802 per ounce, 35% higher than the prior year period. This was $57 per ounce less the London PM Fix price, reflecting the delivery of the 12,346 ounces into the gold prepayment facility executed in July 2024 based on the prepaid price of $2,524 per ounce.
Cost of sales (which includes mining and processing costs, royalties, and amortization expense) were $195.2 million in the first quarter, 12% higher than the prior year period, primarily due to the inclusion of higher cost ounces from Magino. Excluding costs incurred at Magino, cost of sales were $152.0 million which was 12% lower than the prior year period, driven by lower ounces sold from other operations. Key drivers of changes to cost of sales as compared to the prior year period were as follows:
Mining and processing costs were $139.0 million, 15% higher than the prior year period primarily due to the inclusion of ounces sold at Magino. Excluding costs incurred at Magino, mining and processing costs were $109.5 million, 10% lower than the prior year period. The decrease was primarily driven by lower ounces sold.
Total cash costs of $1,193 per ounce and AISC of $1,805 per ounce were above the prior year period driven by the higher costs per ounce at Young-Davidson and Magino and increased share-based compensation. Given the 45% increase in the share price during the quarter, the revaluation of previously issued share-based compensation increased AISC by approximately $210 per ounce compared to the prior year period, and by approximately $230 per ounce compared to budget. The other drivers of the increase in costs were lower mining rates at Young-Davidson and lower grades stacked at La Yaqui Grande.
Royalty expense was $4.8 million in the first quarter, higher than the prior year period expense of $2.6 million, due to the higher average realized gold price, and inclusion of royalty expense from Magino.
Amortization of $51.4 million in the first quarter was consistent with the prior year period. On a per ounce basis, amortization of $437 per ounce was higher than the prior year period, reflecting the inclusion of Magino which has a higher amortization base.
The Company recognized earnings from operations of $94.7 million in the first quarter, 16% higher than the prior year period, driven by higher revenues.
As at March 31, 2025, the Company held forward contracts that were acquired as part of the acquisition of Argonaut. These contracts, totaling 100,000 ounces in 2026 and 50,000 ounces in 2027, have an average forward price of $1,821 per ounce, and mature monthly throughout 2026 and 2027. The Company recognized unrealized losses of $68.4 million on the forward contracts inherited from Argonaut driven by the movement in gold price in the quarter. The Company recognized unrealized losses of $1.5 million on gold option contracts in the prior year period.
The Company reported net earnings of $15.2 million in the first quarter, compared to $42.1 million in the prior year period. Adjusted earnings (1) were $59.8 million, or $0.14 per share, which included adjustment for unrealized loss on commodity hedge derivatives, net of tax of $46.3 million. In addition, adjusted earnings reflect unrealized foreign exchange gains recorded within deferred taxes and foreign exchange gains totaling $2.5 million and other adjustments of $0.8 million.
(1) Refer to the “Non-GAAP Measures and Additional GAAP Measures” disclosure at the end of this press release and associated MD&A for a description and calculation of these measures.
Associated Documents
This press release should be read in conjunction with the Company’s consolidated financial statements for the three-month period ended March 31, 2025 and associated Management’s Discussion and Analysis which are available from the Company’s website, www.alamosgold.com, in the “Investors” section under “Reports and Financials”, and on SEDAR+ (www.sedarplus.ca) and EDGAR (www.sec.gov).
Qualified Persons
Chris Bostwick, FAusIMM, Alamos’ Senior Vice President, Technical Services, who is a qualified person within the meaning of National Instrument 43-101 (“Qualified Person”), has reviewed and approved the scientific and technical information contained in this press release.
About Alamos
Alamos is a Canadian-based intermediate gold producer with diversified production from three operations in North America. This includes the Island Gold District and Young-Davidson mine in northern Ontario, Canada, and the Mulatos District in Sonora State, Mexico. Additionally, the Company has a strong portfolio of growth projects, including the Phase 3+ Expansion at Island Gold, and the Lynn Lake project in Manitoba, Canada. Alamos employs more than 2,400 people and is committed to the highest standards of sustainable development.
ValOre Metals Corp. (TSX‐V: VO) (OTCQB: KVLQF) (Frankfurt: KEQ0... READ MORE
Updated binding long-form term sheet with the Government of Canad... READ MORE
G Mining Ventures Corp. (TSX:GMIN) (OTCQX:GMINF) reported its fin... READ MORE
B2Gold Corp. (TSX: BTO) (NYSE: BTG) (NSX: B2G) is pleased to anno... READ MORE
Strengthens Project Execution Through a Preferred Engineering and... READ MORE


