


![]()
1911 Gold Corporation (TSX-V: AUMB) (OTCQX: AUMBF) (FRA: 2KY) is pleased to announce significant positive results from the independent Preliminary Economic Assessment for the True North Gold Project, located in southeastern Manitoba, Canada. The PEA was prepared by AMC Mining Consultants (Canada) Ltd. in accordance with National Instrument 43-101 Standards of Disclosure for Mineral Project, with all financial figures expressed in Canadian Dollars unless otherwise stated.
The PEA outlines a robust gold mining operation utilizing the fully built and permitted infrastructure, including shafts, underground workings, and the processing and tailings management facility. 1911 Gold has estimated the infrastructure replacement value as being in excess of $400 million. The plan targets steady-state production of 58,114 ounces per annum with a mine life of 11 years.
PEA Highlights:
| 1. | AISC and Free Cash Flow are non-IFRS financial measures and have no standardized meaning under IFRS Accounting Standards (“IFRS”), and may not be comparable to similar measures used by other issuers. |
“The delivery of this PEA marks another defining moment for 1911 Gold, outlining a highly efficient, low-capital path to the first phase of production with robust economics and exceptional returns,” stated Shaun Heinrichs, President and Chief Executive Officer of 1911 Gold. “This plan leverages existing infrastructure and a mining strategy suited to the ore body, significantly reducing the project’s capital intensity and technical hurdles that challenged previous operators. Our staged development approach provides a disciplined roadmap to ramp up operations toward an initial steady-state production. This PEA proves that True North is not just a restart story, but is the cornerstone of a district-scale gold project in one of Canada’s premier mining jurisdictions.”
Eric Vinet, Chief Operating Officer of 1911 Gold, stated “This PEA outlines a foundational plan to restart operations at True North by optimizing existing infrastructure and confirms the economic viability of a safe and efficient multi-mine operation. Beyond the scope of this study, we see significant potential to further optimize these economics by establishing a centralized ‘super-level’ on Level 16. By connecting the adjacent zones at Hinge, 007, and, potentially, Cohiba directly to the True North Main Shaft, we can transition to a gravity-fed, horizontal haulage model. The proximity of these zones – notably Hinge, located within 100 m of existing infrastructure – supports the technical rationale for centralized hoisting, which has the potential to materially reduce operating costs.”
True North PEA Overview
Table 1: Summary of True North Project Economics
| General | Unit | LOM Total / Avg. |
| Gold price assumption (Long Term) | per ounce | US$3,000 |
| Gold price assumption (2027) | per ounce | US$3,500 |
| Gold Price assumption (2028) | per ounce | US$3,200 |
| Exchange rate | ($US:$CAD) | 0.72 |
| Mine life | years | 11 |
| Total mill feed | tonnes | 4,066,000 |
| Average diluted grade (LOM) | g/t Au | 4.32 |
| Economics (pre-tax) | Unit | LOM Total / Avg. |
| Net present value (NPV 5%) | millions | 526.7 |
| Internal rate of return (IRR) | % | 118 % |
| Payback | years | 2.2 |
| LOM avg. annual cash flow | millions | 67.1 |
| LOM cumulative cash flow | millions | 732.8 |
| Steady State (yrs 3-8) avg. annual cash flow | millions | 93.0 |
| Economics (after-tax) | Unit | LOM Total / Avg. |
| Net present value (NPV 5%) | millions | 390.6 |
| Internal rate of return (IRR) | % | 105 % |
| Payback | years | 2.2 |
| LOM avg. annual cash flow | millions | 48.9 |
| LOM cumulative cash flow | millions | 544.5 |
| Steady Sate (yrs, 3-8) avg. annual cash flow | millions | 68.2 |
| Profitability index (NPV/initial capital) | ratio | 6.6 |
| Peak investment (Annual) | millions | 59.2 |
| Production | Unit | LOM Total / Avg. |
| Mill head grade | g/t Au | 4.32 |
| Mill head grade (years 2029-2034) | g/t Au | 4.40 |
| Mill recovery rate (average LOM) | % | 93.5 % |
| Average mining rate (years 2029-2034) | tpd | 1,215 |
| Production cont… | Unit | LOM Total / Avg. |
| Average annual gold production LOM | ounces | 47,945 |
| Average gold production (years 2029-2034) | ounces | 58,114 |
| Peak grade (year 2031) | g/t Au | 4.70 |
| Peak gold production (year 2031) | ounces | 61,327 |
| Total LOM recovered gold | ounces | 527,400 |
| Operating Costs | Unit | LOM Total / Avg. |
| Mining cost | $/t milled | 175 |
| Processing cost | $/t milled | 38 |
| G&A cost | $/t milled | 37 |
| Total operating costs | $/t milled | 250 |
| Refining & transport cost | $/oz | 3.17 |
| Royalty NSR | % | 0 % |
| Cash costs* | US$/oz | 1,390 |
| AISC** | US$/oz | 1,897 |
| Capital Costs | Unit | LOM Total / Avg. |
| Initial capital | millions | 59.2 |
| Pre-commercial production capital | millions | 46.7 |
| Sustaining capital | millions | 367.2 |
| Closure costs | millions | 7.3 |
| Salvage value | millions | 2.3 |
|
Notes |
||
| * Cash costs consist of mining costs, processing costs, mine-level general & administrative expenses and refining charges and royalties. | ||
| ** AISC includes cash costs plus sustaining capital, closure cost and salvage value. |
The PEA is preliminary in nature, includes inferred Mineral Resources that are considered too speculative geologically to have economic considerations applied to them that would enable them to be categorized as Mineral Reserves, and there is no certainty that the PEA will be realized. Mineral Resources that are not Mineral Reserves do not have demonstrated economic viability.
Sensitivities
1911 Gold has conducted a sensitivity analysis using the PEA financial model on the base case pre-tax and after-tax NPV and IRR of the Project, using the following variables: metal price, initial capex, total operating costs, and foreign exchange. Table 2 shows the after-tax sensitivity analysis results at various long term gold price assumptions.
As shown in Table 3 and Table 4, the sensitivity analysis revealed that the project is most sensitive to changes in gold prices, and foreign exchange and less sensitive to capital and operating costs.
| Table 2: After-Tax Sensitivity Summary | ||||||
| Gold Price
(US$/oz) |
$2,000 | $2,600 | $3,000
Long-term (Base Case) |
$3,800 | $4,800 | $5,500 |
| After-tax NPV(5%), millions | ($41) | $247 | $391 | $665 | $998 | $1,237 |
| IRR | -1.3 % | 50.0 % | 105.3 % | 611.0 % | NA* | NA* |
| Profitability index | -0.7 | 4.2 | 6.6 | 11.2 | 16.9 | 20.9 |
| Payback (years) | 17.0 | 4.4 | 2.2 | 1.2 | 0.9 | 0.7 |
| Notes: | ||||||
| * There are no years with negative cash flow to calculate an IRR
|
||||||
| Table 3: After-Tax NPV5% Sensitivity | |||||||
| Gold Price | After-Tax NPV5% | Initial CAPEX (CAD$M) |
Total OPEX ($CADM)) |
FX (CAD$M) | |||
| (US$/oz) | (Base Case) | (-25 %) | (+25 %) | (-25 %) | (+25 %) | (-25 %) | (+25 %) |
| $2,000 | ($41) | ($5) | ($82) | $140 | ($233) | ($322) | $213 |
| $2,600 | $247 | $283 | $204 | $371 | $95 | ($67) | $476 |
| $3,000 | $391 | $426 | $348 | $506 | $268 | $92 | $647 |
| $3,600 | $595 | $631 | $552 | $712 | $478 | $281 | $902 |
| $4,000 | $731 | $767 | $688 | $1,012 | $785 | $391 | $1,066 |
| $4,700 | $971 | $1,007 | $928 | $1,081 | $853 | $570 | $1,365 |
| Table 4: After-Tax IRR Summary | |||||||
| Gold Price | After-Tax IRR | Initial CAPEX (CAD$M) | Total OPEX (CAD$M) | FX (CAD$M) | |||
| (US$/oz) | (Base Case) | (-25 %) | (+25 %) | (-25 %) | (+25 %) | (-25 %) | (+25 %) |
| $2,000 | -2 % | 4 % | (6 %) | 28 % | NA* | NA* | 41 % |
| $2,600 | 50 % | 98 % | 31 % | 99 % | 20 % | (6 %) | 167 % |
| $3,000 | 105 % | 420 % | 58 % | 214 % | 55 % | 19 % | 516 % |
| $3,600 | 341 % | NA* | 119 % | 1,813 % | 159 % | 60 % | NA* |
| $4,000 | 1727 % | NA* | 189 % | NA* | 349 % | 105 % | NA* |
| $4,700 | NA* | NA* | 595 % | NA* | NA* | 289 % | NA* |
| Notes: | |||||||
| * There are no years with negative cash flow to calculate an IRR | |||||||
Mining
The True North Gold Project will consist of underground mining extraction via four access points: the Main “A” Shaft, the Hinge decline, the Cohiba decline and later the SG-1 decline. Initial mining and development will be through the Main “A” shaft, providing access to Level 16 (-695 metres) and Level 26 (-1,145 metres), and the Hinge decline, maximizing current underground development to accelerate development and minimize initial capital costs. The initial plan for the development is to ramp up to a steady-state daily production rate of 1,215 tpd (from years 3-8).
The mineral deposits and zones used in the mine plan are contained in a number of deposit areas over a lateral distance of over 4,500 metres and down to depths of over 1,450 m below surface through a series of winzes and internal declines. The deposits are all amenable to underground mining using longitudinal long-hole open stope mining methods, with minimum dimensions of 25 m long by 1.5 m wide by 18 m high between sublevels, assuming 15% dilution with no gold grade and 97% mining recovery. The mining cycle will incorporate a strategic backfill plan, utilizing development waste rock to fill depleted stopes. This will enhance ground stability and significantly reduce operating costs by minimizing the volume of waste material required to be hoisted to surface, thereby optimizing available shaft capacity for high-grade ore.
A total of 4,066,000 tonnes at an average diluted grade of 4.32 g/t Au will be extracted under the current proposed plan for a total of 527,100 oz of payable gold produced.
Table 5: Mining Areas and Projected Production*
| Access | Deposit | Tonnes | Grade | Ounces |
| Shaft/Decline | Zone | t | g/t Au | oz |
| A Shaft | 710 Complex | 1,163,297 | 4.67 | 174,812 |
| Deep East | 196,967 | 4.94 | 31,309 | |
| L24 | 189,780 | 3.83 | 23,393 | |
| Cartwright | 284,082 | 4.14 | 37,849 | |
| Sub-total | 1,834,128 | 4.53 | 267,363 | |
| Hinge Decline | Hinge | 191,776 | 3.98 | 24,564 |
| L13 | 71,124 | 3.02 | 6,915 | |
| 007 | 345,201 | 3.63 | 40,332 | |
| L10 | 352,372 | 5.15 | 58,390 | |
| Sub-Total | 960,475 | 4.22 | 130,201 | |
| Cohiba | Cohiba | 71,902 | 4.73 | 10,944 |
| SG-1 and new portal | Normandy | 1,199,399 | 4.03 | 155,557 |
| Total | 4,065,904 | 4.32 | 564,065 | |
| Notes | ||||
| *Tonnage and grade estimates derived from the Mineral Resource estimate prepared by Lions Gate Geological Consulting (Q.P Susan Lomas, P.Geo), effective date 29 August 2024 (see below). AMC applied a cut-off grade of 2.7 g/t Au to the resource model and then allowed for dilution and mining losses. Gold price used in the cut-off calculation was US$2,500 per ounce, exchange rate of 0.72 CA dollars to one US dollar. | ||||
Within the “A” shaft, mineralized material will be loaded on the Level 26 loading pocket and skipped to the mill at surface and, for the decline, accessed deposits will be hauled via trucks to the True North processing facility. Processed tailings will be pumped to the central operating and permitted tailings management facility. Development waste is currently planned to be stored on surface and used for ongoing infrastructure projects, including possible tailings dam wall lifts in the future.
Processing
The fully permitted processing facility operated for a number of years and is reported to have produced 1.93 million oz of gold historically from 9.60 million tonnes at a grade of 6.65 g/t Au. The process plant consists of a crushing and grinding circuit, with a portion of the circulating load passed through gravity concentrators. The concentrate from the gravity concentration is upgraded on a shaking table and the resulting concentrate direct smelted. The tails from the concentration are returned to the head of the grinding mill and the fines from the grinding circuit are fed into a flotation circuit to produce a flotation concentrate which is reground and leached with the remaining process feed using a six-stage carbon-in-pulp circuit. Dissolved gold is then eluted and gold doré is smelted and poured at site with an electric induction furnace.
An upgrade of the crushing circuit is required to restart commercial production, otherwise the remainder of the processing plant is intact and recently operated. Historically, the process plant has recorded average recoveries of 94.0% of contained gold and has operated up to 2,250 tpd.
| Table 6: Mining & Processing Inputs | ||
| Mine life – Total | years | 11 |
| Mining Rate | ||
| Underground* | tpd | 1,215 |
| Total mill feed | million tonnes | 4.07 |
| Gold grade (diluted) | g/t | 4.32 |
| Processing | ||
| Feed rate* | tpd | 1,215 |
| Total tonnes processed | million tonnes | 4.07 |
| Mill head grade | g/t Au | 4.32 |
| LOM gold recovery | % | 93.5 % |
| Notes: | ||
| * Steady state average daily mining rate (Years 3 to 8) | ||
Tailings Management
The Tailings Management Facility is located 1.6 km north of the processing facility in an area naturally defined by bedrock ridges around the perimeter of a flat area. Tailings have been pumped from the processing facility to the TMF via pipeline. During mine operations the tailings are transported as slurry, with 34% solids by weight. An expansion of the facility was completed in 2015 with the construction of the East Tailings Management area, located immediately east of the TMF, including the polishing pond, where water is pumped in and discharged as required. Enough storage exists within the TMF for approximately 775,000 tonnes or over 2 years production under the PEA mine plan and permits are in place to expand the capacity of the TMF as needed.
Figure 1. Tonnage Production Profile
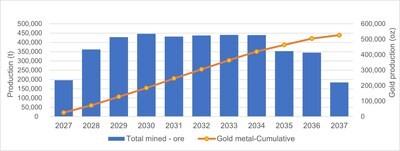
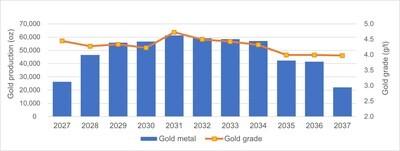
Figure 2. Gold Production Profile
Operating Costs
Operating costs have been estimated using the following sources and assumptions:
| Table 7: Total Life of Mine Operating Costs | ||
| Operating Costs (life of mine average) | ||
| Mining costs (underground) | $/t milled | 175 |
| Processing costs | $/t milled | 38 |
| G&A costs | $/t milled | 37 |
| Total site operating costs | $/t milled | 250 |
| Cash Costs | ||
| Cash costs (LOM)* | US$/oz | 1,390 |
| AISC (LOM)** | US$/oz | 1,897 |
| Notes | ||
| * Cash costs consist of mining costs, processing costs, mine-level general & administrative expenses and refining charges and royalties. | ||
| ** AISC includes cash costs plus sustaining capital, closure cost and salvage value. | ||
Initial and Sustaining Capital Costs
The total initial (pre-production) capital cost is estimated to be $59.2 million with an additional $46.7 million of capital during the first 2 years ramp-up period, prior to commercial production. Sustaining capital costs are estimated to be $367.2 million over the LOM (excluding $5.0 million of closure costs and salvage value).
The initial and sustaining capital costs were compiled using the following sources:
| Table 8: Total Capital Costs | ||||
| Description | Initial Capital Cost |
Pre-Commercial Production* Capital Cost |
Total Sustaining Cost |
Total Capital Cost |
| (millions) | (millions) | (millions) | (millions) | |
| Mining Development | $3.3 | $29.5 | $300.8 | $333.5 |
| Process Plant | $0.6 | $1.5 | $6.7 | $8.8 |
| Infrastructure On-site | $52.8 | $6.4 | $64.8 | $123.9 |
| Total Directs | $56.6 | $37.4 | $372.2 | $466.2 |
| Project in-directs including owner’s cost and EPCM | $0.5 | $1.9 | $0.0 | $2.4 |
| Contingency | $2.0 | $7.5 | $0.0 | $9.5 |
| Total Capital Costs | $59.2 | $46.7 | $372.2 | $478.1 |
| Notes: | ||||
| *Capital during ramp-up in years 1 and 2, prior to commercial production | ||||
LOM Cash Flow
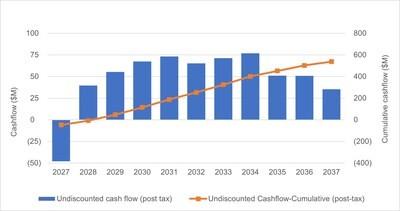
The project is expected to generate $545 million undiscounted after-tax free cash flow (Base Case, see Figure 3.), and $1,314 million undiscounted after-tax free cash flow (at a gold price of US$4,800). Once operational, the mine is expected to support approximately 326 full-time positions, contributing to local employment and regional economic development.
Figure 3. LOM Undiscounted After-Tax Free Cash Flow
1911 Gold Opportunities
The PEA results offer consideration of several initiatives that may enhance the Project, including:
Processing Capacity & Efficiencies:
Additional Resource Opportunities:
Waste Reduction and Operational Efficiencies:
True North Gold Project Mineral Resource Estimate
The Mineral Resource estimate in the PEA was disclosed in the “NI 43-101 Technical Report on the True North Gold Project, Bissett, Manitoba, Canada“, issued on December 24, 2024. The underground 2024 MRE is based on a drill hole database that was rebuilt by 1911 Gold personnel (completed on July 31, 2024) containing a total of 7.960 drill holes, with a total core length of 1,529,232 m.
| Table 9: True North Gold Project: Underground Mineral Resource Estimate | |||
| (within 2.25 g/t Au mineral resource constraining envelopes) | |||
| Mineral Resource | Tonnage | Gold Grade | Contained Gold |
| (Category) | (t) | (g/t) | (oz) |
| Indicated Resources | 3,516,000 | 4.41 | 499,000 |
| Inferred Resources | 5,490,000 | 3.65 | 644,000 |
| Notes: | |||
| 1. | The effective date of the MRE is August 29, 2024, which is the date when all scientific and technical data was submitted to Lions Gate Geological Consulting (“LGGC”). | ||
| 2. | The MRE follows the November 29, 2019, CIM Estimation of Mineral Resources and Mineral Reserves Best Practice Guidelines. | ||
| 3. | Mineral Resources are not Mineral Reserves and do not have demonstrated economic viability. There is no certainty that all or any part of the Mineral Resources estimated will be converted into Mineral Reserves. The estimate of Mineral Resources may be materially affected by environmental, permitting, legal, title, taxation, socio-political, marketing, or other relevant issues. | ||
| 4. | The CIM definitions were followed for the classification of Indicated and Inferred Mineral Resources. Indicated Mineral Resources were assigned for blocks with three drill holes within 30 m (100 feet “ft”) and inferred blocks were assigned for blocks with one drill hole within 46 m (150 ft). | ||
| 5. | Ounces and tonnes have been rounded to the nearest 1,000 therefore sums in the table may not add-up due to rounding. | ||
| 6. | Resource constraining envelopes were built around contiguous clusters of blocks at a nominal cut-off grade of 2.25 g/t Au. The mineral resources are reported at a 0.00 g/t Au cut-off within the envelopes. The gold grade threshold for the resource envelopes of 2.25 g/t Au is based on assumptions of a gold price of US$2,000/oz, an exchange rate of US$/C$ 0.75, mining operating costs of C$132/t, processing costs of C$34/t, G&A of C$12/t and average gold recoverability of 94%. The vein solids were built with a minimum width of 1.2 m. This same width was used for the mineral resource envelopes. | ||
| 7. | A bulk density of 2.76 t/m3 (0.086 short tons/ft3) was used to convert volumes to tonnes for all blocks in the mineral resource estimation. | ||
| 8. | The assay gold values were capped to 342.5 g/t Au (10 oz/short ton) and a restricted outlier strategy was applied to each vein to restrict local extreme grades to 15 m (50 ft) from the composite. | ||
| 9. | Gold grades were estimated into a 4.6 m (15 ft) block model using inverse distance squared (ID2) method and 0.46 m (1.5 ft) composited data restricted within the vein solids. | ||
1911 Gold Path to Production in 2027
The following workflow is anticipated in preparation for True North to commence commercial gold production in 2027:
1911 Gold Planned Exploration (To Advance Alongside Production Readiness):
The Company will provide additional details in the NI 43-101 PEA technical report to be filed under the Company’s profile on SEDAR+ and on the Company website within 45 days.
Qualified Persons
The PEA study was prepared for 1911 Gold as per NI 43-101 requirements by the following Qualified Persons from AMC, and based on the Mineral Resource Estimate completed by LGGC in 2024:
The scientific and technical information contained in this news release has been reviewed and approved by Michele Della Libera, P.Geo., Vice President of Exploration, and Seok Joon Kim, P.Eng., Chief Engineer of 1911 Gold, who are Qualified Persons within the meaning of NI 43-101. The scientific and technical information pertaining to the PEA has been reviewed and approved by the above mentioned QP’s.
About 1911 Gold Corporation
1911 Gold is an advanced gold explorer and developer focused on its 100%-owned True North Gold Project in the Archean Rice Lake Greenstone Belt in Manitoba, Canada. The Company controls a large, highly prospective ~62,000-hectare land package with numerous past-producing gold operations within trucking distance of the fully built and permitted True North mine and mill complex. 1911 Gold is positioning itself to restart operations in 2027 and offers a unique, near-term production story with significant exploration upside. The strategy is to build a district-scale gold mining operation around a centralized, and readily expandable infrastructure to support a socially and environmentally responsible, long-term mining operation with little development risk and a growing mineral resource base.
1911 Gold’s True North complex and the exploration land package are located within and among the First Nation communities of the Hollow Water First Nation and the Black River First Nation. 1911 Gold looks forward to maintaining open, cooperative, and respectful communications with all of our local communities and stakeholders to foster mutually beneficial working relationships.
Kuya Silver Corporation (CSE: KUYA) (OTCQB: KUYAF) (FSE: 6MR1) is pleased to announce financial and ... READ MORE
RPX Gold Inc. (TSX-V: RPX) (OTCQB: RDEXF) is pleased to announce gold assay results from its 2025-20... READ MORE
Honey Badger Silver Inc. (TSX-V: TUF) (OTCQB: HBEIF) (FSE: 1QA) (Tradegate: 1QA) is pleased to outli... READ MORE
Empress Royalty Corp. (TSX-V: EMPR) (OTCQX: EMPYF) is pleased to announce its financial and operatin... READ MORE
Guanajuato Silver Company Ltd. (TSX-V:GSVR)(OTCQX:GSVRF) is pleased to announce financial informati... READ MORE


