


FireFly Metals Ltd (ASX: FFM) (TSX: FFM) is pleased to announce a substantial Mineral Resource increase comprising strong growth in tonnes, grade and contained metal at its Green Bay Copper-Gold Project in Newfoundland, Canada.
Exceptional result includes a spectacular high-grade Mineral Resource of 8.8Mt @ 3.9% CuEq (346kt CuEq) in M&I and 10.9Mt @ 3.8% CuEq (414kt CuEq) in Inferred categories; This recently established high-grade core zone stands to deliver huge benefits to the Project’s development potential, particularly in the early years
KEY POINTS
Substantial Mineral Resource Increase and Upgrade:
The Outlook – Mineral Resource growth and upgrades, eight rigs, economic studies, offtake discussions, regional discoveries:
FireFly Managing Director Steve Parsons said: “This outstanding result cements Green Bay’s status as one of the most compelling copper development projects in the world.
“In just 12 months, we have grown the total Mineral Resource significantly. At the same time, we have established a high-grade core which stands to deliver huge benefits to the Project’s development potential, particularly in the initial years of production.
“We will maintain our relentless push to create shareholder value, with eight rigs on the job, to upgrade more of Inferred Mineral Resources to Measured and Indicated and to make new regional discoveries.
“And the appetite for our product is clearly very strong, with several parties signing confidentiality agreements and talks on offtake and funding progressing well.”
The Mineral Resource Estimate as updated in this announcement (November 2025 MRE) now stands at 50.4Mt @ 2.0% for 1Mt CuEq in the higher confidence Measured and Indicated classifications plus an additional 29.3Mt @ 2.5% for 722kt CuEq in the Inferred category (Table 1). This represents a 35% increase in tonnes and a 51% increase in CuEq metal from the Mineral Resource Estimate announced by the Company on 29 October 2024 (October 2024 MRE).
Importantly, the MRE contains a zone of higher-grade material comprised of volcanogenic massive sulphide (VMS) mineralisation plus the recently discovered ‘core zone’ which totals 8.8Mt @ 3.9% CuEq in M&I and a further 10.9Mt @ 3.8% CuEq in the Inferred category.
Copper remains the dominant metal in the MRE (863kt M&I plus 566kt Inferred Resources) with gold forming an important by-product (546koz M&I plus 563koz Inferred Resources). Silver is also present in significant quantities in the latest MRE (5.0Moz M&I plus 4.8Moz Inferred Resources).
The total discovery cost per estimated tonne of CuEq metal added in this MRE is exceptionally low at C$25.122 (US$17.83) per tonne.
The Ming Deposit has been sampled exclusively by diamond drilling. A total of 1,334 diamond holes for a total drilled meterage of 319,534m was used to estimate the November 2025 MRE.
The Mineral Resource consists of two components, namely the Ming Deposit (47.5Mt @ 2.0% CuEq M&I plus 23.1Mt @ 2.6% CuEq Inferred) and the Little Deer deposit (2.9Mt @ 2.3% CuEq M&I plus 6.2Mt @ 1.8% CuEq Inferred). All growth has come from the Ming Deposit with the Little Deer MRE remaining unchanged since the October 2024 MRE.
| TONNES | COPPER | GOLD | SILVER | CuEq | ||||
| (Mt) | Grade | Metal | Grade | Metal | Grade | Metal | Grade | |
| (%) | (‘000 t) | (g/t) | (‘000 oz) | (g/t) | (‘000 oz) | (%) | ||
| Measured | 6.3 | 1.5 | 94 | 0.3 | 50 | 1.9 | 388 | 1.7 |
| Indicated | 44.1 | 1.7 | 769 | 0.4 | 496 | 3.3 | 4,638 | 2.1 |
| TOTAL M&I | 50.4 | 1.7 | 863 | 0.3 | 546 | 3.1 | 5,026 | 2.0 |
| Inferred | 29.3 | 1.9 | 566 | 0.6 | 563 | 5.1 | 4,810 | 2.5 |
Table 1: Mineral Resource Estimate for the Green Bay Copper-Gold Project as at 10 November 2025. The Mineral Resource is reported at a 1% copper cut-off. Gold-rich 1806 and 1807 VMS domains have been reported at a 1% CuEq cut-off. The same cut-off grade and metal equivalent parameters have been applied to the November 2025 MRE as the superseded October 2024 MRE to allow like-for-like comparisons. Refer to following sections of this announcement and Appendix B ‘JORC Table 1’ for further details on the MRE.
Both the Ming Deposit and Little Deer estimates have been prepared in accordance with the 2012 Edition of the Australasian Code for Reporting of Exploration Results, Mineral Resources and Ore Reserves and Canadian National Instrument 43-101 – Standards of Disclosure for Mineral Projects. The MRE was completed by external independent consulting groups.
The November 2025 MRE saw significant increases across key categories (Figures 1 and 2). The increase in the Mineral Resource has been driven primarily by the successful growth strategy implemented by FireFly since it acquired Green Bay in October 2023. Over 2,300m of underground development has been mined at Green Bay’s Ming Deposit to position the drill rigs to effectively test down-plunge extensions of the high-grade VMS mineralisation and broad footwall copper stringer zone.
Up to six underground rigs have been operating since the October 2024 MRE was completed and an additional 78,165m of drilling has been used to prepare this latest MRE (Figure 3).
The Company’s focus on upgrading areas of lesser drill spacing into higher confidence Mineral Resources is reflected by the 107% increase in the tonnes of M&I material. The M&I portion of the MRE increased from 24.4Mt in the October 2024 MRE to 50.4Mt in this MRE. Importantly, the M&I grade also increased despite the substantial increase in tonnes and now sits at 2.02% CuEq (+7%). M&I Mineral Resources now constitute 63% of the total MRE, which is significant because only the higher confidence M&I Mineral Resources can be used in future feasibility studies.
Overall, Inferred Mineral Resources decreased by 15%. This was primarily due to the successful conversion of 26Mt of Inferred material into the M&I category by infill drilling. The conversion was partially offset by the discovery of extensive down-plunge extensions of the Ming mineralisation up to 700m beyond the extent of the October 2024 MRE. The furthest step out hole into the mineralisation returned 49.0m @ 6.1% CuEq and remains open (see ASX announcement dated 16 October 2025). This intersection forms the limit of the November 2025 MRE.
The grade of copper and precious metals has significantly increased in the Inferred MRE due primarily to increasing grade at depth from the recent drilling. Drilling from the higher-grade core zone (see ASX announcement dated 27 October 2025) where the VMS and FWZ converge has been incorporated into this estimate in the Inferred category. Significant intersections from this zone include 86.3m @ 3.7% CuEq, 43.6m @ 7.6% CuEq and 44.5m @ 3.7% CuEq (see ASX announcement dated 27 October 2025). The Inferred MRE grade stands at 2.5% CuEq up from 2.0% CuEq in the October 2024 MRE. The grade of gold has almost doubled and now stands at 0.6g/t due to the addition of the higher-grade VMS material.
Furthermore, the addition of more VMS material in the latest MRE has seen contained gold in the MRE increase by 103% to now exceed 1.1Moz (546koz in M&I plus 563koz in Inferred). Silver has also increased significantly by 84% to total 9.8Moz (5.0Moz in M&I plus 4.8Moz in Inferred).
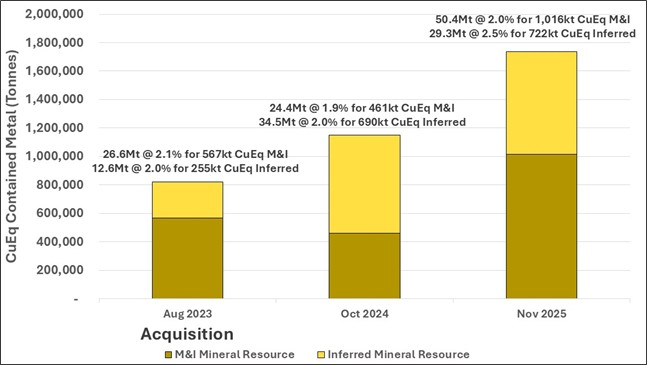
Figure 1: Year-on-Year increase in Mineral Resource contained copper equivalent metal since acquisition of the Green Bay Copper-Gold Project in 2023. Please refer to compliance statements for metal equivalent details.
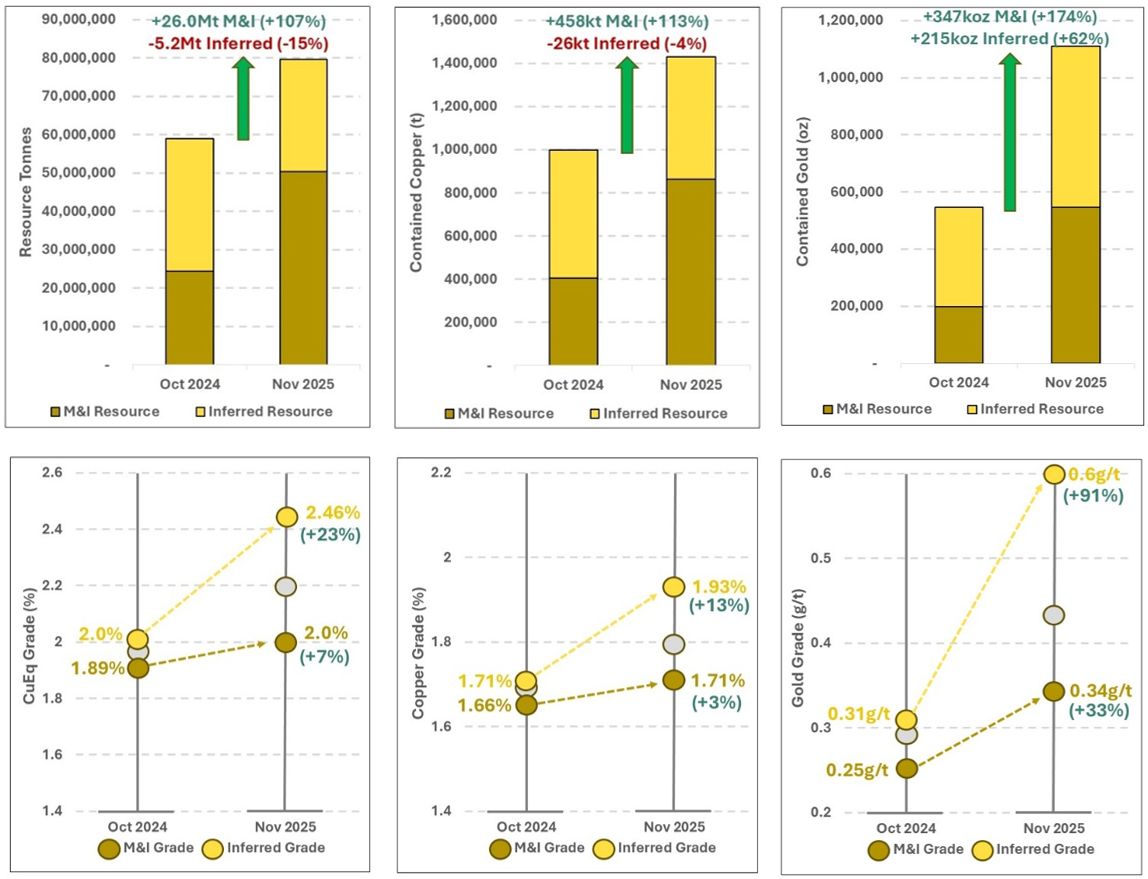
Figure 2: Year on Year changes between the October 2024 MRE and November 2025 MRE for Tonnes, Grade and Contained Metal. This latest estimate has seen significant year-on-year increases in tonnes, grades and metal content.
With latest gold metallurgical testwork indicating recoveries of 85% (see ASX announcement dated 5 August 2025), gold will provide substantial by-product revenue in any potential future mining operation.
This November 2025 MRE is reported using a 1% copper cut-off grade, the same as the previous October 2024 MRE. Sensitivity analysis demonstrates that the potential scale of the Project increases significantly as the cut-off grade is lowered (Table 2). At a 0.6% copper cut-off, the estimate increases to 79.1Mt @ 1.7% for 1.2Mt CuEq in M&I plus 38.7Mt @ 2.1% for 804kt CuEq in Inferred. Both bulk and selective mining options will be contemplated as part of future economic evaluations.
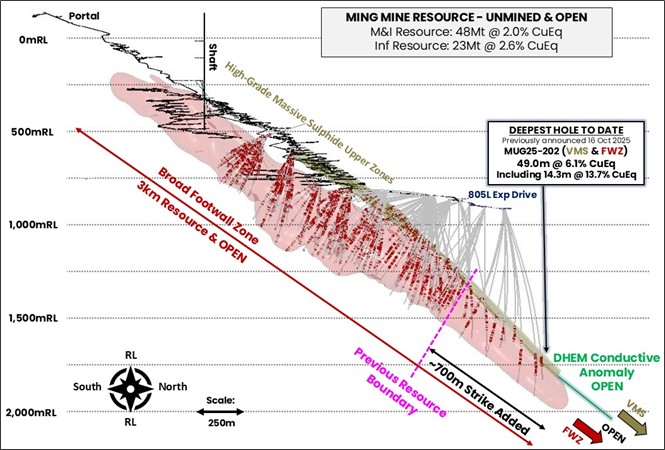
Figure 3: Long section of the Ming Deposit MRE extent and new drilling completed since the previous October 2024 MRE. The MRE remains open and geophysical DHEM conductors indicate the mineralisation likely continues down plunge. Red wireframe is the FWZ mineralisation envelope and gold wireframes are the upper high-grade copper-gold VMS zones. Red on drillholes are assays >0.5% copper.
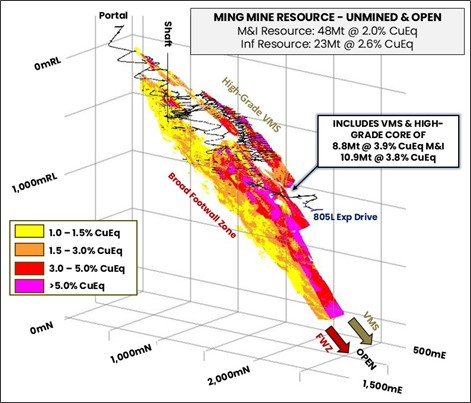
Figure 4: Isometric view of the Ming Mineral Resource Model. All blocks above 1% CuEq shown. The Mineral Resource consists of a very high-grade VMS zone and core of 8.8Mt @ 3.9% CuEq M&I and 10.9Mt @ 3.8% CuEq Inferred. This is underlain by the broad FWZ stringer mineralisation.
| GREEN BAY MEASURED & INDICATED MINERAL RESOURCE – COG SENSITIVITY | |||||||||
| CUT-OFF GRADE (Cu %) | TONNES (Mt) |
GRADE | METAL | CuEq | |||||
| Cu (%) |
Au (g/t) |
Ag (g/t) |
Cu (Kt) |
Au (koz) |
Ag (koz) |
Grade (%) | Metal (kt) | ||
| 0.6 | 72.0 | 1.4 | 0.3 | 2.5 | 1,034 | 627 | 5,833 | 1.68 | 1,209 |
| 0.8 | 61.3 | 1.6 | 0.3 | 2.8 | 961 | 591 | 5,483 | 1.84 | 1,126 |
| 1.0 | 50.4 | 1.7 | 0.3 | 3.1 | 863 | 546 | 5,024 | 2.02 | 1,016 |
| GREEN BAY INFERRED MINERAL RESOURCE – COG SENSITIVITY | |||||||||
| CUT-OFF GRADE (Cu %) | TONNES (Mt) |
GRADE | METAL | CuEq | |||||
| Cu (%) |
Au (g/t) |
Ag (g/t) |
Cu (Kt) |
Au (koz) |
Ag (koz) |
Grade (%) | Metal (kt) | ||
| 0.6 | 38.7 | 1.7 | 0.5 | 4.2 | 639 | 594 | 5,226 | 2.1 | 804 |
| 0.8 | 33.1 | 1.8 | 0.5 | 4.7 | 601 | 577 | 4,999 | 2.3 | 761 |
| 1.0 | 29.3 | 1.9 | 0.6 | 5.1 | 566 | 563 | 4,810 | 2.5 | 722 |
Table 2: November 2025 MRE sensitivity to the reporting cut-off grade by Mineral Resource categories. The November 2025 MRE was reported at a 1.0% copper cut-off grade (highlighted).
Forward Work Plans
Near-term drilling activities at the Green Bay Copper-Gold Project will continue to focus on three key areas: Upgrading the Mineral Resource (with infill drilling results), Mineral Resource Growth, and New Discoveries from both underground and surface. Six underground rigs will continue to advance the underground Mineral Resource growth for the foreseeable future and into 2026.
Green Bay – Ming Deposit Mineral Resource
The MRE update in this announcement is the result of the low-cost Mineral Resource growth strategy underpinned by drilling from the 805L exploration drive at the Ming Mine. Further mining of additional drill platforms is underway with the aim of delivering additional Mineral Resources in 2026.
Drilling from underground will prioritise conversion of the higher grade 29Mt of Inferred Mineral Resources into the higher confidence M&I category in preparation for the Feasibility Study expected to be completed in the second half of 2026 (Figure 5). In a Feasibility Study, only the higher confidence Measured and Indicated Mineral Resources can be used in developing the mine economics and therefore maximising M&I is critical to demonstrate the true scale and economic potential of the deposit.
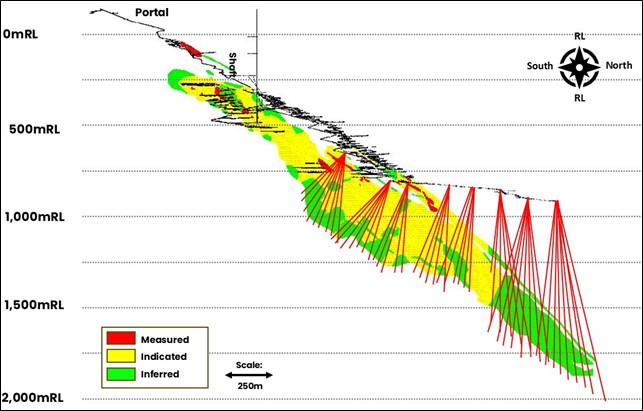
Figure 5: 2025-2026 drilling plan showing continued conversion of Inferred Mineral Resources (green) into the higher confidence Measured and Indicated Mineral Resources (yellow) ready for economic studies in 2026.
Green Bay (Ming Mine) Upscaled Project Development
Work on the development of the upscaled resumption of mining at the Ming Mine is well underway. The MRE in this announcement will underpin the first Preliminary Economic Assessment study planned for completion in the first half of 2026.
Detailed mine design, scheduling and economic analysis based on the updated MRE in this announcement by both external consultants and the FireFly engineering team will now commence.
Ausenco continue to complete detailed engineering design work on the potential future processing facility. Further metallurgical testwork is underway to assess options to further optimise recovery of by-product precious metals from the Ming Deposit. This work has the potential to add significantly to the economics of the future mine, with the latest MRE containing 1.1Moz of gold and 9.8Moz of silver.
Design work has commenced in conjunction with local company Shoreline Aggregates Inc. to jointly develop an additional berth suitable for the export of copper concentrate from the nearby Pine Cove port (only 5km away). This work will continue into the new year, and the costings will be included in the PEA.
Company representatives and Directors have met with numerous offtake groups, sovereign credit export agencies and other commercial entities to discuss potential future funding pathways as the Project rapidly progresses towards feasibility. The appetite for the concentrate from the Ming Mine appears strong with numerous confidentiality agreements being signed with these counterparties. The financing strategy will be ongoing as the various scenarios for an upscaled restart to operations are being evaluated. With the significant increase in this latest MRE, the Company wishes to avoid unnecessarily limiting the size of any future potential upscaled mining operation until it has completed further economic assessment.
Following the recent conditional release from further Environmental Assessment by the Province of Newfoundland and Labrador for a start-up mining and processing operation (see ASX announcement dated 5 August 2025), the Company continues to apply for permits to commence early works and construction. The Company intends to commence selective low-cost seasonal early works in the coming months to prepare the Project for future development and construction.
Green Bay (Ming Mine) Regional Discovery
Regional exploration is underway with two surface drill rigs testing high-priority targets across the Company’s 346km2 surface exploration claims.
One of the drill rigs will continue to test high-priority targets close to the Ming Mine. The second drill rig will systematically test early-stage greenfields targets generated by airborne VTEM and magnetic surveys completed in 2024 and 2025.
FireFly has continued to invest in regional-scale geophysics as a key exploration tool. The Company is completing a detailed VTEM survey over the 115km2 Tilt Cove Project. A detailed helicopter magnetic survey is also being completed over the central Green Bay leases.
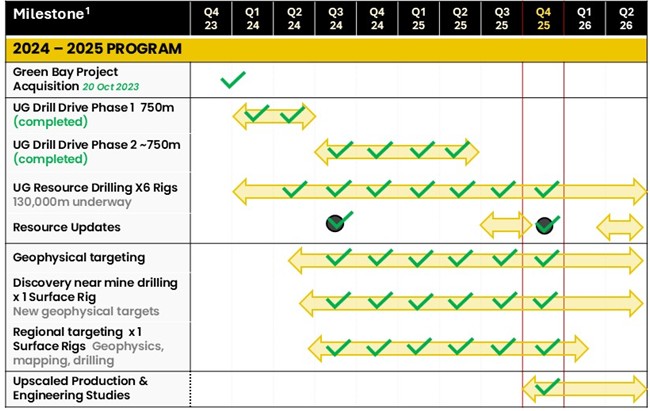
Figure 6: Key 2024-2025 milestones for the Green Bay Copper-Gold Project.
Funding and Corporate Activities
The Company remains well funded to complete its accelerated exploration growth strategy and economic studies as the Project further advances toward rapid low-cost development. Cash, receivables and liquid investments total A$129.7M at 30 September 2025 (see ASX announcement dated 30 October 2025).
| Steve Parsons Managing Director FireFly Metals Ltd +61 8 9220 9030 |
Jessie Liu-Ernsting Chief Development Officer FireFly Metals Ltd +1 709 800 1929 |
Media Paul Armstrong Read Corporate +61 8 9388 1474 |
About the Mineral Resource Estimate
Green Bay Copper-Gold Project location
The Company’s Green Bay Copper-Gold Project is located in the northern coastal region of central Newfoundland, Canada (Figure 7). FireFly holds ~346km2 of prime mineral claims in the heart of the prolific Baie Verte mineral district, which hosts numerous base metal volcanogenic massive sulphide and orogenic gold deposits.
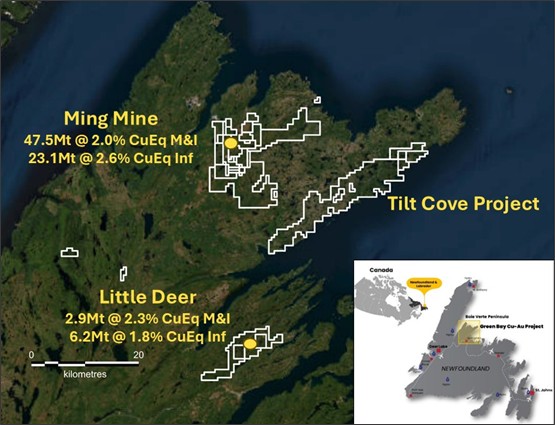
Figure 7: (Left) Location of the Green Bay copper-gold project in Newfoundland, Canada; (Right) FireFly’s mineral claims and simplified geology of the Baire Verte mineral district.
Green Bay Mineral Resource Estimate
The Green Bay Mineral Resource consists of the Ming Deposit and Little Deer. The Green Bay Mineral Resource Estimate by source is shown in Table 3.
The Ming and Little Deer Mineral Resource Estimates have been prepared in accordance with the JORC Code (2012 Edition) and Canadian National Instrument 43-101 by independent external consultants.
The growth in the global Mineral Resource Estimate has come exclusively from the Ming Deposit which has been the focus of drilling and underground development activities over the past year. No additional information was collected from the Little Deer deposit.
Ming Deposit Mineral Resource Estimate
| TONNES | COPPER | GOLD | SILVER | CuEq | ||||||
| (Mt) | Grade | Metal | Grade | Metal | Grade | Metal | Grade | |||
| (%) | (‘000 t) | (g/t) | (‘000 oz) | (g/t) | (‘000 oz) | (%) | ||||
| Measured | 6.3 | 1.5 | 94 | 0.3 | 50 | 1.9 | 388 | 1.7 | ||
| Indicated | 41.2 | 1.7 | 708 | 0.4 | 488 | 3.2 | 4,320 | 2.1 | ||
| TOTAL M&I | 47.5 | 1.7 | 802 | 0.4 | 537 | 3.1 | 4,708 | 2.0 | ||
| Inferred | 23.1 | 2.0 | 456 | 0.7 | 553 | 5.9 | 4,379 | 2.6 | ||
Little Deer Mineral Resource Estimate
| TONNES | COPPER | GOLD | SILVER | CuEq | ||||
| (Mt) | Grade | Metal | Grade | Metal | Grade | Metal | Grade | |
| (%) | (‘000 t) | (g/t) | (‘000 oz) | (g/t) | (‘000 oz) | (%) | ||
| Measured | – | – | – | – | – | – | – | – |
| Indicated | 2.9 | 2.1 | 62 | 0.1 | 9 | 3.4 | 320 | 2.3 |
| TOTAL M&I | 2.9 | 2.1 | 62 | 0.1 | 9 | 3.4 | 320 | 2.3 |
| Inferred | 6.2 | 1.8 | 110 | 0.1 | 10 | 2.2 | 430 | 1.8 |
TOTAL GREEN BAY MINERAL RESOURCE ESTIMATE
| TONNES | COPPER | GOLD | SILVER | CuEq | ||||
| (Mt) | Grade | Metal | Grade | Metal | Grade | Metal | Grade | |
| (%) | (‘000 t) | (g/t) | (‘000 oz) | (g/t) | (‘000 oz) | (%) | ||
| Measured | 6.3 | 1.5 | 94 | 0.3 | 50 | 1.9 | 388 | 1.7 |
| Indicated | 44.1 | 1.7 | 769 | 0.4 | 496 | 3.3 | 4,638 | 2.1 |
| TOTAL M&I | 50.4 | 1.7 | 863 | 0.3 | 546 | 3.1 | 5,026 | 2.0 |
| Inferred | 29.3 | 1.9 | 566 | 0.6 | 563 | 5.1 | 4,810 | 2.5 |
Table 3: November 2025 Mineral Resource Estimate for the Green Bay Copper-Gold Project
Variance to the previous Mineral Resource Estimate
The variance between the previous Mineral Resource Estimate (October 2024 MRE) and the current estimate (November 2025 MRE) is summarised in Table 4. Both estimates were reported at a 1% copper cut-off grade. Commodity prices used in the copper equivalent calculations were also the same to enable like-for-like comparison.
The November 2025 MRE shows a significant increase in overall tonnes and metal with grade increasing across all Mineral Resource categories. The Little Deer estimate has not changed because no additional data was added during 2023 and 2024.
| MEASURED & INDICATED | INFERRED | |||||
| Tonnes | Grade | Metal | Tonnes | Grade | Metal | |
| Copper | +26.0Mt (+107%) |
+0.09% (+3%) |
+458kt (+113%) |
-5.2Mt (-15%) |
+0.22% (+13%) |
-26kt (-4%) |
| Gold | +0.08g/t (+33%) |
+347koz (+174%) |
+0.28g/t (+91%) |
+215koz (+62%) |
||
| Silver | +0.61g/t (+24%) |
+3.1Moz (+157%) |
+2.05g/t (+67%) |
+1.4Moz (+42%) |
||
| CuEq | +0.13% (+7%) |
+555kt (+120%) |
+0.6% (+23%) |
+32kt (+5%) |
||
Table 4: Variance of tonnes, grade and contained metal between the October 2024 MRE and the November 2025 MRE. Note that both Mineral Resource Estimates were reported at a 1% copper cut-off grade, and the gold-rich 1806 and 1807 VMS domains were reported at a 1% CuEq cut-off. Copper equivalent calculations used the same commodity prices and recovery factors to enable like-for-like comparisons. Please refer to ASX announcement dated 29 October 2024 for details of the October 2024 MRE.
Key reasons for the change in the Mineral Resource Estimate at Ming include, but are not limited to:
Sensitivity Analysis of the MRE
The Green Bay Mineral Resource Estimate is sensitive to the lower cut-off grade applied. This will be considered in future mining studies, with unit costs heavily influenced by the selected mining method and eventual processing capacity.
The grade-tonnage sensitivity analysis is presented in Figure 8. Contained metal content sensitivity to cut-off grade for CuEq, copper and gold are shown in Figures 9, 10 and 11.
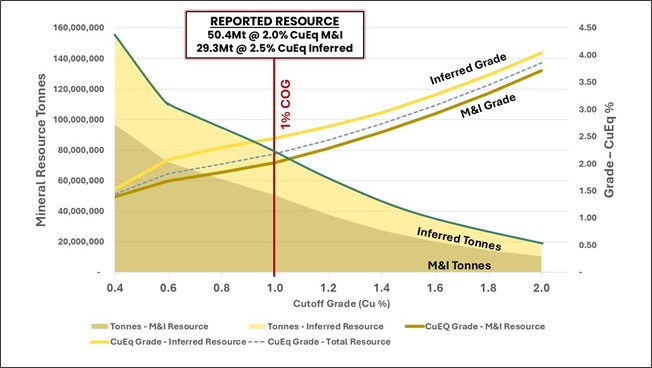
Figure 8: Green Bay Mineral Resource Grade-Tonnage sensitivity analysis by Mineral Resource category at various copper cut-off grades. Please refer to compliance statement in this announcement for parameters used to calculate the copper equivalent grade.
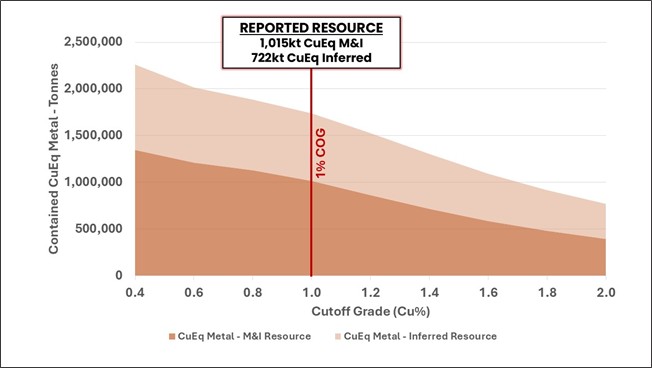
Figure 9: Green Bay Mineral Resource Estimate contained Copper equivalent metal sensitivity to the cut-off grade by Mineral Resource category.
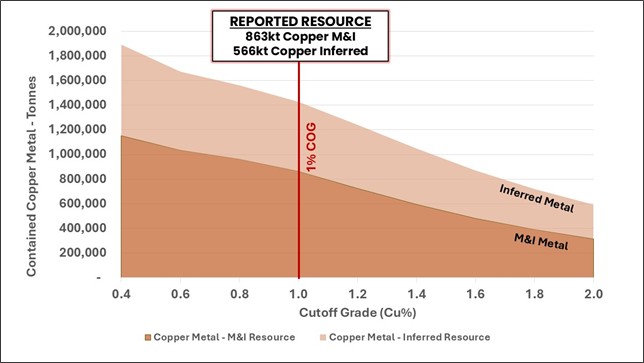
Figure 10: Green Bay Mineral Resource contained copper sensitivity to the cut-off grade by Mineral Resource category.
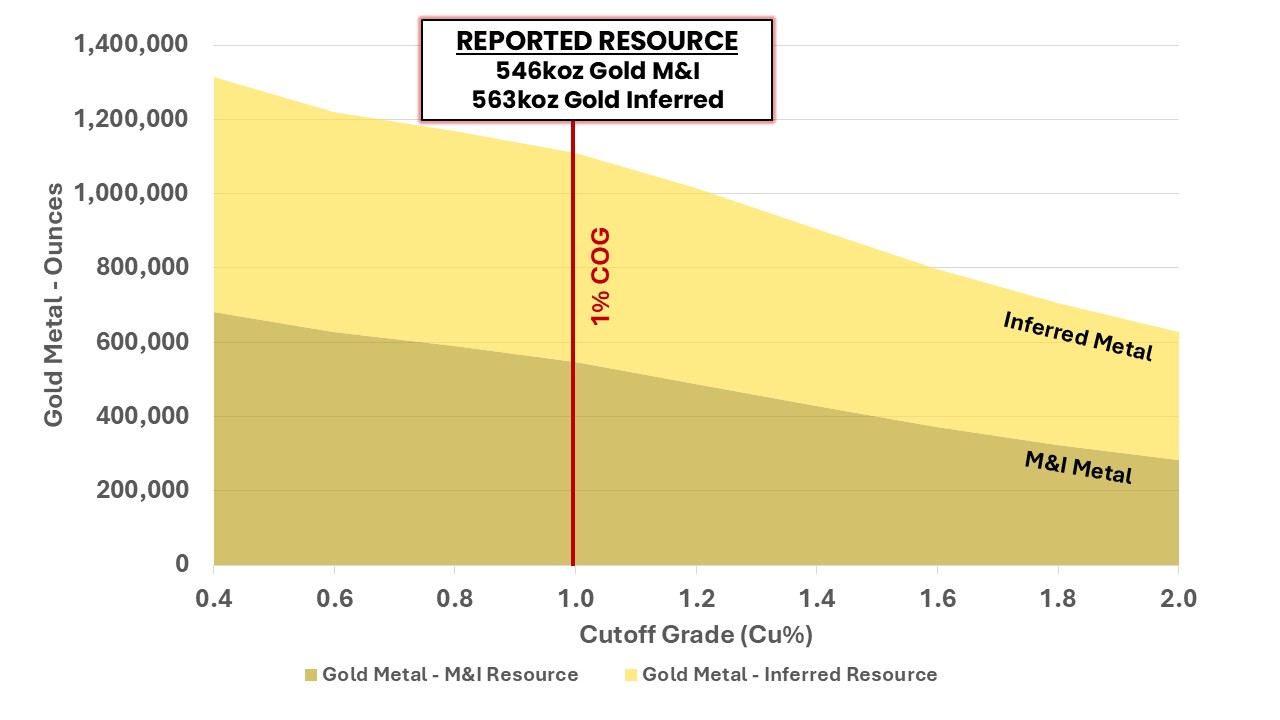
Figure 11: Green Bay Mineral Resource contained gold sensitivity to cut-off grade by Mineral Resource category.
Ming Deposit Mineral Resource Estimate
The Ming Deposit November 2025 MRE (Table 5) was prepared in accordance with the JORC Code (2012 Edition) and Canadian National Instrument 43-101 by independent consultants, Cube Consulting Pty Ltd.
| TONNES | COPPER | GOLD | SILVER | CuEq | ||||
| (Mt) | Grade | Metal | Grade | Metal | Grade | Metal | Grade | |
| (%) | (‘000 t) | (g/t) | (‘000 oz) | (g/t) | (‘000 oz) | (%) | ||
| Measured | 6.3 | 1.5 | 94 | 0.3 | 50 | 1.9 | 388 | 1.7 |
| Indicated | 41.2 | 1.7 | 708 | 0.4 | 488 | 3.2 | 4,320 | 2.1 |
| TOTAL M&I | 47.5 | 1.7 | 802 | 0.4 | 537 | 3.1 | 4,708 | 2.0 |
| Inferred | 23.1 | 2.0 | 456 | 0.7 | 553 | 5.9 | 4,379 | 2.6 |
Table 5: November 2025 Mineral Resource Estimate for the Ming Deposit
Additional data informing the updated Ming Deposit Mineral Resource Estimate
Drilling at the Ming underground copper-gold mine recommenced following the acquisition of the Green Bay Copper-Gold Project by FireFly in October 2023. The November 2025 MRE contains 242 new holes that contain an additional 78,165m of new data (Figure 12).
All results drilled by FireFly and used in the MRE have been previously reported in the Company’s ASX announcements.
Most of the drilling was completed from the exploration drill drive mined by FireFly, with over 2,300m of underground development completed by the owner-operator mining team since November 2023. Drill platforms were specifically designed to position drill rigs at favourable orientations sub-perpendicular to mineralisation.
Mine Geology and Geological Interpretation
The Ming Deposit is classified geologically as a volcanogenic massive sulphide mineralised system. The Ming mineralisation is typically located at the regional contact between Cambrian-Ordovician aged felsic volcanics (rhyolite) and mafic volcanics.
Hydrothermal fluids migrated towards the surface via deep-tapping growth faults, driven by the heat generated from the tectonic collision and subduction of ancestral North America (Laurentia) beneath proto-Europe (Gondwana). The conceptual deposit model proposed by Pilote et al. (2016) is presented in Figure 13.
Mineralisation is locally intersected by post-mineral mafic gabbro dykes which can contain structurally controlled quartz-carbonate veins with remobilised sulphides.
Figure 14 shows a schematic cross-section of the Ming Deposit.
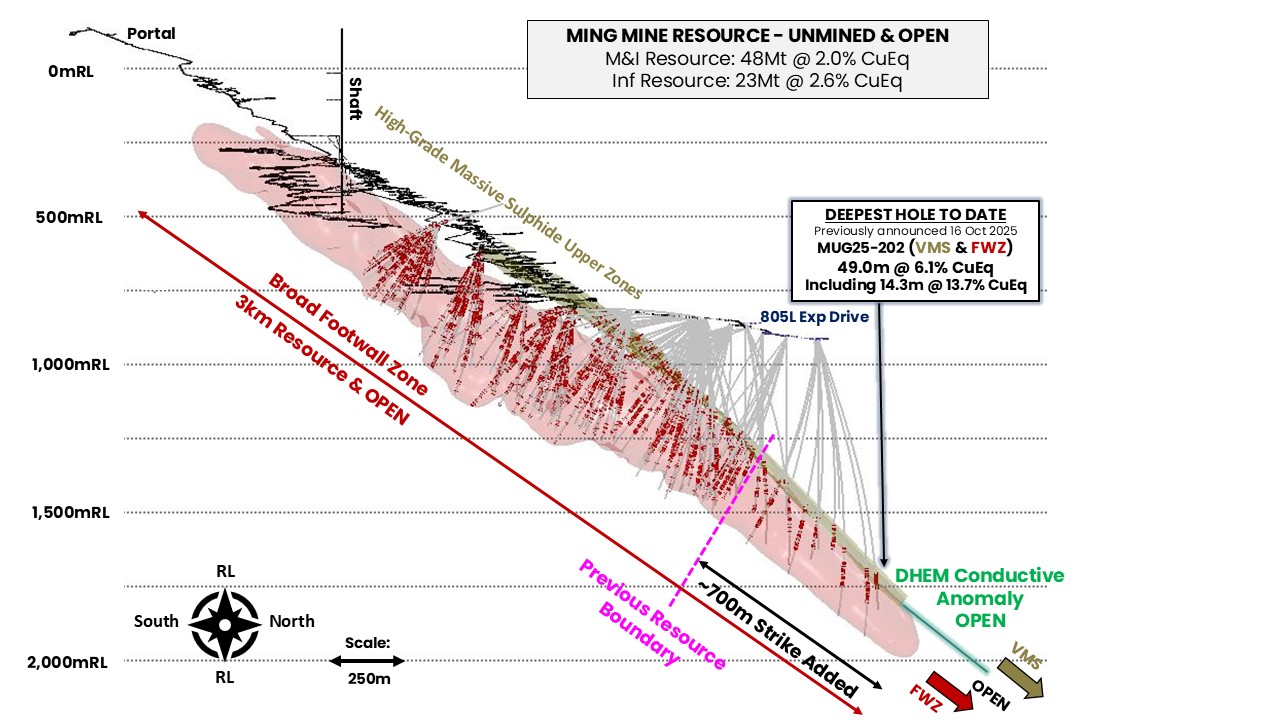
Figure 12: Long section of the Ming Deposit MRE extent and new drilling completed since the previous October 2024 MRE. The MRE remains open and geophysical DHEM conductors indicate the mineralisation likely continues down plunge. Red wireframe is the FWZ mineralisation envelope and gold wireframes are the upper high-grade copper-gold VMS zones. Red on drillholes are assays >0.5% copper.
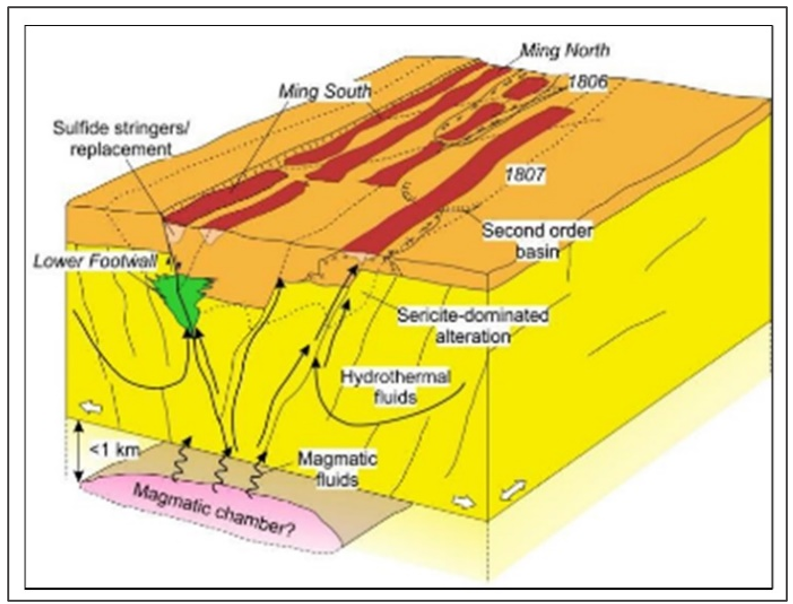
Figure 13: Ming mineralisation model proposed by Pilote et al (2016).
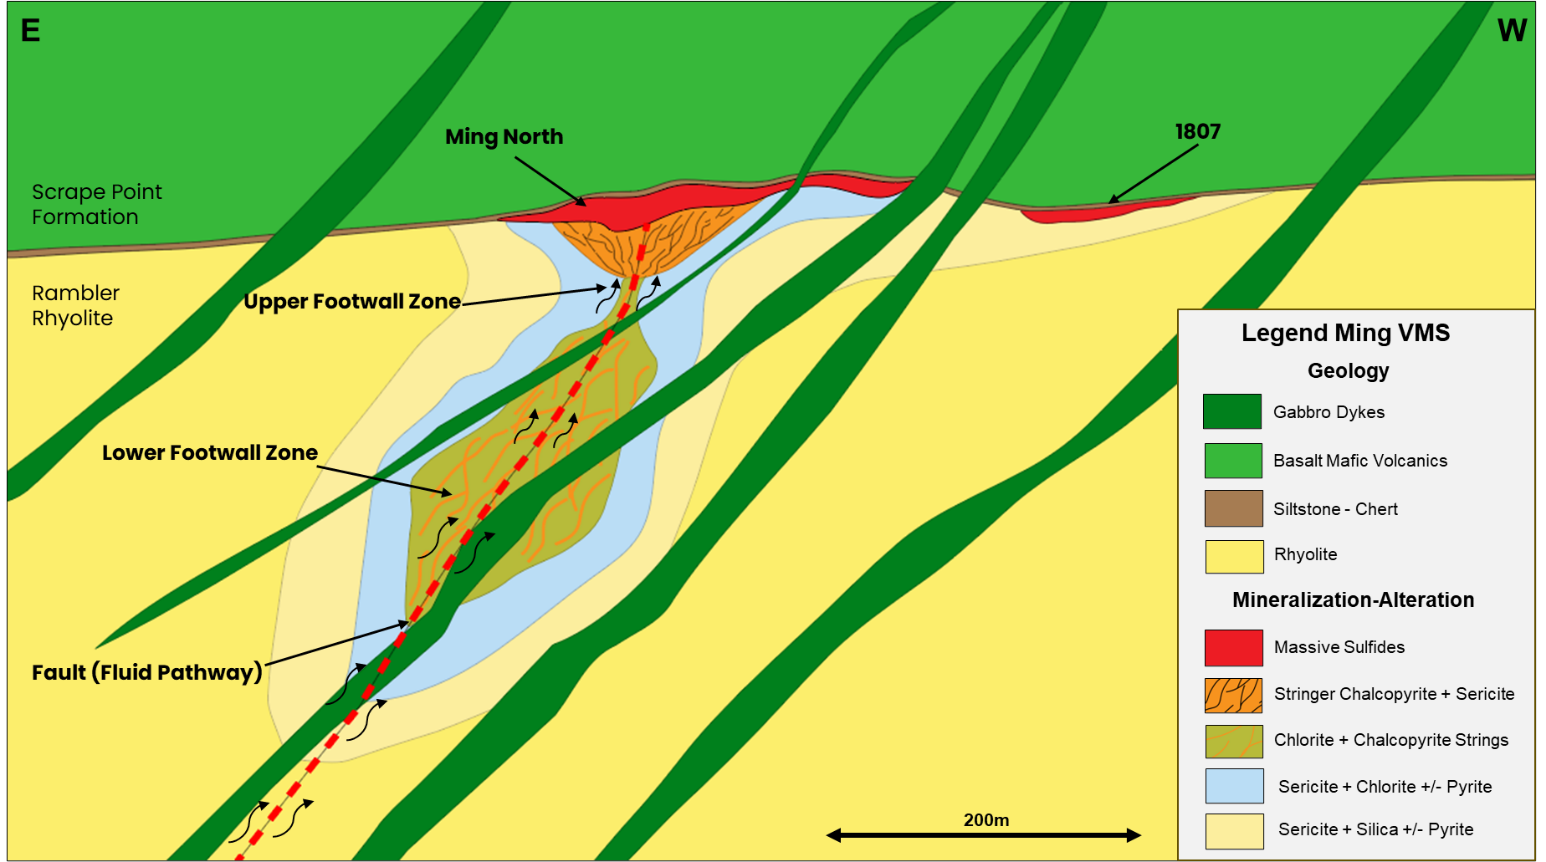
Figure 14: Conceptual cross section of the Ming Deposit showing the upper high-grade copper and gold rich VMS mineralised lenses and the sub-seafloor higher-temperature footwall zone stringer style mineralisation.
There are two distinct styles of mineralisation at the Ming Deposit:
Recent drilling has shown that both styles of mineralisation converge in the lower extents of the Ming Deposit. The VMS and FWZ mineralisation forms a thick continuous pipe-like shoot that contains extensive grade over a known strike of 800m to date. The furthest hole into the deposit intersected the core zone and graded 49.0m @ 6.1% CuEq (Figures 17,18).
A cross section through the block model is presented in Figure 19.
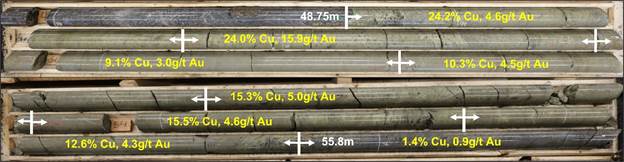
Figure 15: Massive sulphide copper-gold rich mineralisation intersected in FireFly resource extension drilling (MUG24-030). The core photograph shown (48.75m to 55.8m) is part of a broader reported intersection of 13.1m @ 14.3% CuEq (10.7% Cu & 4.1g/t Au) true thickness. The mineralisation is predominantly pyrite and chalcopyrite with lesser local sphalerite. Refer to FireFly’s ASX announcement dated 19 June 2024.
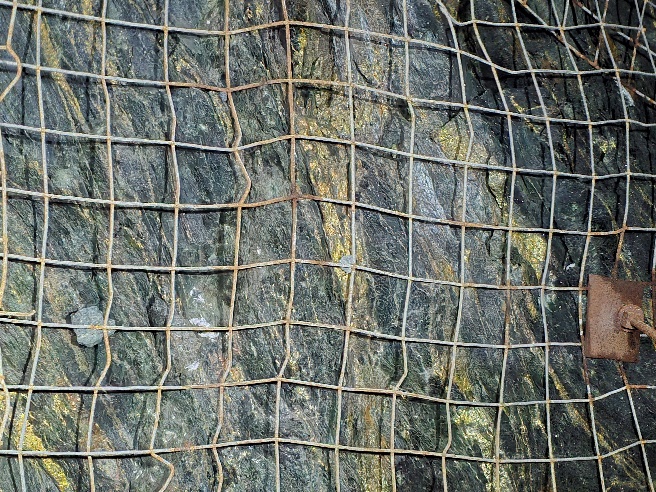
Figure 16: Stringer-style FWZ mineralisation from the 735 Level in the Ming Mine (photograph taken in September 2024). The mineralisation consists of individual mm to cm scale chalcopyrite-pyrite veins hosted within highly chloritised rhyolite. This mineralisation is amenable to large-scale mining and often bulks out to grades exceeding 2% copper.
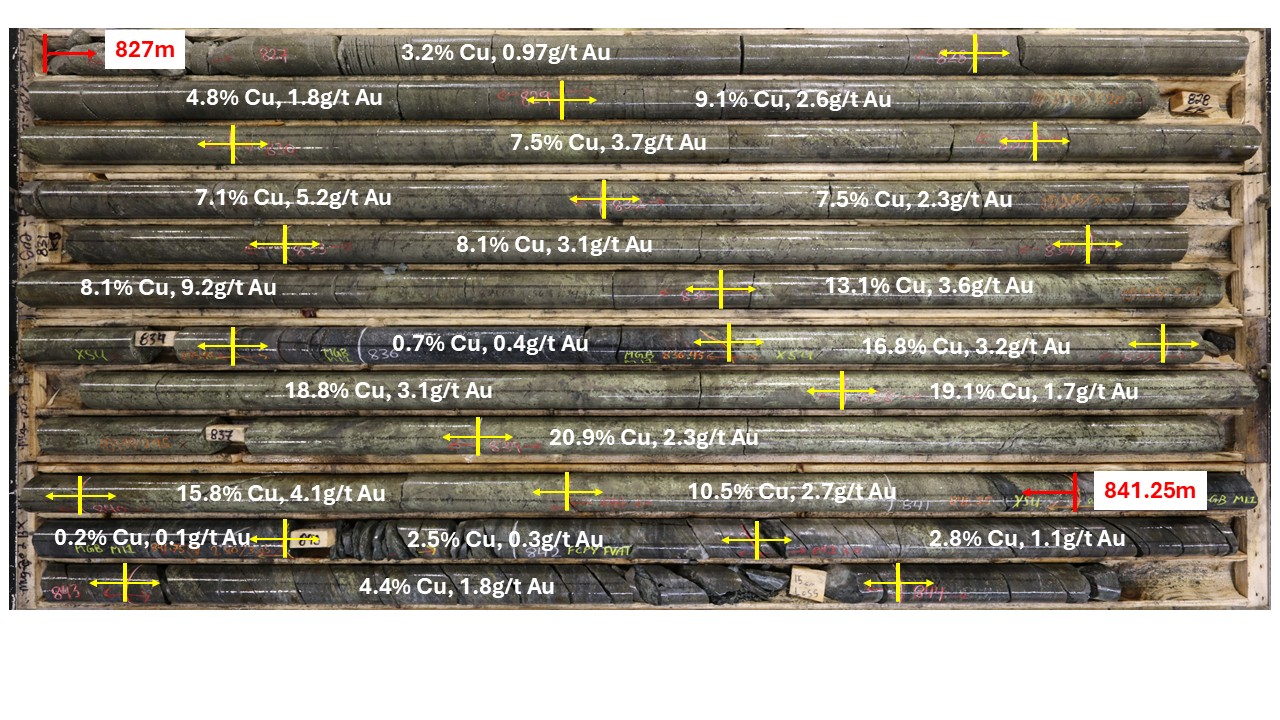
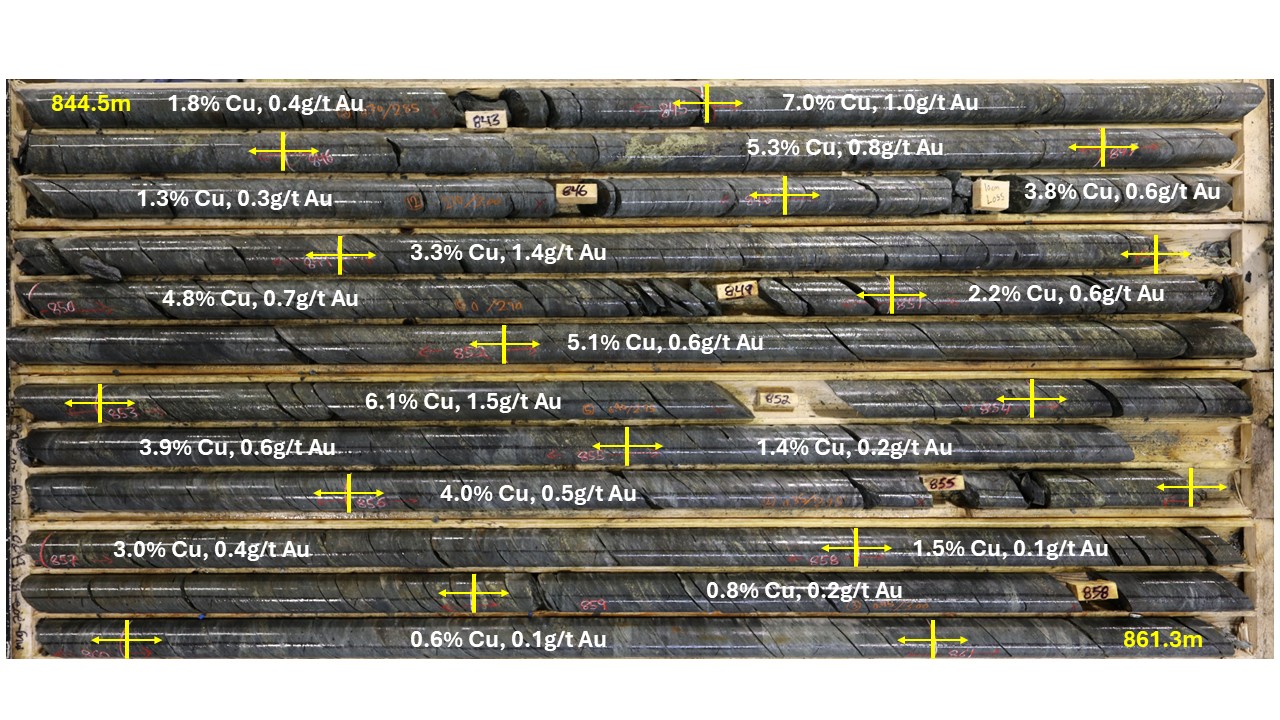
Figure 17: Core photographs for MUG25-202 showing the new very high grade core zone. This convergent zone consists of the upper VMS zone (827m-841.25m) that grades 14.3m @ 13.7% CuEq and the adjacent broad FWZ stringer-style mineralisation. This is part of the broader step-out intersection of 49.0m @ 6.1% CuEq that is the deepest hole drilled into the Ming Deposit to date.
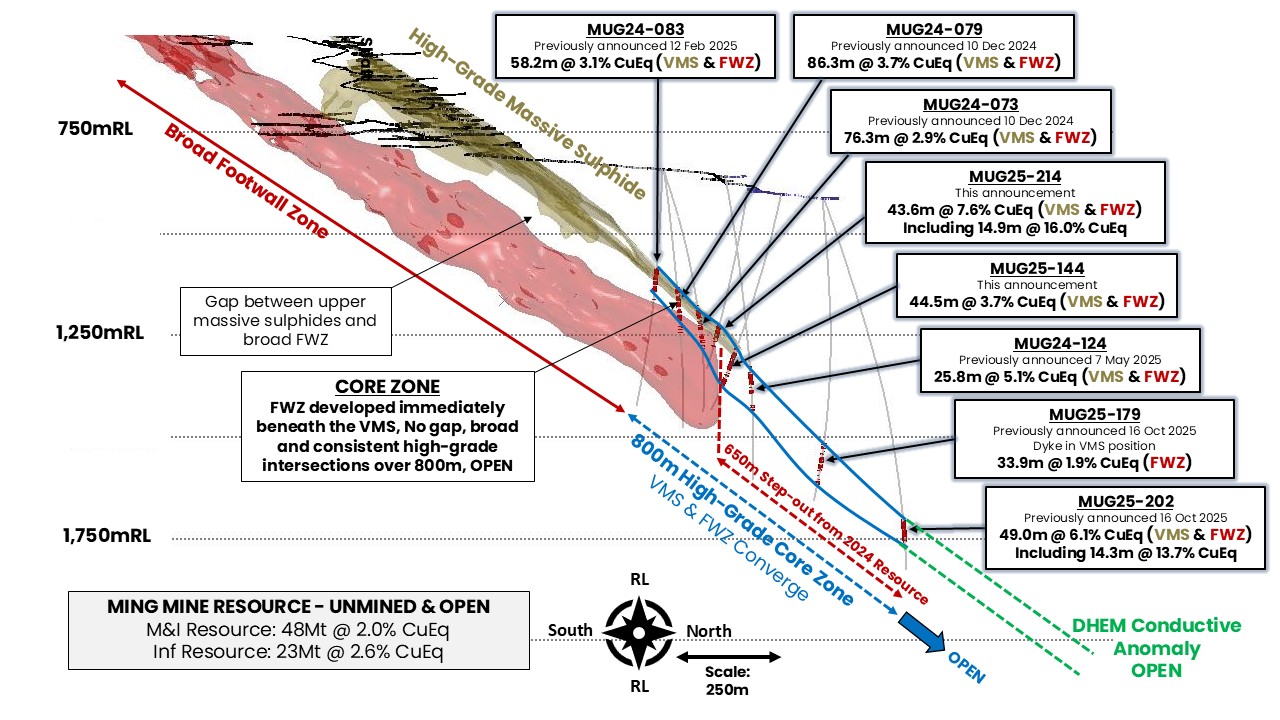
Figure 18: Long section through the Ming Mine highlighting the current ~800m strike of the extremely high-grade core zone, which remains open. The FWZ stringer style mineralisation is developed directly beneath the upper high-grade VMS. Clipping +/- 30m.
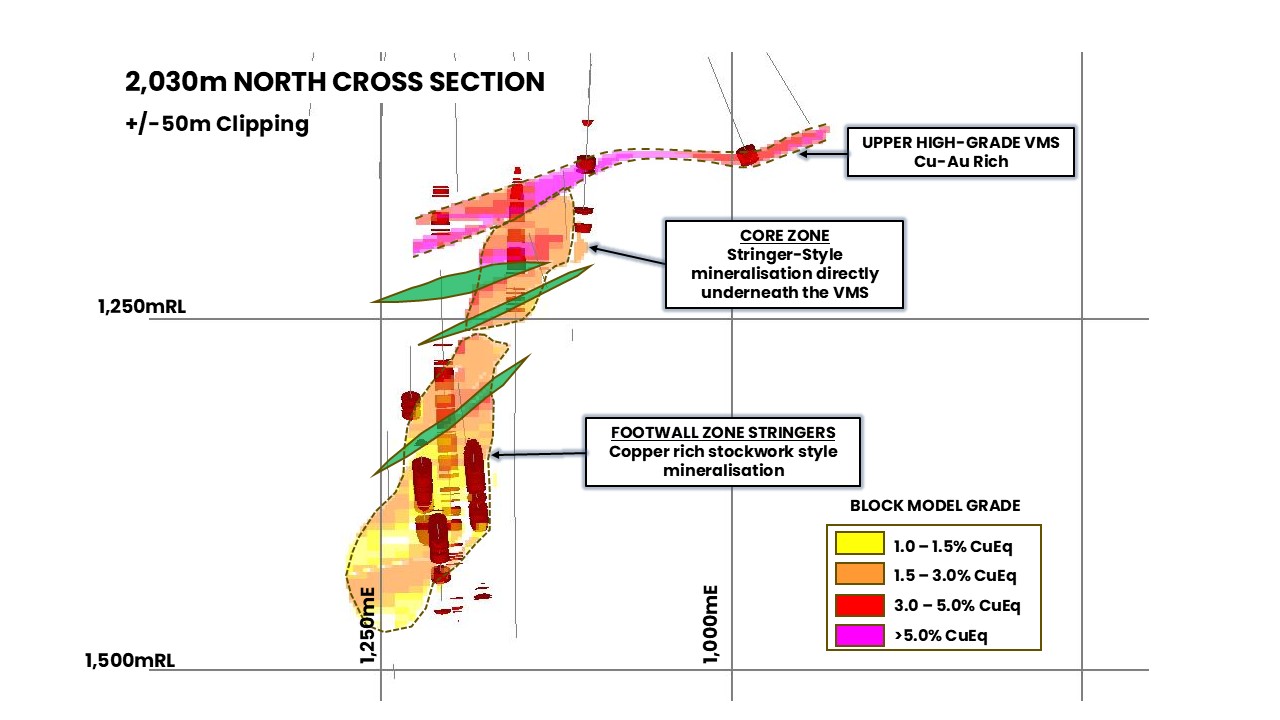
Figure 19: Cross section through the Ming block model showing key geological and mineralisation domains. Red drillholes are grades >0.5% copper. Interpreted post-mineral mafic dykes are shown in green. Clipping +/-50m.
Ming Drilling and Sampling Techniques
The Ming Deposit has been sampled exclusively by diamond drilling. A total of 1,334 holes for a total drilled meterage of 319,534m was used to estimate the November 2025 MRE.
Historic drill core was predominantly NQ (47.8mm diameter) with some BQ sized core (36mm diameter). All 37,110m of diamond drilling completed by FireFly was NQ2 (50.6mm diameter) and oriented using the Reflex Act III core orientation tool.
Core was sampled to a maximum length of 1m. The minimum sample length was 0.3m to accommodate geological boundaries or changes in mineralisation. All FireFly core was cut in half, with the non-assayed portion stored for future reference if required.
For further detail regarding drilling and sampling, please refer to Appendix B ‘Table 1 – Section 1 (Ming Mine)’.
Analytical Techniques
All assays completed by FireFly were undertaken at Eastern Analytical Ltd. in Springdale, Newfoundland. The laboratory is ISO 17025 accredited and utilises industry-standard preparation and analytical methodologies.
Sample preparation consisted of drying at 60o followed by crushing to ~80% passing -10 mesh. A riffle splitter was used to collect a representative 250g to 300g subsample. A ring mill was then used to pulverise the sample split to 95% passing -150 mesh.
Initial analysis for 34 elements was determined by Inductively Coupled Plasma. A 200mg subsample is totally digested in four acids and analysed by ICP-OES.
Where the upper detection limits were reached for select ore grade elements (Cu, Ag, Zn, Pb and Fe), the samples were then dissolved in a three-acid digest and analysed by atomic adsorption. Gold content was determined by fire assay with AA finish.
All samples submitted by FireFly were subjected to rigorous internal and external QA/QC protocols. These include the routine inclusion of certified reference materials (standards), blank samples and duplicate samples. Sample pulps were also analysed at another independent laboratory to confirm validity.
For further detail regarding analytical techniques, please refer to Appendix B ‘Table 1 – Section 1 (Ming Mine)’.
Ming Deposit Mineral Resource Estimation Methodology
Mineralisation Domains
Leapfrog software was used for lithology and mineralisation domain wireframing.
Twenty-two mineralisation domains are defined in the current model:
These domains were based on mineralisation style and statistical analysis.
The overall stockwork zone is defined based on logged alteration and sulphide content. Within this geological envelope, the high-grade LFZ was refined using a 0.6% Cu lower cut-off, allowing consistent zones of internal waste in the high-grade core to be reclassified.
Data Treatment
The Mineral Resource estimation utilises 2m composites for all DD sampling data, composite residuals smaller than 0.3m have been removed from the estimation.
Detailed exploratory data analysis, variography, and model validation was carried out using Isatis and other software.
Treatment of extreme high grades were dealt with by using a cap grade strategy.
Industry-standard 3D geological modelling software was used for data compilation, calculating and coding composite values, estimating and reporting.
Estimation
All lodes are estimated using ordinary kriging with the same domains used to estimate Cu, Au, Ag, S and Zn. OK estimation was completed using an oriented search ellipsoid. A three-pass search strategy was employed for each estimated variable, with search directions aligned to the major, semi-major, and minor axes of the variogram.
During the first pass, search radius approximating between 70 to 100% of the variogram ranges were utilised, with a requirement of a minimum of 8 and a maximum of 12 composites. A maximum of 5 composites per drillhole was allowed for all domains with the exception of certain VMS lodes where a maximum of 3 composites were chosen to allow better definition of vertical grade zonation. For the second pass, the search radius was expanded to double the first pass. To ensure full estimation of all domains, a third pass search distance was increased to extents of the data and the minimum sample requirement reduced to 4 or 6 composites.
The parent block size of 10m(X) x 10m(Y) x 5m(Z) represents 30 to 50% of the average drill spacing in the zone classified as Indicated. Parent blocks have been sub-celled to 2.5m x 2.5m x 2.5m.
For further detail regarding the estimation methodology, please refer to Appendix B ‘Table 1 – Section 1 (Ming Mine)’.
Ming Deposit Mineral Resource Classification
Mineral Resources have been classified on the basis of confidence in the geological and grade continuity using the drilling density, and the distance to sample selections. These were evaluated individually for each mineralisation domain.
Measured Mineral Resources have been defined generally where the closest drillhole sample is within 15m and the average distance to samples used for estimation within 20m.
Indicated Mineral Resources where the closest drillhole sample is within 30m and the average distance to samples used for estimation within 40m.
Inferred Mineral Resources where the closest drillhole sample is within 90m or greater if there is enough geological and grade continuity. Material outside these criteria are constrained by boundary strings and do not form part of the Mineral Resource. Distance to historical workings has been used to downgrade the Mineral Resource category where required.
A Mineral Resource category smoothing has been applied to ensure category continuity and to remove isolated blocks or small zones and avoid mosaic-like patterns in the Mineral Resource classification.
This classification is considered appropriate given the confidence that can be gained from the existing data density and results from drilling.
A long section of the November 2025 MRE model showing Mineral Resource Categories is presented in Figure 20.
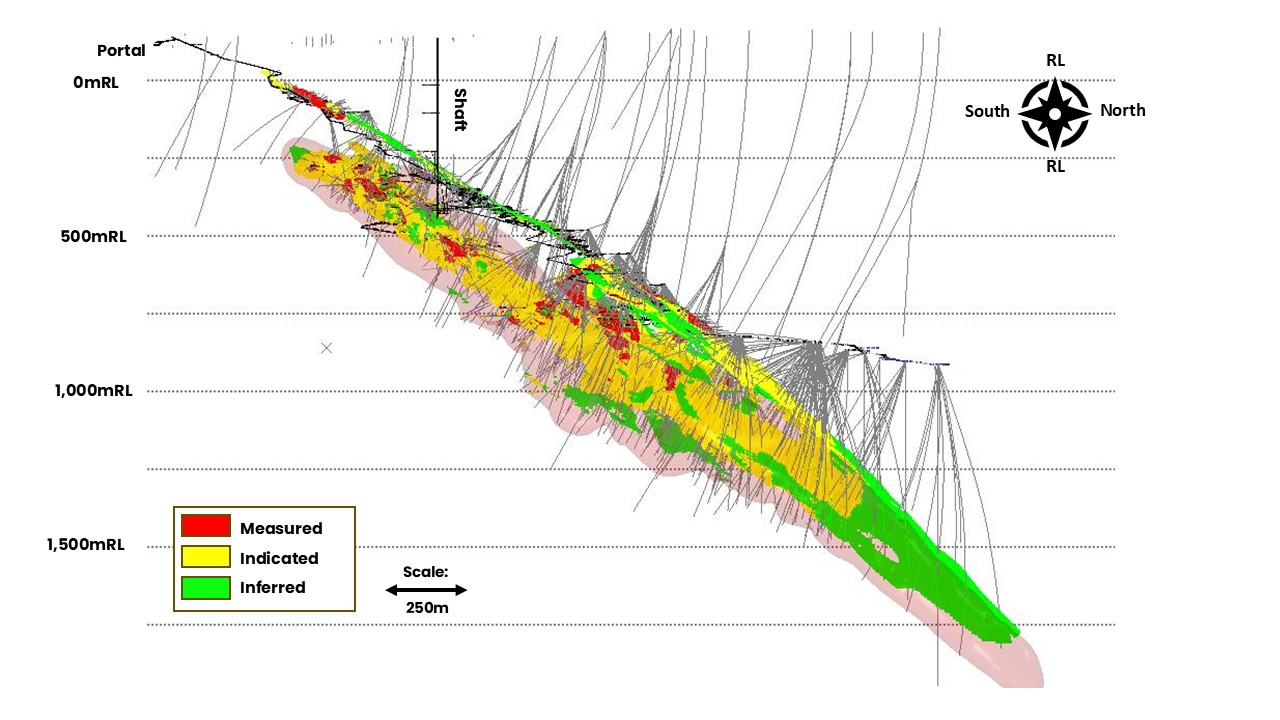
Figure 20: Long section showing the Mineral Resource Categories for the November 2025 MRE with all drillholes shown. This includes both historical drilling and all holes completed by FireFly since acquisition of the Project in October 2023.
Ming Cut-off Grade
The cut-off grade of 1% Cu has been calculated based on the likely input components of mining, processing, recovery and administration costs. Commodity prices used are well below current spot prices however have been maintained the same as the October 2024 MRE parameters to ensure like-for-like comparisons.
The gold-rich 1806 and 1807 VMS domains have been reported at a 1% CuEq cut-off.
Modifying Mining and Metallurgical Factors
The mineral resource is reported in-situ, however conservative economic factors and cut-off grades were applied. The cut-off grade used was 1% copper. Mining costs assumed in the cut-off grade calculation assume a combination of transverse and longitudinal long hole open stoping with paste backfill. Processing costs were guided by benchmarked operations that utilise floatation to produce a copper-gold concentrate for external extraction.
Recovery assumptions are based on the previous operations at Ming. Economic evaluation studies are in progress to further increase confidence in the cut-off grade and refine modifying factors applied.
In the opinion of the Company, all elements included in the metal equivalent calculation have a reasonable potential to be recovered and sold based on current market conditions, metallurgical test work, and the Company’s operational experience.
Little Deer Mineral Resource Estimate
The Little Deer Mineral Resource Estimate as of November 2025 is presented in Table 6. This estimate has been prepared in accordance with the JORC Code (2012 Edition) and Canadian National Instrument 43-101. The estimate was prepared by independent consulting group P&E Mining Consultants Inc. in conjunction with FireFly employees.
No additional drilling has been completed at Little Deer and the MRE remains unchanged from the previous estimate. For further details on the Little Deer Mineral Resource Estimate, please refer to the ASX announcement dated 29 October 2024 titled ‘Resource Increases 42% to 1.2Mt of contained metal at 2% Copper Eq.’
| TONNES | COPPER | GOLD | SILVER | CuEq | ||||
| (Mt) | Grade | Metal | Grade | Metal | Grade | Metal | Grade | |
| (%) | (‘000 t) | (g/t) | (‘000 oz) | (g/t) | (‘000 oz) | (%) | ||
| Measured | – | – | – | – | – | – | – | – |
| Indicated | 2.9 | 2.1 | 62 | 0.1 | 9 | 3.4 | 320 | 2.3 |
| TOTAL M&I | 2.9 | 2.1 | 62 | 0.1 | 9 | 3.4 | 320 | 2.3 |
| Inferred | 6.2 | 1.8 | 110 | 0.1 | 10 | 2.2 | 430 | 1.8 |
Table 6: Little Deer Mineral Resource Estimate as at November 2025. Note that this MRE remains unchanged from the previous MRE.
ABOUT FIREFLY METALS
FireFly Metals Ltd (ASX: FFM) (TSX: FFM) is an emerging copper-gold company focused on advancing the high-grade Green Bay Copper-Gold Project in Newfoundland, Canada. The Green Bay Copper-Gold Project currently hosts a Mineral Resource prepared and disclosed in accordance with the 2012 Edition of the Australasian Code for Reporting of Exploration Results, Mineral Resources and Ore Reserves and Canadian National Instrument 43-101 – Standards of Disclosure for Mineral Projects of 50.4Mt of Measured and Indicated Mineral Resources at 2.0% for 1,016Kt CuEq and 29.3Mt of Inferred Mineral Resources at 2.5% for 722Kt CuEq. The Company has a clear strategy to rapidly grow the copper-gold Mineral Resource to demonstrate a globally significant copper-gold asset. FireFly has completed a 130,000m diamond drilling program.
FireFly holds a 70% interest in the high-grade Pickle Crow Gold Project in Ontario. The current Inferred Mineral Resource stands at 11.9Mt at 7.2g/t for 2.8Moz gold, with exceptional discovery potential on the 500km2 tenement holding.
The Company also holds a 90% interest in the Limestone Well Vanadium-Titanium Project in Western Australia.
For further information regarding FireFly Metals Ltd please visit the ASX platform (ASX:FFM) or the Company’s website www.fireflymetals.com.au or SEDAR+ at www.sedarplus.ca.
Cygnus Metals Limited (ASX: CY5) (TSX-V: CYG) (OTCQB: CYGGF) is pleased to announce final in... READ MORE
Scorpio Gold Corp. (TSX-V: SGN) (OTCQB: SRCRF) (FSE: RY9) ... READ MORE
Cassiar Gold Corp. (TSX-V: GLDC) (OTCQX: CGLCF) is pleased to announce that, further to its news rel... READ MORE
Midland Exploration Inc. (TSX-V: MD) is pleased to announce that it has completed a second and fina... READ MORE
Wallbridge Mining Company Limited (TSX: WM) (OTCQB:WLBMF) is pleased to announce that it has closed... READ MORE


