


Fortuna Mining Corp. (NYSE: FSM) (TSX: FVI) is pleased to report the results of the Preliminary Economic Assessment prepared for the Diamba Sud Gold Project in Senegal.
The PEA supports robust project economics for the development of an open-pit mine and conventional carbon-in-leach processing plant. At a gold price of $2,750 per ounce, the assessment unveils an after-tax NPV5% of $563 million, an IRR of 72 percent, and a payback period of ten months. During the first three years of production, Diamba Sud is projected to deliver an average of 147,000 ounces of gold per year at an All-In Sustaining Cost1 (AISC) of $904 per ounce.
Construction capital cost is estimated at approximately $283.2 million. Project funding is derisked by the strength of Fortuna’s balance sheet and robust cash flow generation. As of the end of the second quarter of 2025, Fortuna reported liquidity of $537.3 million and a net cash position of $214.8 million.
Jorge A. Ganoza, President and CEO at Fortuna, commented, “The PEA highlights the strong value Diamba Sud brings to Fortuna’s portfolio, using a long-term gold price of $2,750 per ounce. With permitting and the Definitive Feasibility Study underway, we expect to make a construction decision in the first half of 2026.” Mr. Ganoza continued, “Ongoing exploration is advancing with five drill rigs focused on expanding open areas of mineralization and to upgrade the small portion of Inferred Mineral Resources to the Measured and Indicated categories by year-end. With continued exploration success, we expect to enhance Diamba Sud’s life of mine production profile beyond a decade.” Mr. Ganoza concluded, “Additionally, we have approved a $17 million budget to advance early construction works, including the expansion of camp and ancillary facilities, as well as detailed engineering activities.”
Note:
PEA Key Highlights
Table 1 summarizes the key assumptions, operational parameters, economic results, and AISC values from the PEA.
Table 1: PEA key highlights
| Metrics | Units | Results | ||
| Gold price | $/oz | 2,750 | ||
| Life of mine | year | 8.1 | ||
| Total mineralized material mined1 | Mt | 17.75 | ||
| Contained gold in mined resource1 | koz | 932 | ||
| Strip ratio | w:o | 5.5:1 | ||
| Throughput initial 3 years (oxide) | Mtpa | 2.5 | ||
| Throughput @ nameplate (fresh) | Mtpa | 2.0 | ||
| Head grade | g/t Au | 1.63 | ||
| Recoveries | % | 90% | ||
| Gold production | ||||
| Total Production over LOM | koz | 840 | ||
| Average annual production, LOM | koz | 106 | ||
| Average annual production, first 3 years | koz | 147 | ||
| Per unit costs over LOM | ||||
| Total mining costs | $/t, mined | $4.82 | ||
| Processing | $/t, processed | $13.91 | ||
| G&A | $/t, processed | $6.70 | ||
| Cash costs1 | ||||
| Average operating cash costs2, LOM | $/oz | $1,081 | ||
| Average operating cash costs2, first 3 years | $/oz | $759 | ||
| AISC1 | ||||
| Average AISC2, LOM | $/oz | $1,238 | ||
| Average AISC2, first 3 years | $/oz | $904 | ||
| Capital costs | ||||
| Initial capital expenditure | $ M | $283 | ||
| Sustaining capital, operations + Infrastructure (includes closure costs) | $ M | $48 | ||
| NPV5%, pre-tax (100% project basis) | $M | $772 | ||
| Pre-tax IRR | % | 86% | ||
| NPV5%, after-tax (100% project basis) | $M | $563 | ||
| After-tax IRR | % | 72% | ||
| Payback period | year | 0.8 | ||
| Annual EBITDA 2 | ||||
| Average EBITDA2 over LOM | $ M | $167 | ||
| Average EBITDA2 over first 3 years | $ M | $277 | ||
Notes:
Exploration Upside: Resource Delineation and Exploration Drilling
Opportunities exist to further strengthen and enhance Diamba Sud’s economic foundation through continued drilling, resource extension testing, and definition of new targets. Successful exploration programs are expected to extend the Life of Mine (LOM) gold production profile to beyond a decade.
Exploration drilling completed since the data cut-off for the Mineral Resource estimate in the PEA comprises 125 drill holes totaling 15,794 meters. Results from this recent drilling include drill hole DSDD488 that intersected 22.7 g/t Au over an estimated true width of 21.6 meters, highlighting substantial exploration upside (refer to Fortuna news release dated August 13, 2025: “Fortuna drills 22.7 g/t gold over 21.6 meters at Southern Arc, Diamba Sud Gold Project, Senegal”).
Exploration programs for the second half of 2025 are focused on:
Diamba Sud PEA Overview
The PEA outlines the design of an open pit gold mining operation targeting a series of deposits including Area A, Area D, Karakara, Western Splay, Kassassoko, Moungoundi, and Southern Arc which will feed a central gold processing facility over the current 8.1-year LOM. The assessment is based on Diamba Sud´s Mineral Resource estimate, which comprises an Indicated Mineral Resource of 14.2 million tonnes (Mt) at an average gold grade of 1.59 grams per tonne (g/t), containing 724,000 ounces of gold, and an Inferred Mineral Resource of 6.2 Mt at an average grade of 1.44 g/t gold, containing 285,000 ounces of gold, reported as of July 7, 2025 (refer to Fortuna news release dated August 5, 2025, “Fortuna Advances Diamba Sud Gold Project in Senegal with Updated Mineral Resources; PEA Completion Targeted for Q4 2025”).
Mining and Processing
The PEA and mine plan outline the design of an open pit gold mining operation feeding a central gold processing facility over the 8.1-year LOM. The assessment anticipates the concurrent development of multiple deposits, including Area A, Area D, Karakara, Western Splay, Kassassoko, Moungoundi, and Southern Arc, with no more than three pits mined at any one time (refer to Figure 1).
The production strategy targets an initial throughput of 2.5 million tonnes per annum (Mtpa) during the first three years of operation, supported by the high oxide content at Area D, before transitioning to a sustained rate of 2.0 Mtpa from year four onward as the feed becomes predominantly fresh material.
Exploration drilling completed at the Southern Arc deposit subsequent to the Mineral Resource estimate in the PEA has intersected near-surface mineralization to the south and east of the currently defined pit limits. It is anticipated that these results will be incorporated in future evaluations to enhance gold production in the later years of the LOM.
The pit optimization shells used to define the mining inventory were generated using a gold price of $2,300 per ounce and a revenue factor of 1.0. Optimization parameters incorporated government royalties, refining, mining, processing, and general and administrative costs to ensure realistic pit designs and economic assumptions.
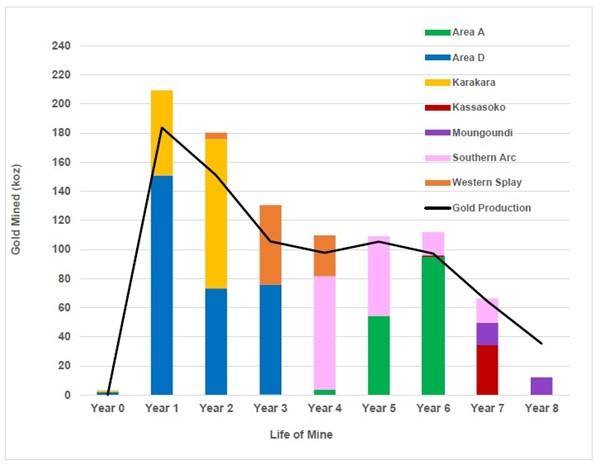
Figure 1: Diamba Sud PEA Production Profile: Annual gold production profile over the projected LOM, highlighting the contribution from individual deposits and the transition from oxide to fresh material.
Mining activities at Diamba Sud will employ conventional open pit methods. Drilling and blasting are planned for both oxide and fresh mineralized material, followed by conventional truck-and-shovel operations for the movement of potentially mineralized material and waste within the pits.
The Diamba Sud process plant design is based on a metallurgical flowsheet developed to produce gold doré at optimum recovery while minimizing initial capital and operating costs. The flowsheet comprises conventional crushing, milling (single-stage semi-autogenous grinding mill in closed circuit with cyclones), gravity recovery, carbon-in-leach processing, carbon elution, and gold recovery.
A summary of the key operating and production statistics from the PEA is presented in Table 2.
Table 2: Diamba Sud LOM Mining and Processing Plan Metrics
| Unit | Year -1 | Year 0 | Year 1 | Year 2 | Year 3 | Year 4 | Year 5 | Year 6 | Year 7 | Year 8 | LOM | |
| Area A | ||||||||||||
| Potentially mineralized material mined | kt | 9 | 122 | 923 | 2,044 | 3,098 | ||||||
| Au grade | g/t | 1.17 | 0.97 | 1.84 | 1.45 | 1.54 | ||||||
| Area D | ||||||||||||
| Potentially mineralized material mined | kt | 69 | 1,870 | 1,718 | 1,666 | 5,323 | ||||||
| Au grade | g/t | 0.87 | 2.51 | 1.33 | 1.41 | 1.76 | ||||||
| Karakara | ||||||||||||
| Potentially mineralized material mined | kt | 21 | 974 | 1,745 | 2,741 | |||||||
| Au grade | g/t | 1.97 | 1.87 | 1.83 | 1.84 | |||||||
| Kassassoko | ||||||||||||
| Potentially mineralized material mined | kt | – | 30 | 1,099 | 1,130 | |||||||
| Au grade | g/t | – | 1.04 | 0.97 | 0.97 | |||||||
| Moungoundi | 34.3 | |||||||||||
| Potentially mineralized material mined | kt | 499 | 296 | 795 | ||||||||
| Au grade | g/t | 0.95 | 1.28 | 1.07 | ||||||||
| Southern Arc | 15.2 | |||||||||||
| Potentially mineralized material mined | kt | 0 | 1,532 | 1,008 | 299 | 264 | 3,103 | |||||
| Au grade | g/t | 0.47 | 1.58 | 1.68 | 1.65 | 1.98 | 1.65 | |||||
| Western Splay | 16.8 | |||||||||||
| Potentially mineralized material mined | kt | 121 | 1,172 | 270 | 1,564 | |||||||
| Au grade | g/t | 1.12 | 1.45 | 3.22 | 1.73 | |||||||
| Total | ||||||||||||
| Potentially mineralized material mined | kt | 90 | 2,845 | 3,585 | 2,847 | 1,925 | 1,931 | 2,373 | 1,862 | 296 | 17,754 | |
| Au grade | g/t | 1.13 | 2.29 | 1.56 | 1.43 | 1.77 | 1.76 | 1.47 | 1.11 | 1.28 | 1.63 | |
| Contained gold | koz | 3.3 | 209.4 | 180.3 | 130.5 | 109.6 | 109.0 | 111.9 | 66.3 | 12.2 | 932.4 | |
| Waste mined | kt | 2,322 | 16,326 | 15,588 | 16,380 | 17,166 | 13,793 | 7,264 | 7,597 | 656 | 97,092 | |
| Total mined | kt | 2,412 | 19,171 | 19,173 | 19,228 | 19,091 | 15,723 | 9,637 | 9,459 | 953 | 114,846 | |
| Stockpile | ||||||||||||
| Start of period | kt | 90 | 580 | 1,665 | 2,013 | 1,712 | 1,532 | 1,875 | 1,524 | n/a | ||
| Grade | g/t | 1.13 | 0.76 | 0.57 | 0.59 | 0.68 | 0.59 | 0.59 | 0.58 | n/a | ||
| Processing | ||||||||||||
| Material milled | kt | 2,354 | 2,500 | 2,500 | 2,225 | 2,111 | 2,030 | 2,213 | 1,821 | 17,754 | ||
| Head grade | g/t | 2.62 | 2.04 | 1.53 | 1.55 | 1.72 | 1.62 | 1.03 | 0.70 | 1.63 | ||
| Contained gold | koz | 198.5 | 163.8 | 122.7 | 110.8 | 117.0 | 105.7 | 73.2 | 40.7 | 932.4 | ||
| Recovery | % | 92.5 | 92.1 | 86.1 | 88.2 | 90.0 | 91.9 | 87.9 | 86.6 | 90.1 | ||
| Gold production | koz | 183.7 | 150.9 | 105.6 | 97.7 | 105.3 | 97.2 | 64.3 | 35.3 | 840 |
Tailings, Water and Power
The tailings management system will comprise a tailings pipeline and a water return pipeline housed within a geomembrane-lined trench, with associated tailings pumps. The Tailings Storage Facility (TSF) will be fully lined with a geomembrane and will be developed as a side-valley storage facility formed by robust, multi-zoned earth-fill embankments. It is designed to accommodate 17.8 Mt of tailings and will be constructed using the downstream methodology, in accordance with industry best practices and the Global Industry Standard on Tailings Management (GISTM).
A water storage dam will serve as the main collection and storage facility for clean, raw, and process water. Raw water is currently assumed to be supplied via a pipeline from the Falémé River, supplemented by pit dewatering activities. Ongoing studies are evaluating the potential to develop a water harvesting facility as an alternative source. Process water from the TSF will be recycled back to the plant, with site operations designed as a closed-circuit system to maximize water reuse and minimize environmental impacts on surrounding communities.
Power for Diamba Sud is expected to be self-supplied through an on-site power plant. The current plan envisages a heavy fuel oil power plant constructed in an N+1 configuration, supported by light fuel oil generators to meet site-wide demand. In parallel, a hybrid solar photovoltaic system is being evaluated as part of the preparation of the DFS.
Capital Costs Summary
The PEA estimates the total initial capital required to develop Diamba Sud to be $283.2 million, including $4.0 million in capitalized closure costs to be deposited into escrow and a $46.4 million contingency. Sustaining capital is estimated at an additional $40.0 million, directly related to mining operations, processing, and infrastructure sustaining capital, along with a further $8.0 million in closure costs over the 8.1-year LOM.
Mining pre-production capital includes all mining activities required prior to commissioning of the processing facility. A total of 2.3 Mt of waste and 90 kt of potentially mineralized material will be mined to establish a stockpile ahead of processing operations. All contractor mobilization and setup costs are included in the pre-production capital allowance.
The processing plant capital estimate relates to a facility with a nameplate throughput of 2.0 Mtpa, designed to accommodate up to 2.5 Mtpa. The capital cost estimate is based on an Engineering, Procurement, Construction, and Management (EPCM) implementation approach.
A summary of estimated capital costs is presented in Table 3, and the estimated annual sustaining capital costs are set out in Table 4.
Table 3: Summary of Initial Development Capital Costs
| Capital Costs | Value ($ M) |
| Construction costs | $191.7 |
| Pre-production costs (excluding mining) | $21.6 |
| Mining pre-stripping | $19 |
| Contingency | $46.4 |
| Withholding taxes, duties, levies | $4.5 |
| Total | $283.2 |
Table 4: Estimated Annual Sustaining Capital Costs
| Year | Units | Year | Year | Year | Year | Year | Year | Year | Year | Year | Year | Total |
| 1 | 2 | 3 | 4 | 5 | 6 | 7 | 8 | 9 | 10 | |||
| TSF lifts | $ M | 4.5 | – | 7.3 | – | 11.7 | – | 11.1 | – | 34.6 | ||
| Roads | $ M | – | 2.1 | 0.2 | – | – | 0.1 | 0.3 | – | 2.7 | ||
| Surface water management | $ M | – | 1.0 | 0.9 | – | – | – | 0.3 | – | 2.3 | ||
| Closure | $ M | – | – | 0.6 | 0.6 | 0.6 | 0.6 | 0.6 | 5.3 | 8.5 | ||
| Total | $ M | 4.5 | 3.1 | 9.1 | 0.6 | 12.3 | 0.7 | 12.4 | 5.3 | 48.0 |
Operating Costs Summary
The PEA estimates direct operating costs of $51.16 per tonne of material milled or $1,081 per ounce of gold produced, and AISC1 of $1,238 per ounce over the LOM, as summarized in Table 5.
Table 5: LOM AISC1
| $M | $/t milled | $/payable oz | |
| Operating cost | |||
| Mining | 542 | 30.54 | 646 |
| Processing | 247 | 13.91 | 294 |
| G&A | 119 | 6.70 | 142 |
| Subtotal, direct operating costs | 908 | 51.16 | 1,081 |
| Refining | 3 | 0.14 | 3 |
| Royalties2 | 69 | 3.90 | 83 |
| Social Development Fund2 | 12 | 0.65 | 14 |
| Total Operating Costs | 992 | 55.85 | 1,180 |
| Sustaining Capital, and Reclamation | |||
| Sustaining Capital | 40 | 2.23 | 47 |
| Closure | 8 | 0.48 | 10 |
| All-in Sustaining Cost1 | 1,040 | 58.56 | 1,238 |
Notes:
Financial Analysis
Diamba Sud has been evaluated on a discounted cash flow basis and the results of the PEA demonstrate that it is potentially economically robust. The base case, using a gold price of $2,750 per ounce, generates an after-tax NPV at a 5 percent discount rate of $563 million, an IRR of 72 percent, and a payback period of approximately ten months. Figure 2 illustrates the estimated cash flow profile of Diamba Sud over the LOM.
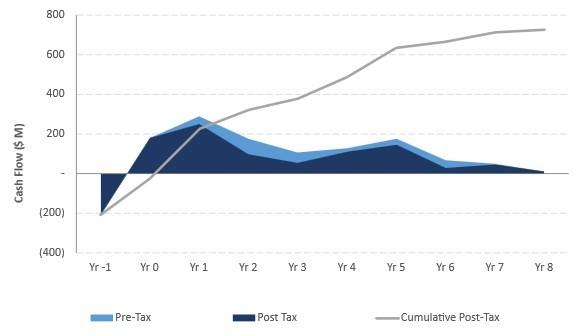
Figure 2: Diamba Sud Cash Flow Profile
Sensitivity Analysis: Strong economic performance across a range of key variables
Diamba Sud´s NPV and IRR are most sensitive to changes in revenue parameters, including gold price, head grade, and process plant recovery. NPV and IRR are more sensitive to variations in operating costs than to capital costs.
Estimated NPV sensitivities for key operating and economic metrics are presented in Figure 3.
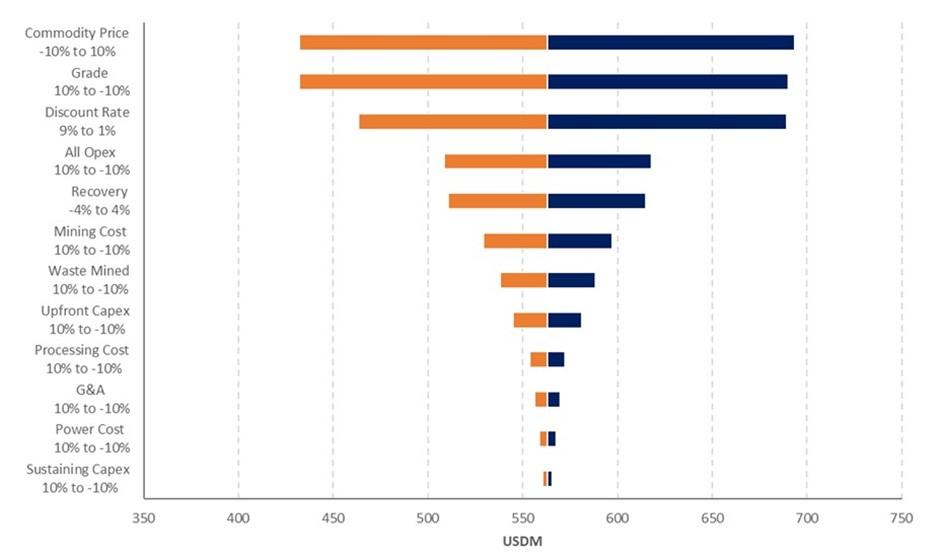
Figure 3: After-tax NPV5% Sensitivities
The sensitivity of Diamba Sud’s NPV to changes in the applied discount rate and gold price is presented in Table 5; base case highlighted.
Table 5: Gold Price and Discount Rate Sensitivities on Post-tax NPV ($ M)
| Gold Price ($/oz) | |||||||||
| $2,000 | $2,250 | $2,500 | $2,750 | $3,000 | $3,250 | $3,500 | $3,750 | ||
| Discount Rate (%) | 3.0 | $230 | $362 | $494 | $622 | $750 | $878 | $1,007 | $1,134 |
| 5.0 | $200 | $322 | $444 | $563 | $682 | $800 | $919 | $1,037 | |
| 7.0 | $173 | $287 | $400 | $511 | $621 | $731 | $841 | $951 | |
The sensitivity of Diamba Sud’s IRR to changes in the key operating parameters is illustrated in Figure 4.
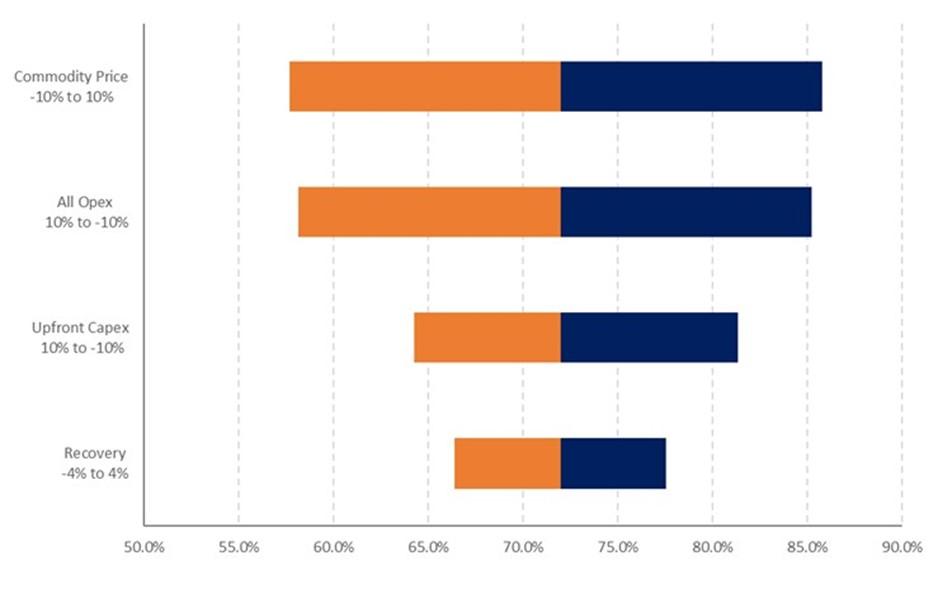
Figure 4: Diamba Sud Post-Tax IRR sensitivities
Environmental and Permitting
On October 6, 2025, Fortuna filed an Environmental and Social Impact Assessment (ESIA) with the Direction de la Réglementation Environnementale et du Contrôle (DiREC), a division of the Ministry of the Environment and Sustainable Development of Senegal (refer to Fortuna news release dated October 7, 2025, “Fortuna Files Environmental and Social Impact Assessment for the Diamba Sud Gold Project in Senegal and provides update on Preliminary Economic Assessment status”). The filing of the ESIA marks an important milestone in the permitting process.
Fortuna expects to apply and receive an exploitation permit for Diamba Sud before the expiry of its exploration permit in June 2026.
Next Steps: Definitive Feasibility Study and Early Works
Fortuna has approved a supplementary budget of $17 million to de-risk Diamba Sud’s development schedule by advancing early work planning and permitting in parallel with early works construction activities to establish site access and a new accommodation camp. In addition, subject to Board approval, front-end engineering and design is scheduled to commence this quarter, followed by the procurement of long-lead items in the second quarter of 2026 to ensure readiness for project execution.
The DFS is expected to be completed towards the end of the second quarter of 2026, leading to an anticipated construction decision shortly thereafter. A positive construction decision would position Diamba Sud to begin full construction in the fourth quarter of 2026, following the wet season, with first gold pour targeted for the second quarter of 2028.
The projected timeline for development and key milestones is illustrated in Figure 5.
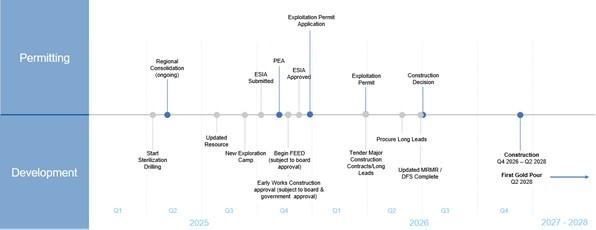
Figure 5: Diamba Sud Projected Development Timeline and Key Milestones
Technical Report
A technical report supporting the results of the PEA will be prepared in accordance with National Instrument 43-101, Standards of Disclosure for Mineral Projects and filed on SEDAR+ at www.sedarplus.com and on EDGAR at www.sec.gov/edgar under Fortuna Mining’s profile within 45 days of the date of this news release. The technical report will also be available on the Company’s website at www.fortunamining.com.
Further information regarding the PEA referenced in this news release, including details on data verification, key assumptions, parameters, opportunities, risks, and other factors, will be contained in the technical report.
The PEA is preliminary in nature, and it includes inferred mineral resources that are considered too speculative geologically to have the economic considerations applied to them that would enable them to be categorized as mineral reserves, and, as such, there is no certainty that the PEA results will be realized.
Qualified Person
Raul Espinoza, Director of Technical Services for the Company, is a Fellow member and Chartered Professional of the Australasian Institute of Mining and Metallurgy (FAusIMM CP) and a Qualified Person as defined by National Instrument 43-101, Standards of Disclosure for Mineral Projects. Mr. Espinoza has reviewed and approved the scientific and technical information pertaining to the Project contained in this news release and has verified the underlying data.
About Fortuna Mining Corp.
Fortuna Mining Corp. is a Canadian precious metals mining company with three operating mines and a portfolio of exploration projects in Argentina, Côte d’Ivoire, Mexico, and Peru, as well as the Diamba Sud Gold Project in Senegal. Sustainability is at the core of our operations and stakeholder relationships. We produce gold and silver while creating long-term shared value through efficient production, environmental stewardship, and social responsibility.
CPM Group’s 10-Year Copper Outlook are now available. ... READ MORE
Arizona Gold and Silver Inc. (TSX-V: AZS) (OTCQB: AZASF) is ple... READ MORE
Brixton Metals Corporation (TSX-V: BBB) (OTCQX: BBBXF) is pleased... READ MORE
Valkea Resources Corp. (TSX-V: OZ) is pleased to announce the clo... READ MORE
Tiger Gold Corp. (TSX-V: TIGR) (FSE: D150) (OTCQB: TGRGF) is plea... READ MORE


