


![]()
Orezone Gold Corporation (TSX:ORE) (ASX: ORE) (OTCQX: ORZCF) is pleased to report its operational and financial results for the three and six months ended June 30, 2025.
Second Quarter 2025 Highlights
1 to the Company’s Prospectus dated July 11, 2025, a copy of which is available on the Company’s website. The Company confirms it is not aware of any new information or data that materially affects the information included in the Prospectus and that all material assumptions and technical parameters underpinning the forecast gold production targets in the Prospectus continue to apply and have not materially changed.
2 Refer to footnote 1.
Patrick Downey, President and CEO, commented “Q2 marked another solid operating quarter at Bomboré, with all production metrics, including grade, recovery, and tonnes processed, inline with plan. This is a testament to the site operating team, who remain focused on operational excellence. During Q2, this included several stage 1 hard rock operational readiness initiatives, including 1) maintaining an elevated mining rate through the onset of the rainy season to advance a number of pits to the hard rock interface, and 2) processing a greater percentage of corresponding transitional material while achieving a mill throughput rate at 20% above nameplate.
The higher realized AISC in Q2 was mainly attributable to external factors including higher royalties, lower grid power availability and unfavourable foreign exchange movements. The higher royalty costs were the result of a record realized gold price of $3,338/oz versus the budgeted $2,600/oz, along with a newly enacted royalty structure that added 1% to the royalty rates. The lower than expected grid power availability that led to more power generation onsite using higher cost diesel, was the result of a fire at a supply line substation, and higher than forecasted seasonal variability, which year over year has materially improved. A steady improvement in grid power has been seen in the past two months with utilization increasing from 50% in Q2, to 76% in July, and a return to >90% in August. The XOF strengthened against the USD by over 7% from Q1 to Q2 which negatively impacted reported costs as the majority of operating expenditures are in the local currency. These three external factors combined are estimated to have added $236 per ounce to the guided AISC per ounce sold in Q2.
Through Q2, the Company made steady progress on its multiple growth initiatives. The construction of the stage 1 hard rock plant remains on schedule and on budget, with first gold on track for Q4-2025. This will mark an important milestone for the Company with overall gold production at Bomboré forecasted to increase to 170,000-185,000 ounces in 20263. On the stage 2 hard rock expansion, early progress was made advancing engineering, scheduling and initial procurement, with a Board approved construction decision made subsequent to quarter end. Executing on these growth initiatives over the next 16 months will significantly transform the Company by increasing overall production at Bomboré to 220,000-250,000 ounces per annum4. This production growth will be complemented by an ongoing focus on exploration, with the goal of increasing the current resource base to a targeted 7 to 10 million ounces longer term5.
Exploration drilling through H1-2025 was successful on multiple fronts, further underscoring the significant exploration upside to the current stated 5.0 million ounce global resource base at Bomboré. Results included 1) extending the North Zone footwall mineralization up to 200m below the current reserve pits along 800m strike length, 2) extending mineralization of the P17S high-grade sub-zone a further 300m down plunge, and 3) identifying multiple broad near-surface strike extensions.
Following several months of hard work, Orezone has commenced trading on the ASX under the ticker “ORE”. The secondary listing on the ASX has broadened our investor base into the very active Australian mining market, enhancing the Company’s capital markets profile and trading liquidity.”
3 Refer to footnote 1.
4 Refer to footnote 1.
5 This statement of the Company’s goal of increasing the current stated 5 million ounce global resource base to a targeted 7 to 10 million ounces longer term is an aspirational statement, and the Company does not yet have reasonable grounds to believe the statement can be achieved.
Highlights for the Second Quarter and Significant Subsequent Events
| (All mine site figures on a 100% basis) | Q2-2025 | Q2-2024 | H1-2025 | H1-2024 | |
| Operating Performance | |||||
| Gold production | oz | 27,548 | 25,524 | 56,236 | 55,663 |
| Gold sales | oz | 28,265 | 24,937 | 57,208 | 56,166 |
| Average realized gold price | $/oz | 3,338 | 2,334 | 3,092 | 2,185 |
| Cash costs per gold ounce sold1 | $/oz | 1,609 | 1,386 | 1,415 | 1,242 |
| All-in sustaining costs1 (“AISC”) per gold ounce sold | $/oz | 1,830 | 1,613 | 1,620 | 1,452 |
| Financial Performance | |||||
| Revenue | $000’s | 94,512 | 58,343 | 177,227 | 123,028 |
| Earnings from mine operations | $000’s | 39,951 | 23,167 | 78,514 | 50,049 |
| Net earnings attributable to shareholders of Orezone | $000’s | 15,906 | 8,939 | 31,885 | 20,636 |
| Net earnings per common share attributable to shareholders of Orezone
Basic Diluted |
$ $ |
0.03 0.03 |
0.02 0.02 |
0.06 0.06 |
0.06 0.05 |
| EBITDA1 | $000’s | 40,270 | 26,728 | 81,452 | 57,057 |
| Adjusted EBITDA1 | $000’s | 45,493 | 20,491 | 89,687 | 46,419 |
| Adjusted earnings attributable to shareholders of Orezone1 | $000’s | 20,607 | 3,326 | 39,297 | 11,062 |
| Adjusted earnings per share attributable to shareholders of Orezone1 | $ | 0.04 | 0.01 | 0.08 | 0.03 |
| Cash and Cash Flow Data | |||||
| Operating cash flow before changes in working capital | $000’s | 27,023 | 15,331 | 67,009 | 36,671 |
| Operating cash flow | $000’s | 16,357 | (51) | 44,061 | 13,586 |
| Free cash flow1 | $000’s | (27,154) | (16,951) | (23,472) | (14,938) |
| Cash, end of period | $000’s | 72,592 | 11,446 | 72,592 | 11,446 |
1 Cash costs, AISC, EBITDA, Adjusted EBITDA, Adjusted earnings, Adjusted earnings per share, and Free cash flow are non-IFRS measures. See “Non-IFRS Measures” section below for additional information.
SECOND QUARTER HIGHLIGHTS
OPERATING HIGHLIGHTS
| Bomboré Mine, Burkina Faso (100% basis) | Q2-2025 | Q2-2024 | H1-2025 | H1-2024 | |
| Safety | |||||
| Lost-time injuries frequency rate | Per 1M hours | 0.55 | 0.00 | 0.31 | 0.00 |
| Personnel-hours worked | 000’s hours | 1,823 | 1,322 | 3,181 | 2,372 |
| Mining Physicals | |||||
| Ore tonnes mined | tonnes | 2,059,136 | 1,966,547 | 4,173,679 | 4,369,080 |
| Waste tonnes mined | tonnes | 3,948,902 | 3,451,757 | 7,967,084 | 6,574,856 |
| Total tonnes mined | tonnes | 6,008,038 | 5,418,305 | 12,140,763 | 10,943,936 |
| Strip ratio | waste:ore | 1.92 | 1.76 | 1.91 | 1.50 |
| Processing Physicals | |||||
| Ore tonnes milled | tonnes | 1,565,022 | 1,428,396 | 3,076,325 | 2,784,015 |
| Head grade milled | Au g/t | 0.62 | 0.64 | 0.65 | 0.71 |
| Recovery rate | % | 87.8 | 86.8 | 87.8 | 88.0 |
| Gold produced | Au oz | 27,548 | 25,524 | 56,236 | 55,663 |
| Unit Cash Cost | |||||
| Mining cost per tonne | $/tonne | 3.27 | 3.29 | 3.04 | 3.38 |
| Mining cost per ore tonne processed | $/tonne | 9.50 | 8.87 | 8.79 | 8.46 |
| Processing cost | $/tonne | 9.65 | 9.19 | 8.74 | 9.21 |
| Site general and admin (“G&A”) cost | $/tonne | 4.36 | 3.96 | 4.08 | 3.87 |
| Cash cost per ore tonne processed | $/tonne | 23.51 | 22.02 | 21.61 | 21.54 |
| Cash Costs and AISC Details | |||||
| Mining cost (net of stockpile movements) | $000’s | 14,869 | 12,672 | 27,045 | 23,539 |
| Processing cost | $000’s | 15,106 | 13,120 | 26,888 | 25,640 |
| Site G&A cost | $000’s | 6,824 | 5,654 | 12,542 | 10,788 |
| Refining and transport cost | $000’s | 113 | 136 | 279 | 253 |
| Government royalty cost | $000’s | 8,366 | 4,595 | 14,968 | 9,727 |
| Gold inventory movements | $000’s | 206 | (1,625) | (745) | (209) |
| Cash costs1 on a sales basis | $000’s | 45,484 | 34,552 | 80,977 | 69,738 |
| Sustaining capital | $000’s | 4,284 | 3,281 | 7,483 | 7,299 |
| Sustaining leases | $000’s | 74 | 73 | 147 | 146 |
| Corporate G&A | $000’s | 1,880 | 2,319 | 4,062 | 4,388 |
| All-In Sustaining Costs1 on a sales basis | $000’s | 51,722 | 40,225 | 92,669 | 81,571 |
| Gold sold | Au oz | 28,265 | 24,937 | 57,208 | 56,166 |
| Cash costs per gold ounce sold1 | $/oz | 1,609 | 1,386 | 1,415 | 1,242 |
| All-In Sustaining Costs per gold ounce sold1 | $/oz | 1,830 | 1,613 | 1,620 | 1,452 |
1 Non-IFRS measure. See “Non-IFRS Measures” section below for additional details.
BOMBORÉ PRODUCTION RESULTS
Q2-2025 vs Q2-2024
Gold production in Q2-2025 was 27,548 oz, an increase of 8% from the 25,524 oz produced in Q2-2024. The higher gold production is attributable to a 10% increase in plant throughput and a 1% increase in recovery rates partially offset by a 3% decline in head grades.
Plant throughput of 1.57M tonnes in Q2-2025 continues to operate ahead of nameplate by 20% and was 10% higher than Q2-2024 as plant operating hours in Q2-2024 were reduced by more frequent grid power interruptions and the longer length of time needed to transition power on and off of back-up diesel gensets during grid blackouts and restorations.
Hourly plant throughput was successfully improved starting in July 2024 and maintained into 2025 by increasing the mill power draw and reducing residence time in the CIL circuit with only a minor loss in recovery. Transition time to switch between the grid and back-up gensets have also been lowered from improvements made to the site power infrastructure in Q1-2025.
The better head grades in Q2-2024 were from the sequencing of higher-grade pits in earlier periods of the mine plan and the preferential stockpiling of lower-grade ore mined.
BOMBORÉ OPERATING COSTS
Q2-2025 vs Q2-2024
AISC per gold oz sold in Q2-2025 was $1,830, a 13% increase from $1,613 per oz sold in Q2-2024. The higher AISC is primarily attributable to: (a) greater per oz royalty costs ($296/oz vs $184/oz) from a 43% increase in the realized gold price and new higher royalty rates enacted into law in April 2025; (b) lower head grades; (c) a higher strip ratio; and (d) XOF currency appreciation against the USD (~5% higher) on costs set in the local currency.
Power costs in both quarters suffered from high occurrences of power dips and blackouts to the national grid, resulting in more use of the back-up diesel gensets for power generation at the Bomboré mine. Grid supply is seasonally low in Q2, and similar to 2024, has significantly improved starting in Q3 with weekly grid utilization regularly exceeding 90%. For power consumed at the mine, the national grid supplied 50% in Q2-2025 and 34% in Q2-2024, leading to increased processing costs in these quarters from the use of higher-cost diesel for power generation.
Cash cost per ore tonne processed in Q2-2025 was $23.51/tonne, an increase of 7% from $22.02/tonne in Q2-2024, driven by a stronger XOF currency impacting costs in all departments, a 9% increase in the strip ratio in mining, and higher unit consumption rates for power and lime in processing due to the changing composition of ore fed into the mill.
BOMBORÉ HARD ROCK EXPANSION
Hard Rock Expansion – Stage 1
Construction of the 2.5Mtpa stage 1 hard rock expansion remains on schedule and on budget, with first gold expected in Q4-2025.
Progress and milestones achieved to the end of Q2-2025 include:
All major site installation contracts (concrete, structural/mechanical/piping, electrical/instrumentation, and mill installation) were awarded to the same contractors that successfully delivered on the oxide construction. These contractors have now mobilized to site except for the electrical and instrumentation contractor whose team is scheduled to arrive in Q3-2025.
As of June 30, 2025, the Company has incurred $57.0M in costs to-date against the project budget, of which $22.7M and $41.7M were incurred in Q2-2025 and H1-2025, respectively.
Figure 1: Bomboré Processing Complex – Hard Rock Plant Layout (blue labels) Relative to Oxide Plant and Other Established Infrastructure (white labels)
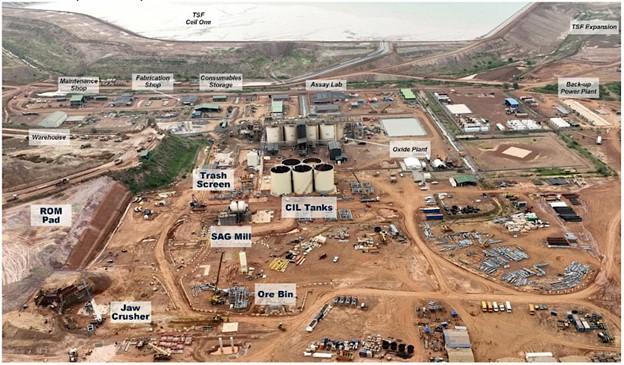
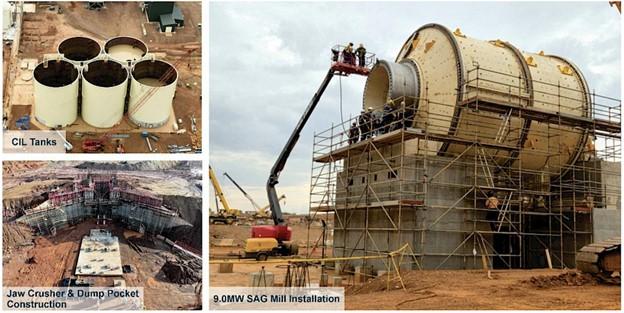
Figure 2: Stage 1 Hard Rock Expansion – Major Plant Component Construction
Hard Rock Expansion – Stage 2
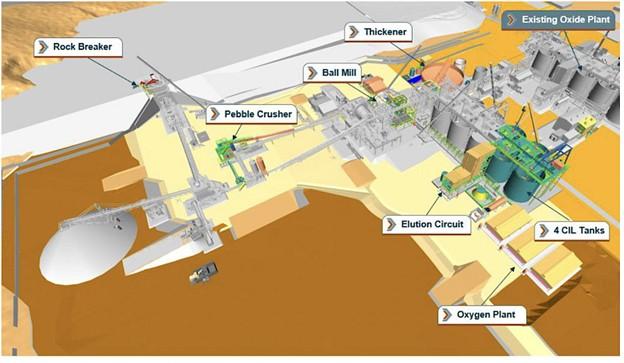
On August 13, 2025, the Company’s Board of Directors approved a final investment decision to proceed with stage 2 construction of the hard rock expansion. To the 2.5Mtpa stage 1 hard rock circuit, the stage 2 expansion to 5.5Mtpa comprises the addition of a ball mill, pebble crusher, thickener, oxygen plant, four additional CIL tanks, and a gold room upgrade.
The latest capital cost estimate for the stage 2 hard rock expansion is $90M to $95M, with a construction timeline to first gold in Q4-2026 of 16 months. Once in commercial production, stage 2 is projected to increase overall gold production at Bomboré to 220,000-250,000 ounces per annum.
The Company intends to award engineering and procurement for the stage 2 expansion to Lycopodium. During Q2-2025, the Company contracted Lycopodium to perform front-end engineering and design, along with advancing procurement on long-lead equipment as part of stage 2 early works ahead of the approved final investment decision.
As of June 30, 2025, the Company has incurred $0.4M in costs in Q2-2025 and for the project to-date.
Figure 3: Schematic highlighting mill component additions for stage 2 hard rock expansion. Oxide plant and stage 1 hard rock circuit in grey.
CORPORATE AND SIGNIFICANT SUBSEQUENT EVENTS
Corporate
Subsequent Events
NON-IFRS MEASURES
The Company has included certain terms or performance measures commonly used in the mining industry that is not defined under IFRS, including “cash costs”, “AISC”, “EBITDA”, “adjusted EBITDA”, “adjusted earnings”, “adjusted earnings per share”, and “free cash flow”. Non-IFRS measures do not have any standardized meaning prescribed under IFRS, and therefore, they may not be comparable to similar measures presented by other companies. The Company uses such measures to provide additional information and they should not be considered in isolation or as a substitute for measures of performance prepared in accordance with IFRS. For a complete description of how the Company calculates such measures and reconciliation of certain measures to IFRS terms, refer to “Non-IFRS Measures” in the Management’s Discussion and Analysis for the three months ended June 30, 2025 which is incorporated by reference herein.
QUALIFIED PERSONS
The scientific and technical information in this news release was reviewed and approved by Mr. Rob Henderson, P. Eng, Vice-President of Technical Services and Mr. Dale Tweed, P. Eng., Vice-President of Engineering, both of whom are Qualified Persons as defined under NI 43-101 Standards of Disclosure for Mineral Projects.
ABOUT OREZONE GOLD CORPORATION
Orezone Gold Corporation is a West African gold producer engaged in mining, developing, and exploring its 90%-owned flagship Bomboré Gold Mine in Burkina Faso. Construction of the stage 1 hard rock expansion is well underway, with first gold expected in Q4-2025. Combined production from the oxide and stage 1 hard rock operations is forecasted to total between 170,000 and 185,000 ounces in 2026. The Company is also advancing the stage 2 hard rock expansion, which is forecasted to increase annual production to between 220,000 and 250,000 ounces.
The technical report entitled Bomboré Phase II Expansion, Definitive Feasibility Study is available on SEDAR+ and the Company’s website.
Cassiar Gold Corp. (TSX-V: GLDC) (OTCQX: CGLCF) is pleased to announce that, further to its news rel... READ MORE
Midland Exploration Inc. (TSX-V: MD) is pleased to announce that it has completed a second and fina... READ MORE
Wallbridge Mining Company Limited (TSX: WM) (OTCQB:WLBMF) is pleased to announce that it has closed... READ MORE
GR Silver Mining Ltd. (TSX-V: GRSL) (OTCQX: GRSLF) (FRANKFURT: GPE) is pleased to announce outstandi... READ MORE
McEwen Inc. (NYSE: MUX) (TSX: MUX) today announced that it has received a $49.4 million dividend fr... READ MORE


