


Discovery Silver Corp. (TSX: DSV, OTCQX: DSVSF) announced the Company’s financial and operating results for the second quarter and first six months of 2025. Q2 2025 represents the first quarter Discovery has reported the results of gold production and sales following the Company’s acquisition of the Porcupine Complex in and near Timmins, Ontario on April 15, 2025. The Company’s full financial statements and management discussion & analysis are available on SEDAR+ at www.sedarplus.ca and on the Company’s website at www.discoverysilver.com. All dollar amounts are in US dollars, unless otherwise noted.
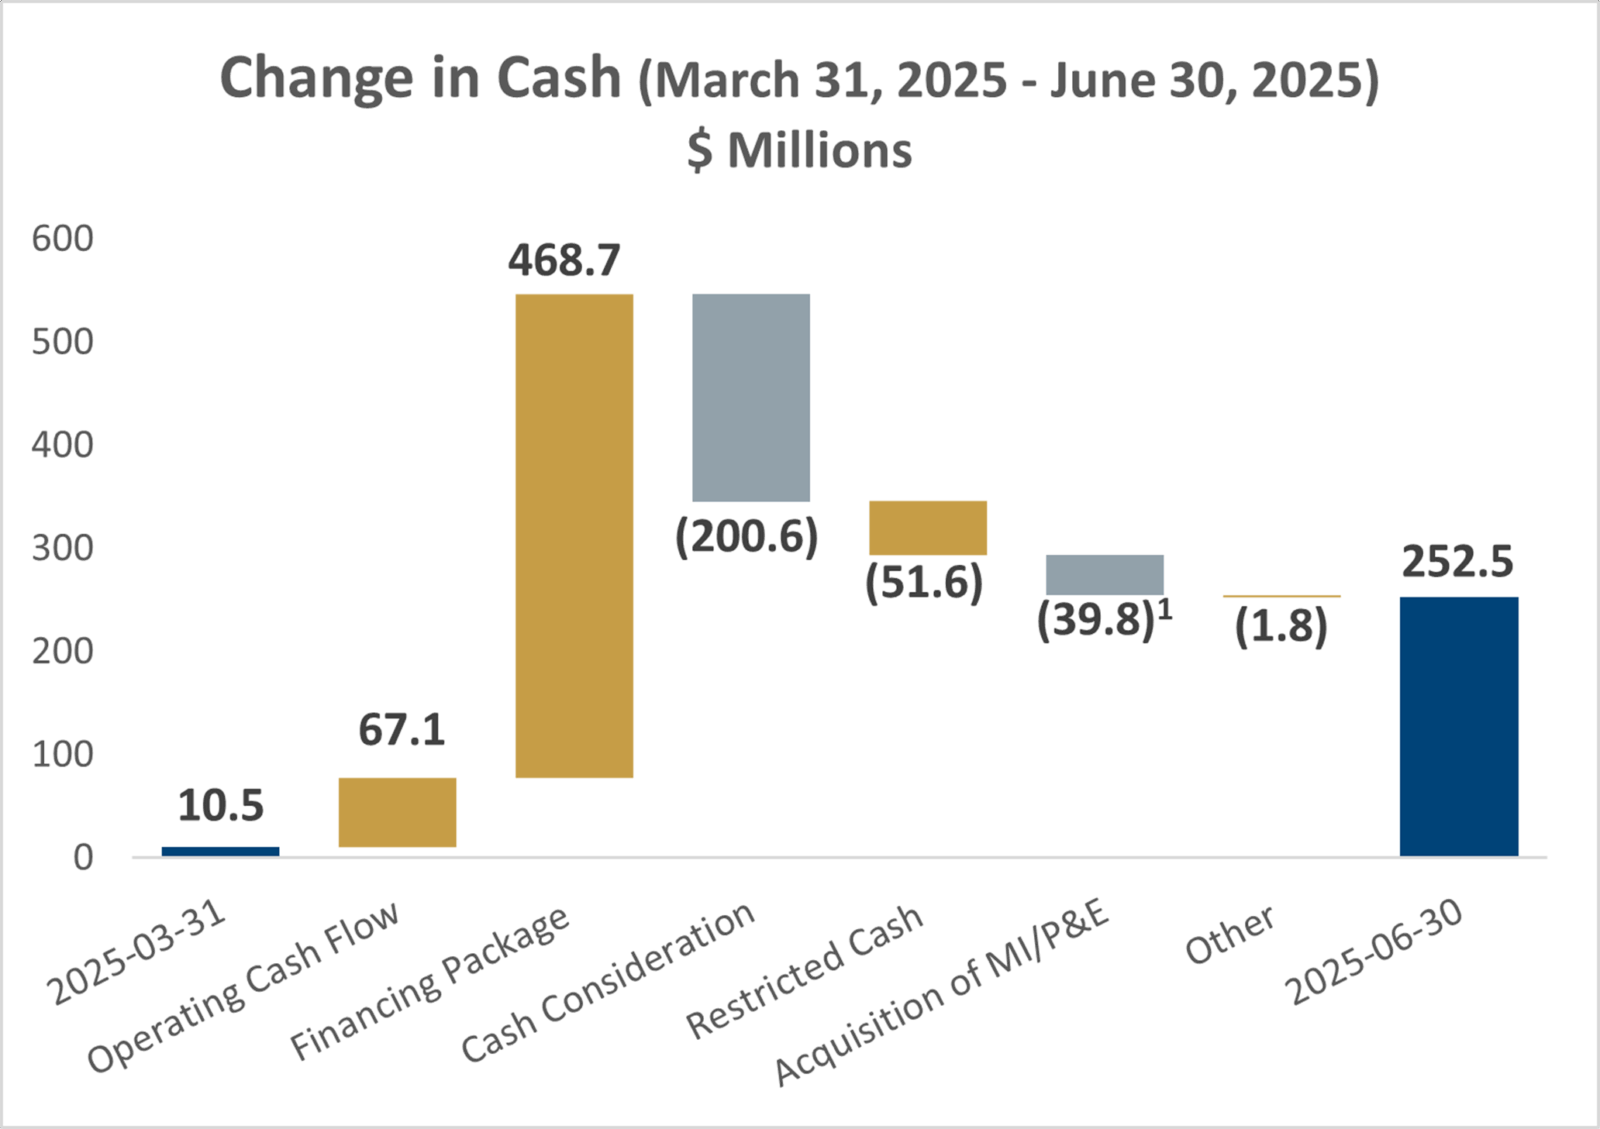
Tony Makuch, Discovery’s CEO, commented: “Q2 2025 was Discovery’s first quarter as a Canadian gold producer. During the quarter, we integrated systems, strengthened management structures and began implementing investment programs at Porcupine aimed at improving existing operations and pursuing growth opportunities. It was a significant challenge, and I want to thank our team for delivering a quarter of excellent progress. We also turned in a solid quarter of operating and financial performance, producing 50,552 ounces in the 76 days that we owned the assets. Gold sales of 42,550 ounces were below gold produced with the gold inventory at quarter end to be sold during Q3 2025. Net cash from operations totaled 67.1 million, while free cash flow was $27.3 million. Adjusted net earnings totaled $28.4 million or $0.04 per share.
“Key investment programs initiated during Q2 205 included investments at Dome Mill, mainly in the crushing, grinding and carbon handling circuits, advancing work at the Dome tailings management area continuing to ramp up Pamour, with pre-stripping and production levels meeting target levels, and commencing investments at Hoyle Pond and Borden to optimize and grow the operations. We also began deploying drills as part of an extensive exploration program targeting numerous near-mine and district targets at Hoyle Pond, Borden and Pamour, and supporting the evaluation of high-potential new sources of production, including the TVZ zone and the resumption of mining at Dome Mine.
“Looking ahead, we are targeting production levels to increase in the final two quarters of the year. We also plan to ramp up our capital investment and exploration programs as we move forward with our growth and value creation plans for Porcupine.”
SUMMARY OF Q2 2025 PERFORMANCE
| Three months ended | Six months ended | ||||||||||
| June 30, | June 30, | March 31 | June 30 | June 30, | |||||||
| 2025 | 2024 | 2025 | 2025 | 2025 | |||||||
| Revenue | $ | 142,010 | $ | – | $ | – | $ | 142,010 | $ | – | |
| Production costs | $ | 54,919 | – | – | 54,919 | – | |||||
| Earnings before income taxes | $ | 24,510 | (5,138) | (6,452) | $ | 18,058 | $ | (5,643) | |||
| Net earnings | $ | 5,534 | $ | (5,138) | $ | (6,452) | $ | (918) | $ | (5,643) | |
| Basic earnings per share | $ | 0.01 | $ | (0.01) | $ | (0.02) | $ | (0.00) | $ | (0.01) | |
| Diluted earnings per share | $ | 0.01 | $ | (0.01) | $ | (0.02) | $ | (0.00) | $ | (0.01) | |
| Cash flow from operating activities | $ | 67,081 | $ | (8,543) | $ | (6,075) | $ | 61,005 | $ | (11,014) | |
| Cash investment on mine development and PPE | $ | (39,766) | $ | (2,141) | $ | (3,767) | $ | (43,533) | $ | (5,448) | |
| Three months ended | Six months ended | ||||||||||
| June 30, | June 30, | March 31 | June 30 | June 30, | |||||||
| 2025 | 2024 | 2025 | 2025 | 2025 | |||||||
| Tonnes milled | 508,791 | – | – | 508,791 | – | ||||||
| Average Grade (g/t Au) | 3.39 | – | – | 3.39 | – | ||||||
| Recovery (%) | 91.3% | – | – | 91.3% | – | ||||||
| Gold produced (oz) | 50,552 | – | – | 50,552 | – | ||||||
| Gold sold (oz) | 42,550 | – | – | 42,550 | – | ||||||
| Average realized price ($/oz sold) | $ | 3,337 | $ | – | $ | – | $ | 3,337 | $ | – | |
| Operating cash costs per ounce sold ($/oz)(1)(2) | $ | 1,334 | $ | – | $ | – | $ | 1,334 | $ | – | |
| AISC per ounce sold ($/oz)(1)(2)(3) | $ | 2,123 | $ | – | $ | – | $ | 2,123 | $ | – | |
| Adjusted net earnings(1) | $ | 28,434 | $ | (2,107) | $ | (3,046) | $ | 25,338 | $ | (4,078) | |
| Adjusted net earnings per share(1) | $ | 0.04 | $ | (0.01) | $ | (0.01) | $ | 0.04 | $ | (0.01) | |
| Free cash flow(1) | $ | 27,314 | $ | (10,684) | $ | (9,842) | $ | 17,472 | $ | (16,462) | |
| (1) Example of Non-GAAP measure. See the section in this press release entitled, “NON-GAAP MEASURES” for more information. | |||||||||||
| (2) Consolidated operating cash costs per ounce sold and AISC per ounce sold include results from the Hoyle Pond and Borden operating mines, as well as corporate expenditures where applicable. They do not include operating costs, capital expenditures, or gold ounces sold from Pamour, which is a capital project that continues to ramp up towards commercial levels of production. | |||||||||||
| (3) YTD 2025 results exclude G&A expense, share-based compensation costs and sustaining capital expenditures and lease expense incurred prior to the April 15, 2025, the completion date of the Porcupine Acquisition. | |||||||||||
Q2 2025
| CAPITAL EXPENDITURES | |||||||||
| $ thousands unless otherwise states | Hoyle Pond | Borden | Pamour | Porcupine1 | Cordero | Corporate | Total | ||
| Sustaining | $5,743 | $9,032 | $- | $14,775 | $- | $1,347 | $16,122 | ||
| Growth | 1,854 | 2,665 | 22,338 | 26,857 | 1,196 | – | 28,053 | ||
| Total | $7,597 | $11,697 | $22,338 | $41,632 | $1,196 | $1,347 | $44,175 | ||
| 1. Capital expenditures incurred at Dome Mill and the TMA are allocated to Porcupine’s mining operations based on their proportion of mill fee provided to Dome Mill. | |||||||||
YTD 2025
Discovery did not generate revenue or earnings from mine operations in Q1 2025 or YTD 2024.
(1) Example of Non-GAAP measure. See the section of this press release entitled, “NON-GAAP MEASURES” for more information.
(2) Refers to earnings before interest, taxes and depreciation and amortization.
|
INCOME STATEMENT SUMMARY |
|||||||||||
| $ thousands unless otherwise states | Three months ended | Six months ended | |||||||||
| June 30, | June 30, | March 31 | June 30 | ||||||||
| 2025 | 2024 | 2025 | 2025 | June 30, 2025 |
|||||||
| Revenue | $ | 142,010 | $ | – | $ | – | $ | 142,010 | $ | – | |
| Production costs | 54,919 | – | – | 54,919 | – | ||||||
| Depletion and amortization | 16,384 | – | – | 16,384 | – | ||||||
| Royalties | 1,916 | – | – | 1,916 | – | ||||||
| Earnings from mining operations | 68,791 | – | – | 68,791 | – | ||||||
| Expenses | |||||||||||
| General and administration | 22,877 | 1,827 | 5,474 | 28,351 | 3,641 | ||||||
| Exploration | 830 | 103 | 25 | 855 | 217 | ||||||
| Share-based compensation | 1,953 | 692 | 1,167 | 3,120 | 1,346 | ||||||
| Earnings (loss) from operations | 43,131 | (2,622) | (6,666) | 36,465 | (5,204) | ||||||
| Other | |||||||||||
| Other income (loss) | (6,879) | (3,012) | 189 | (6,690) | (1,451) | ||||||
| Finance items | |||||||||||
| Finance income (cost), net | (11,742) | 496 | 25 | (11,717) | 1,012 | ||||||
| Earnings (loss) before taxes | 24,510 | (5,138) | (6,452) | 18,058 | (5,643) | ||||||
| Income taxes expense (recovery) | 18,976 | – | – | 18,976 | – | ||||||
| Net earnings (loss) | $ | 5,534 | $ | (5,138) | $ | (6,452) | $ | (918) | $ | (5,643) | |
| Basic earnings per share | $ | 0.01 | $ | (0.01) | $ | (0.02) | $ | (0.00) | $ | (0.01) | |
| Diluted earnings per share | $ | 0.01 | $ | (0.01) | $ | (0.02) | $ | (0.00) | $ | (0.01) | |
| Weighted average number of common shares outstanding (in 000’s) | |||||||||||
| Basic | 735,616 | 397,570 | 401,122 | 569,293 | 396,771 | ||||||
| Diluted | 762,923 | 397,570 | 411,049 | 596,600 | 396,771 | ||||||
PORCUPINE OPERATIONS REVIEW
Discovery’s Porcupine Operations cover approximately 1,400 km2 in and near Timmins, Ontario. Porcupine consists of the Hoyle Pond, Pamour and Hollinger mine properties, the Dome mine property and milling facility, and numerous near-mine and regional exploration targets. The Complex also includes the Borden mine property and large land position near Chapleau, Ontario. Current operations include the Hoyle Pond and Borden underground mines, with the Pamour open-pit project currently ramping up towards commercial levels of production. All mineralization from the operating mines, and Pamour, is processed at Dome, including mineralization from Borden, which is trucked 190 km to the Dome Mill.
DOME MILL
The current Dome Mill was commissioned in 1988, with expansion projects being completed in 1995 and 2004. The mill consists of three-stage crushing, two parallel rod mill and ball mill circuits, a single leach and Carbon-in-Pulp circuit, followed by a carbon strip and electrowinning circuit. The Mill’s nameplate operating capacity is approximately 12,000 tonnes per day (approximately 4.3 million tonnes per annum). In recent years, the mill has operated at rates well below capacity levels, largely reflecting increased maintenance requirements which contributed to reduced availability and utilization rates, as well as production shortfalls from mining operations. Through investment programs launched following the closing of the Porcupine Acquisition, the Company is targeting a return to full capacity operations by 2028 or sooner.
| Three months ended | |||
| Dome Mill | June 30, 2025 | ||
| Total material milled (t) | 508,791 | ||
| Average Grade (g/t Au) | 3.39 | ||
| Recovery (%) | 91.3% | ||
| Gold produced (oz) | 50,552 | ||
| Gold poured (oz) | 46,608 | ||
| Gold sold (oz) | 42,550 | ||
| Milling operating costs ($ Millions) | $ | 12,861 | |
| Operating costs per tonne processed ($/tonne) | $ | 25.4 | |
For the period April 16, 2025, to June 30, 2025, a total of 508,791 tonnes were processed at Dome Mill at an average grade of 3.39 g/t, with recovery rates averaging 91.3%. A total of 50,552 ounces of gold were produced over this period, with total gold poured of 46,608 ounces. Availability rates at the Dome Mill during Q2 2025 were impacted by a two-week maintenance shutdown, previously scheduled by the prior owner, for the purpose of replacing equipment in the thickening tank. The Company used the occasion of the shutdown to advance multiple other projects, primarily in the crushing, grinding and carbon handling circuits. Based on operating days during Q2 2025, mill throughput averaged approximately 8,500 tonnes per day. Mill operating costs during Q2 2025 totaled $12.9 million for an average of $25.4 per tonne processed. These costs are allocated to the mine operations based on a proportion of total tonnes processed basis.
For the purpose of segment reporting, capital expenditures¹ for Dome Mill and the TMA are allocated to Hoyle Pond, Borden and Pamour based on a proportion of total tonnes processed basis. Capital expenditures allocated during Q2 2025 totaled $16.5 million. The majority of these capital expenditures related to the TMA, with work during the quarter largely focused on raising and buttressing the existing dam walls and constructing seepage collection systems.
HOYLE POND
Hoyle Pond Mine is an underground gold mining operation located within the Archean Abitibi Greenstone Belt approximately 20 km northeast of downtown Timmins, Ontario. Underground infrastructure includes two decline ramps, an 815-metre four-compartment shaft (“#1 Shaft”) and a 1,350 metre winze (the “#2 Winze”) with the deepest station being on the 1600-metre level. Underground production is trucked to the #2 Winze and is then hoisted to the 720 level, where it is sent by tram to the loading pocket of the #1 Shaft. Mineralization is then trucked approximately 17 km to Dome Mill. The mine began operations in 1985 and, since that time, has produced over 4.0 million ounces of gold.
| Three months ended | |||
| Hoyle Pond | June 30, 2025 | ||
| Total material milled (t) | 97,817 | ||
| Average Grade (g/t Au) | 5.50 | ||
| Gold Contained (oz) | 17,297 | ||
| Recovery (%) | 93.1% | ||
| Gold produced (oz) | 16,112 | ||
| Gold sold (oz) | 14,804 | ||
| Development metres – operating | 526 | ||
| Development metres – capital | 180 | ||
| Production costs | $ | 20,870 | |
| Operating cash costs per ounce sold1 | $ | 1,566 | |
| AISC per ounce sold1 | $ | 2,036 | |
| Total capital expenditures1 (in thousands) | $ | 7,597 | |
| (1) Example of Non-GAAP measure. See the section in this press release entitled, “NON-GAAP MEASURES” for more information. | |||
Gold production at Hoyle Pond from April 16, 2025, to June 30, 2025, totaled 16,112 ounces, which resulted from 97,817 tonnes being processed at an average grade of 5.50 g/t and average recoveries of 93.1%. Production during the quarter was primarily from the Lower S Zone on the 1965 and 1985 levels. A total of 45,160 tonnes were mined from April 16, 2025, to the end of Q2 2025, for an average mining rate of 594 tonnes per day. During Q2 2025, 52,657 tonnes of stockpiled material from Hoyle Pond were milled, which resulted in higher than planned tonnes milled for the quarter and a lower than expected average grade. The Company does not anticipate processing significant amounts of low-grade stockpiles from Hoyle Pond during the second half of 2025.
Operating development metres during Q2 2025 were mainly focused on the main production areas in the Lower S Zone, as well as in areas of the Upper Mine, where production from narrow, high-grade veins is expected to commence during the second half of 2025. Capital development activities during the quarter mainly involved continuing to extend the main ramp to depth in the Lower S Zone.
Production costs, including mining and processing costs, in Q2 2025 totaled $20.9 million, with operating cash costs averaging $1,566 per ounce sold¹. AISC¹ for the quarter averaged $2,036 per ounce sold, which included $5.7 million of sustaining capital expenditures¹, mainly related to capital development activities as well as Hoyle Pond’s allocation of capital expenditures¹ related to the TMA.
BORDEN
Borden Mine is a ramp access underground mine located on a 1,000 km2 land position approximately 20 km east of Chapleau, Ontario. The deposit mine is located within the lower limb of an antiform in the Borden Lake Greenstone Belt. Production at Borden commenced in 2019 and, to date, approximately 600,000 ounces have been produced. Mining is carried out at Borden using the longhole stoping method with unconsolidated as well as cemented rock fill. Material is trucked from underground to surface and then from the mine site approximately 190 km to the Dome Mill.
| Three months ended | |||
| Borden | June 30, 2025 | ||
| Total material milled (t) | 166,609 | ||
| Average Grade (g/t Au) | 5.62 | ||
| Gold Contained (oz) | 30,118 | ||
| Recovery (%) | 90.6% | ||
| Gold produced (oz) | 27,286 | ||
| Gold sold (oz) | 21,792 | ||
| Development metres – operating | 449 | ||
| Development metres – capital | 204 | ||
| Production costs | $ | 22,038 | |
| Operating cash costs per ounce sold1 | $ | 1,175 | |
| AISC per ounce sold1 | $ | 1,621 | |
| Total capital expenditures1 (in thousands) | $ | 11,697 | |
| (1) Example of Non-GAAP measure. See the section in this press release entitled, “NON-GAAP MEASURES” for more information. | |||
Gold production at Borden from April 16, 2025, to June 30, 2025, totaled 27,286 ounces, which resulted from 166,609 tonnes being processed at an average grade of 5.62 g/t and average recoveries of 90.6%. Production during Q2 2025 was mainly in the West and Central zones. A total of 123,743 tonnes of mineralization were mined from April 16, 2025, to the end of Q2 2025, for an average mining rate of 1,628 tonnes per day. Mining rates are expected to increase in the second half of 2025 as investments in new trucks and other equipment results in improved availability and utilization rates.
Operating development during the quarter was mainly focused on the West, Central and Upper East Zones, with capital development metres primarily related to the continued advancement of the main ramp and the exploration drift on the 575 level.
Production costs in Q2 2025 totaled $22.0 million, with operating cash costs per ounce¹ averaging $1,175 per ounce sold. AISC¹ averaged $1,621 per ounce sold for the quarter. Sustaining capital expenditures¹ totaled $9.0 million, with capital development accounting for $5.7 million and the remainder related to allocated TMA expenditures, as well as investments in infrastructure, including an upgrade of the slurry plant, and new equipment to optimize the mining fleet.
PAMOUR
Pamour mine, located approximately 20 km from downtown Timmins, first commenced underground mining in 1911 and was operated until 1996. Open-pit mining operations were initiated in 2006 and ceased in 2011. The project to re-develop and expand the Pamour open pit, and resume operations, commenced in 2023, with initial production achieved early in 2025 and project continuing to ramp up towards commercial production levels.
| Three months ended | |||
| Pamour | June 30, 2025 | ||
| Total material milled (t) | 244,366 | ||
| Average Grade (g/t Au) | 1.02 | ||
| Gold Contained (oz) | 7,976 | ||
| Recovery (%) | 89.7% | ||
| Gold produced (oz) | 7,154 | ||
| Gold sold (oz) | 6,051 | ||
| Production costs | $ | 12,011 | |
| Operating cash costs per ounce sold1 | $ | 2,051 | |
| AISC per ounce sold1 | $ | 2,194 | |
| Total capital expenditures1 (in thousands) | $ | 22,338 | |
| (1) Example of Non-GAAP measure. See the section in this press release entitled, “NON-GAAP MEASURES” for more information. | |||
Gold production at Pamour from April 16, 2025, to June 30, 2025, totaled 7,154 ounces, which resulted from 244,366 tonnes being processed at an average grade of 1.02 g/t and average recoveries of 89.7%. Significant pre-stripping continued during Q2 2025 as the mine continued development towards full production. A total of 104,000 tonnes of mineralization and 2.7 million tonnes of waste were mined from April 16, 2025, to June 30, 2025. Mill feed during Q2 2025 was mainly from Bench 19 of the Phase 1 Open Pit, with production from Bench 13 commencing late in the quarter. Mill feed from Pamour is expected to increase significantly in the second half of 2025, with the strip ratio expected to average below 10:1 during the final quarter of the year. In addition to mine production, 132,000 tonnes were processed from stockpiles in Q2 2025 at an average grade of 1.10 g/t for 4,650 ounces. The stockpiles processed included material from both Pamour as well as from the Hollinger open pit, where mining ceased late in 2024.
Production costs in Q2 2025 totaled $12.0 million. Operating cash costs¹ averaged $2,051 per ounce sold, while AISC¹ averaged $2,194 per ounce sold. All capital expenditures¹ at Pamour in Q2 2025 were growth capital expenditures¹ and related mainly to pre-stripping and allocated TMA capital expenditures.
(1) Example of Non-GAAP measure. See the section in this press release entitled, “NON-GAAP MEASURES” for more information.
CORDERO OVERVIEW
The Cordero Project was acquired by Discovery in 2019. Since that time, the Company has invested over a $100.0 million in Mexico, conducting significant exploration drilling and technical analysis, leading to the release of multiple studies, most recently the Feasibility Study (“FS”) dated February 16 2024 and filed on SEDAR+ (www.sedarplus.ca) on March 28, 2024. The results of the FS confirmed Cordero to be one of the world’s largest undeveloped silver deposits, with the potential for large-scale production at low unit costs and that is capable of generating substantial free cash flow and attractive economic returns.
Key highlights of the FS include:
Second Quarter 2025 Highlights
During Q2 2025, Discovery continued work on key initiatives to further de-risk the project, including:
(1) Example of Non-GAAP measure. See the section in this press release entitled, “NON-GAAP MEASURES” for more information.
OUTLOOK
With the closing of the Porcupine Acquisition on April 15, 2025, Discovery was transformed into a diversified North American-focused precious metals producer combining growing gold production in Northern Ontario, Canada, with one of the world’s largest silver development projects in Chihuahua State, Mexico. In Q2 2025, the Company commenced reporting gold production from the Hoyle Pond and Borden underground mines, as well as from the ramp up of gold production at the Pamour open-pit project.
Key priorities for the Porcupine Operations over the balance of 2025 include:
The Company is targeting a total of 140,000 metres of drilling in 2025. The goals for the drilling program include resource conversion at Hoyle Pond, Borden and Pamour, in support of establishing an initial reserve statement for the three mines during 2026. In addition, drilling will also target resource conversion at the Dome Mine as part of a study to update the Inferred Mineral Resource included in the technical report filed on SEDAR+ on January 28, 2025 entitled, “Porcupine Complex, Ontario, Canada, Technical Report on Preliminary Economic Assessment.” The Company is also planning a drill program at the TVZ Zone with a goal of releasing an initial mineral resource in the first half of 2026.
As of the date of this press release, the Company is well capitalized to fund growth and optimization plans for Porcupine and current expenditure plans at Cordero with total cash of approximately $279.0 million.
In Mexico, following release of the Cordero FS, the Company has conducted a limited work program aimed at further advancing and de-risking the Project, with key areas of focus being power, water availability and management, permitting, and continuation of ESG and community outreach programs.
Following the completion of the land acquisition program in March 2025, the next major milestone for the Cordero will be approval of the Company’s Environmental Impact Assessment or MIA by SEMARNAT, which was submitted in August 2023. The MIA passed SEMARNAT’s legal review soon after its submission and was advanced for technical review. As of the date of this, the Company had completed the technical review process and was awaiting approval of the MIA. The Company remains confident that Cordero will receive MIA approval.
ABOUT DISCOVERY
Discovery is a growing North American-focused precious metals company. The Company has exposure to silver through its first asset, the 100%-owned Cordero project, one of the world’s largest undeveloped silver deposits, which is located close to infrastructure in a prolific mining belt in Chihuahua State, Mexico. On April 15, 2025, Discovery completed the acquisition of the Porcupine Complex from Newmont Corporation, transforming the Company into a new Canadian gold producer with multiple operations in one of the world’s most renowned gold camps in and near Timmins, Ontario. Discovery owns a dominant land position within the camp, with a large base of Mineral Resources remaining and substantial growth and exploration upside.
First Phosphate Corp. (CSE: PHOS) (OTCQX: FRSPF) (OTCQX ADR: FPH... READ MORE
Highlights: Hole NO-26-21a returned 11.37 m grading 4.92 g/t gold... READ MORE
Guanajuato Silver Company Ltd. (TSX-V:GSVR) (OTCQX:GSVRF) is pl... READ MORE
Falco Resources Ltd. (TSX-V:FPC) is pleased to announce the resul... READ MORE
TDG Gold Corp. (TSX-V: TDG) (OTCQX: TDGGF) is pleased to provide ... READ MORE


