


![]()
Alamos Gold Inc. (TSX:AGI) (NYSE:AGI) today reported results of the Base Case Life of Mine Plan completed on the Island Gold District operation, located in Ontario, Canada. The Base Case LOM Plan integrates Island Gold and Magino as one consolidated long-life operation that is expected to become one of the largest, lowest-cost, and most profitable gold mines in Canada. An Expansion Study is expected to be released in the fourth quarter of 2025 detailing the significant upside potential within the Island Gold District beyond the Base Case LOM Plan.
The Base Case LOM Plan has been updated to reflect the current costing environment, significant growth in Mineral Reserves at Island Gold, operating savings resulting from the use of a larger and more efficient Magino mill, and scope changes since the Phase 3+ Expansion Study, which was completed in 2022. The Base Case LOM Plan includes Mineral Reserves only at Island Gold and Magino. Both deposits have significant Measured, Indicated and Inferred Mineral Resources, which have not been factored into the Base Case LOM Plan and economic analysis. All amounts are in United States dollars, unless otherwise stated.
“The Base Case Plan for the Island Gold District outlines an attractive, long-life operation that is expected to become one of Canada’s largest, lowest-cost, and most profitable gold mines. This is a first look at an operation with significant upside potential which we expect to detail in an Expansion Study later this year. We expect this to include a larger Mineral Reserve through ongoing Mineral Resource conversion, and a potential further expansion up to 20,000 tonnes per day, supporting an even larger, more valuable, and profitable operation. Longer-term, we see excellent opportunities for that value to continue to grow through ongoing exploration success at Island Gold, and a number of emerging higher-grade regional targets that have the potential to support multiple sources of ore within an expanded mill,” said John A. McCluskey, President and Chief Executive Officer.
Base Case LOM Plan Highlights:
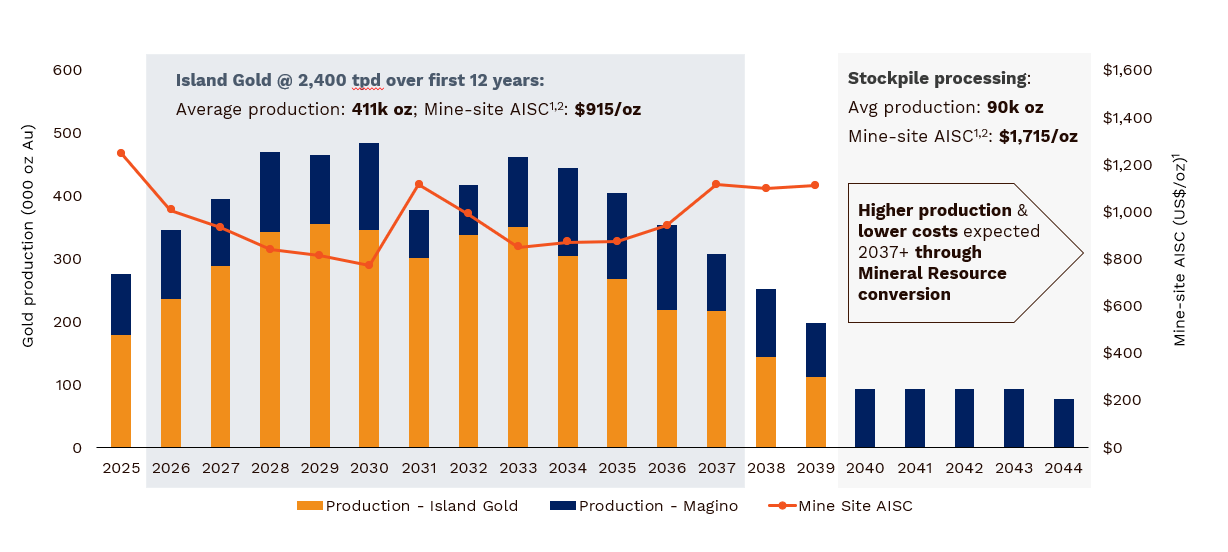
Average annual gold production of 411,000 ounces starting in 2026 and over the initial 12 years, a 43% increase from the mid-point of 2025 production guidance driven by the completion of the Phase 3+ Expansion
Low-cost structure: average mine-site all-in sustaining costs of $915 per ounce over the initial 12 years (2026+), a 19% decrease from the mid-point of 2025 guidance
Long-life operation supported by a large and growing Mineral Reserve base
Significant upside potential expected to be outlined in an Expansion Study in the fourth quarter of 2025
Low capital intensity
Attractive base case economics with significant upside
Phase 3+ Expansion expected to be completed during the second half of 2026
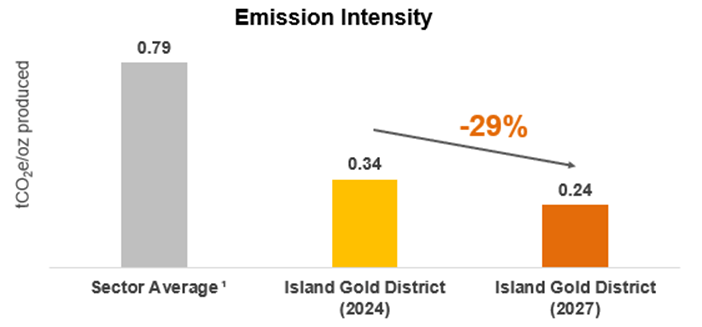
Low and decreasing Greenhouse Gas emission intensity
Fully funded growth: ongoing free cash flow with significant growth expected in 2026
| Base Case LOM Plan Highlights | |
| Production | |
| Mine life (years) | 20 |
| Phase 3+ Expansion completion date | H2 2026 |
| Total gold production (000 ounces) | 6,112 |
| Average annual gold production – 12-year average, 2026+ (000 ounces) | 411 |
| Average annual gold production – life of mine (000 ounces) | 306 |
| Total mill feed (000 tonnes) | 88,648 |
| Average mill throughput – 2027+ (tpd) | 12,400 |
| Average gold grade (g/t Au) | 2.23 |
| Average Island Gold ore throughput – 2027+ (tpd) | 2,400 |
| Average Island Gold ore grade milled (g/t Au) | 10.85 |
| Average Magino ore throughput (tpd) | 10,000 |
| Average Magino ore grade milled (g/t Au) | 0.91 |
| Average recovery (%) | 96.3% |
| Operating Costs | |
| Open pit mining cost (C$/tonne of total material mined) | $4.24 |
| Underground mining cost (C$/tonne of ore mined) | $124 |
| Processing cost (C$/tonne of ore milled) | $16.74 |
| G&A cost (C$/tonne of ore milled) | $13.73 |
| Total cash cost – 12-year average, 2026+ (per ounce sold)1,2 | $581 |
| Total cash cost – life of mine (per ounce sold)1,2 | $699 |
| Mine-site all-in sustaining cost – 12-year average, 2026+ (per ounce sold)1,2 | $915 |
| Mine-site all-in sustaining cost – life of mine (per ounce sold)1,2 | $1,003 |
| Capital Costs (millions) | |
| Growth capital expenditure | $453 |
| Sustaining capital expenditure5 | $1,808 |
| Total capital expenditure – life of mine | $2,261 |
| Total capital expenditure (per ounce sold) – life of mine2 | $380 |
| Total all-in cost (per ounce sold) – life of mine2,3 | $1,079 |
| Base Case Economic Analysis: $2,400 per ounce Gold Price (USD/CAD foreign exchange rate of $0.75:1)4 |
|
| NPV @ 0% discount rate (millions, after-tax) | $6,417 |
| NPV @ 5% discount rate (millions, after-tax) | $4,477 |
| Economic Analysis at $3,300 per ounce Gold Price (USD/CAD foreign exchange rate of $0.75:1) |
|
| NPV @ 0% discount rate (millions, after-tax) | $9,682 |
| NPV @ 5% discount rate (millions, after-tax) | $6,667 |
Prior Disclosure Regarding Island Gold Mine
As a result of a review by staff of the Ontario Securities Commission, the Company is providing the following corrective information regarding its disclosure with respect to the Island Gold Mine.
The 2025 Base Case Island Gold District Technical Report is being prepared and will be disclosed without the inclusion of Inferred Mineral Resources in economic analyses, including production schedules, mine life and cash flow models. The 2025 Base Case Island Gold District Technical Report will supersede any prior technical reports published by Alamos with respect to the Island Gold Mine.
Prior public disclosure regarding the Island Gold Mine included the use of Inferred Mineral Resources in economic analyses, including production schedules, mine life and cash flow models. Such disclosure was prohibited under paragraph 2.3(1)(b) of National Instrument 43-101 Standards of Disclosure for Mineral Projects (NI 43-101), which restricts public disclosure of the results of an economic analysis that includes or is based on Inferred Mineral Resources. In addition, NI 43-101 incorporates by reference the CIM Definition Standards (2014), which states that Inferred Mineral Resources must not be included in the economic analysis, production schedules, or estimated mine life in publicly disclosed prefeasibility or feasibility studies, or in the life of mine plans and cash flow models of developed mines. Inferred Mineral Resources are considered too speculative geologically to have economic considerations applied to them that would enable them to be categorized as Mineral Reserves and there can be no certainty that the results of an economic analysis including Inferred Mineral Resources would be realized.
Mineral Reserves and Resources
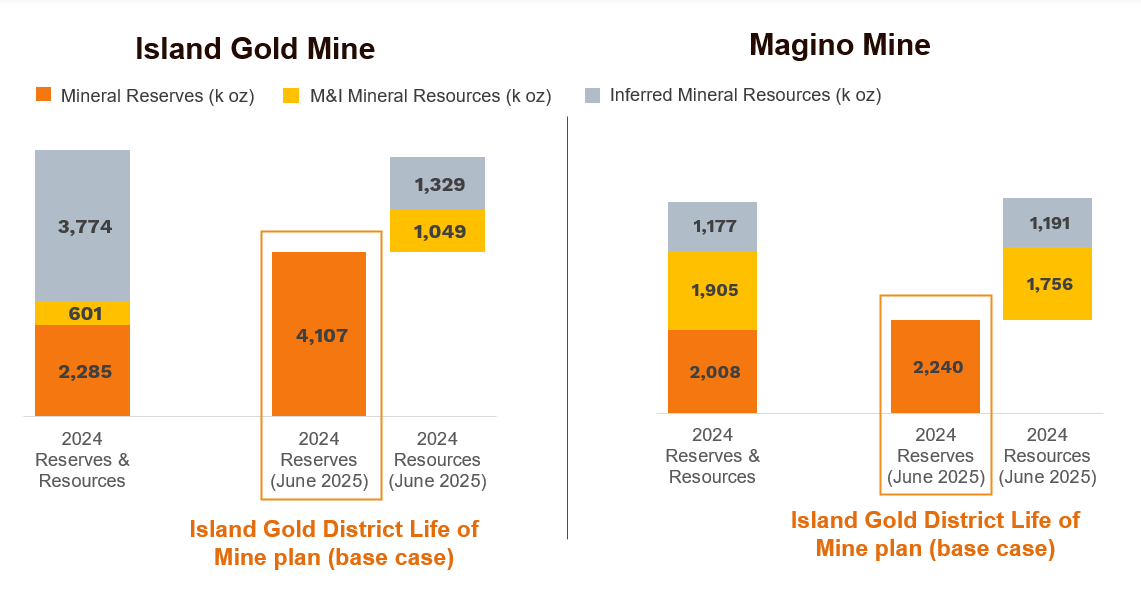
An updated Proven and Probable Mineral Reserve totaling 88.6 mt, grading 2.23 g/t Au, containing 6.3 million ounces of gold has been included in the Base Case LOM Plan. This represents a 48% increase from the 4.3 million ounces reported at the end of 2024, reflecting the conversion of Measured, Indicated and Inferred Mineral Resources at Island Gold and Magino. Only Mineral Reserves have been incorporated into the Base Case LOM plan and economic analysis.
Island Gold’s updated Mineral Reserve increased by 80% to 4.1 million ounces, driven by Mineral Resource conversion. An updated classification methodology has been adopted based on definition drilling, extensive historical and current production data, reconciliation, and underground mapping, which demonstrates that Indicated Mineral Resource continuity can be reliably established with an average drill spacing of 40 metres, versus 25 metres previously. This contributed to the conversion of a portion of the large Inferred Mineral Resource to Measured & Indicated Mineral Resources, which was subsequently converted to Mineral Reserves.
Mineral Reserves – Effective as of December 31, 2024
| Proven and Probable Gold Mineral Reserves | |||||||||
| June 2025 Update | February 2025 Update | % Change | |||||||
| Tonnes | Grade | Ounces | Tonnes | Grade | Ounces | Tonnes | Grade | Ounces | |
| (000’s) | (g/t Au) | (000’s) | (000’s) | (g/t Au) | (000’s) | (000’s) | (g/t Au) | (000’s) | |
| Island Gold | |||||||||
| Proven | 821 | 11.82 | 312 | 727 | 12.74 | 298 | 18% | -11% | 5% |
| Probable | 10,947 | 10.78 | 3,795 | 5,505 | 11.23 | 1,987 | 112% | -10% | 91% |
| Proven and Probable | 11,769 | 10.85 | 4,107 | 6,232 | 11.40 | 2,285 | 89% | -5% | 80% |
| Magino | |||||||||
| Proven | 22,163 | 0.88 | 626 | 19,684 | 0.89 | 561 | 13% | -1% | 12% |
| Probable | 54,710 | 0.92 | 1,613 | 48,715 | 0.92 | 1,447 | 12% | 0% | 11% |
| Proven and Probable | 76,873 | 0.91 | 2,240 | 68,400 | 0.91 | 2,008 | 12% | 0% | 12% |
| Island Gold District | |||||||||
| Proven | 22,984 | 1.27 | 938 | 20,411 | 1.31 | 859 | 13% | -4% | 9% |
| Probable | 65,657 | 2.56 | 5,408 | 54,220 | 1.97 | 3,434 | 22% | 28% | 57% |
| Proven and Probable | 88,642 | 2.23 | 6,347 | 74,632 | 1.79 | 4,293 | 19% | 25% | 48% |
Mineral Resources for Island Gold and Magino, as detailed below, have not been included in the Base Case LOM Plan and represent potential upside. A significant portion of Mineral Resources at Island Gold, and Measured and Indicated Mineral Resources at Magino, are expected to be converted to Reserves and incorporated into the Expansion Study to be released in the fourth quarter of 2025. The decrease in Inferred Mineral Resources at Island Gold reflects the conversion to Measured and Indicated Mineral Resources and Mineral Reserves.
The Mineral Resource conversion rate to Reserves at Island Gold continues to average more than 90%. This high rate of conversion is expected to continue based on ongoing success with the delineation drilling program.
Mineral Resources – Effective as of December 31, 2024
| Measured and Indicated Gold Mineral Resources (exclusive of Mineral Reserves) | |||||||||
| June 2025 Update | February 2025 Update | % Change | |||||||
| Tonnes | Grade | Ounces | Tonnes | Grade | Ounces | Tonnes | Grade | Ounces | |
| (000’s) | (g/t Au) | (000’s) | (000’s) | (g/t Au) | (000’s) | (000’s) | (g/t Au) | (000’s) | |
| Island Gold | |||||||||
| Measured | 470 | 14.66 | 222 | 235 | 10.96 | 83 | 100% | 34% | 167% |
| Indicated | 2,640 | 9.75 | 827 | 1,898 | 8.49 | 518 | 39% | 15% | 60% |
| Measured and Indicated | 3,110 | 10.49 | 1,049 | 2,113 | 8.76 | 601 | 47% | 20% | 75% |
| Magino | |||||||||
| Measured | 5,061 | 0.87 | 141 | 5,579 | 1.00 | 179 | -9% | -13% | -21% |
| Indicated | 55,209 | 0.91 | 1,615 | 57,110 | 0.94 | 1,726 | -3% | -3% | -6% |
| Measured and Indicated | 60,270 | 0.91 | 1,756 | 62,689 | 0.94 | 1,905 | -4% | -3% | -8% |
| Island Gold District | |||||||||
| Measured | 5,531 | 2.04 | 363 | 5,814 | 1.40 | 262 | -5% | 46% | 39% |
| Indicated | 57,849 | 1.31 | 2442 | 59,008 | 1.18 | 2,244 | -2% | 11% | 9% |
| Measured and indicated | 63,380 | 1.38 | 2,805 | 64,802 | 1.20 | 2,506 | -2% | 14% | 12% |
| Inferred Gold Mineral Resources (exclusive of Mineral Reserves) | |||||||||
| Island Gold | 2,449 | 16.88 | 1,329 | 7,106 | 16.52 | 3,774 | -66% | 2% | -65% |
| Magino | 40,291 | 0.92 | 1,191 | 40,383 | 0.91 | 1,177 | 0% | 1% | 1% |
| Island Gold District | 42,740 | 1.83 | 2,520 | 47,489 | 3.24 | 4,951 | -10% | -44% | -49% |
Economic Analysis
The Base Case LOM Plan has an estimated base case after-tax NPV (5%) of $4.5 billion assuming a long-term gold price of $2,400 per ounce and USD/CAD foreign exchange rate of $0.75:1.
Assuming a $3,300 per ounce gold price, the after-tax NPV (5%) increases to $6.7 billion. The mine plan, operating parameters and capital estimates incorporated in the Base Case LOM Plan are effective as the first quarter of 2025. The project economics are sensitive to metal price assumptions and input costs as detailed in the tables below.
Island Gold District: Base Case LOM Plan After-Tax NPV (5%) Sensitivity ($ Millions)
| -10% | -5% | Base Case | 5% | 10% | |
| Gold Price | $3,337 | $3,897 | $4,477 | $5,080 | $5,704 |
| Canadian Dollar | $4,752 | $4,616 | $4,477 | $4,339 | $4,198 |
| Capital Costs | $4,552 | $4,514 | $4,477 | $4,440 | $4,403 |
| Operating Costs | $4,722 | $4,600 | $4,477 | $4,355 | $4,232 |
Island Gold District: Base Case LOM Plan After-Tax NPV (5%) Sensitivity to Gold Price
| Gold Price ($/oz) | After-Tax NPV5% ($M) |
| $2,000 | $2,942 |
| $2,400 (Base Case1) | $4,477 |
| $2,750 | $5,098 |
| $3,000 | $5,811 |
| $3,300 | $6,667 |
| $3,500 | $7,236 |
Base Case LOM Plan Overview
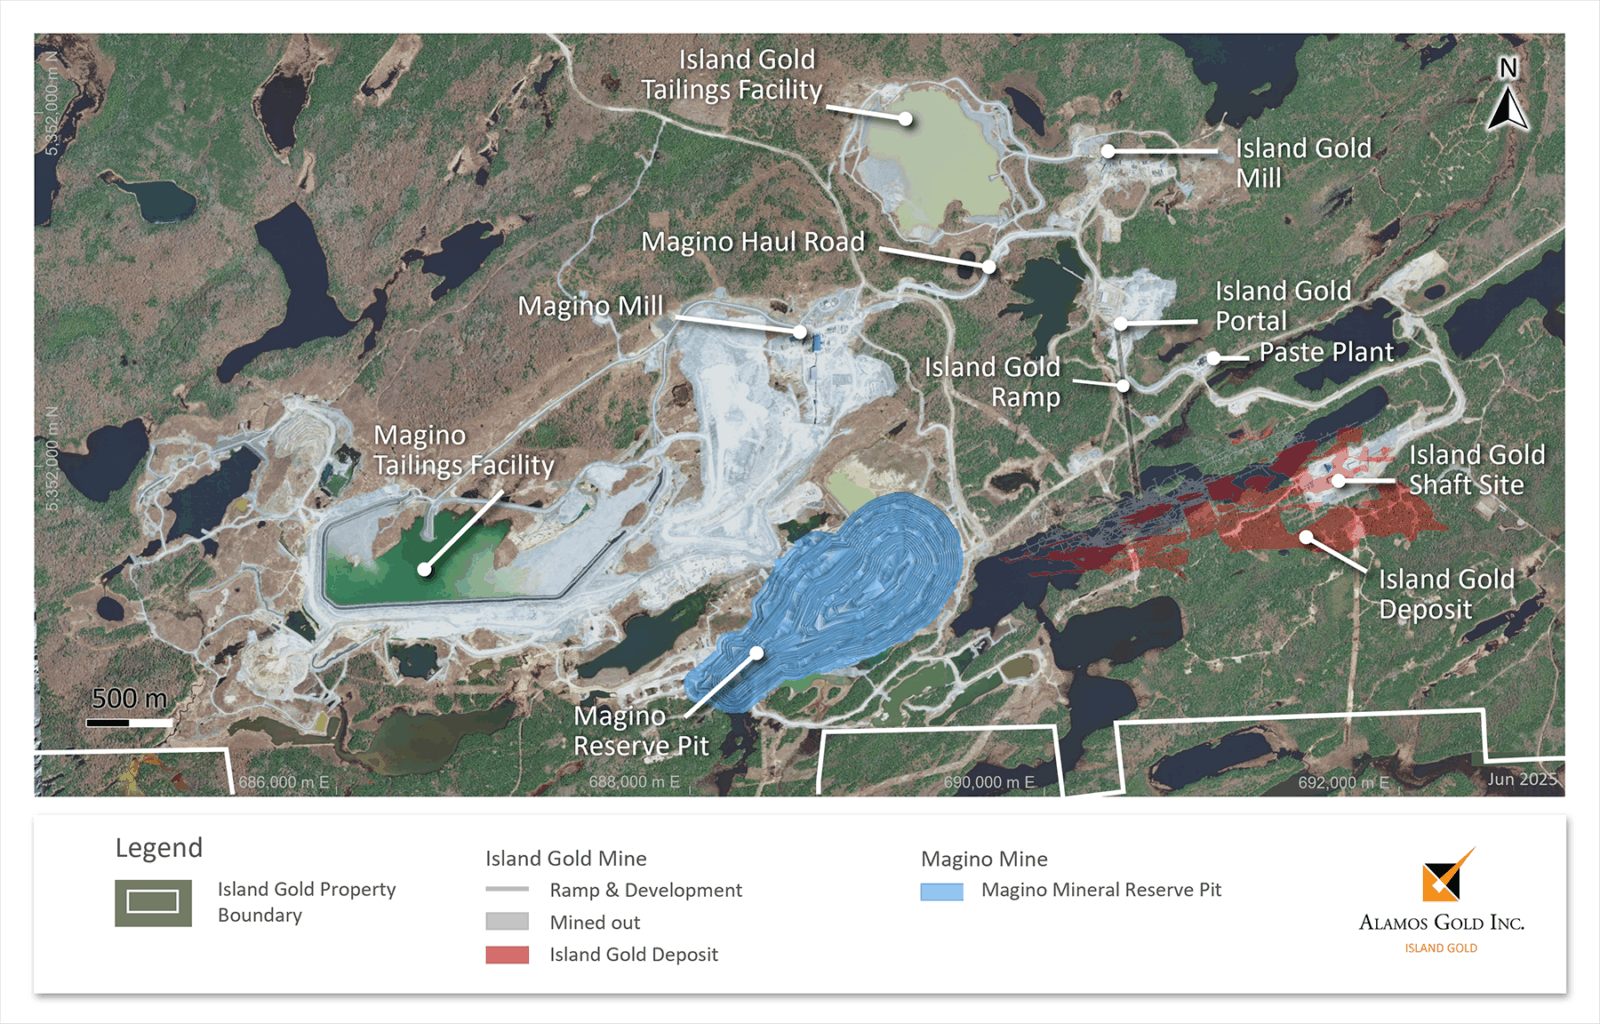
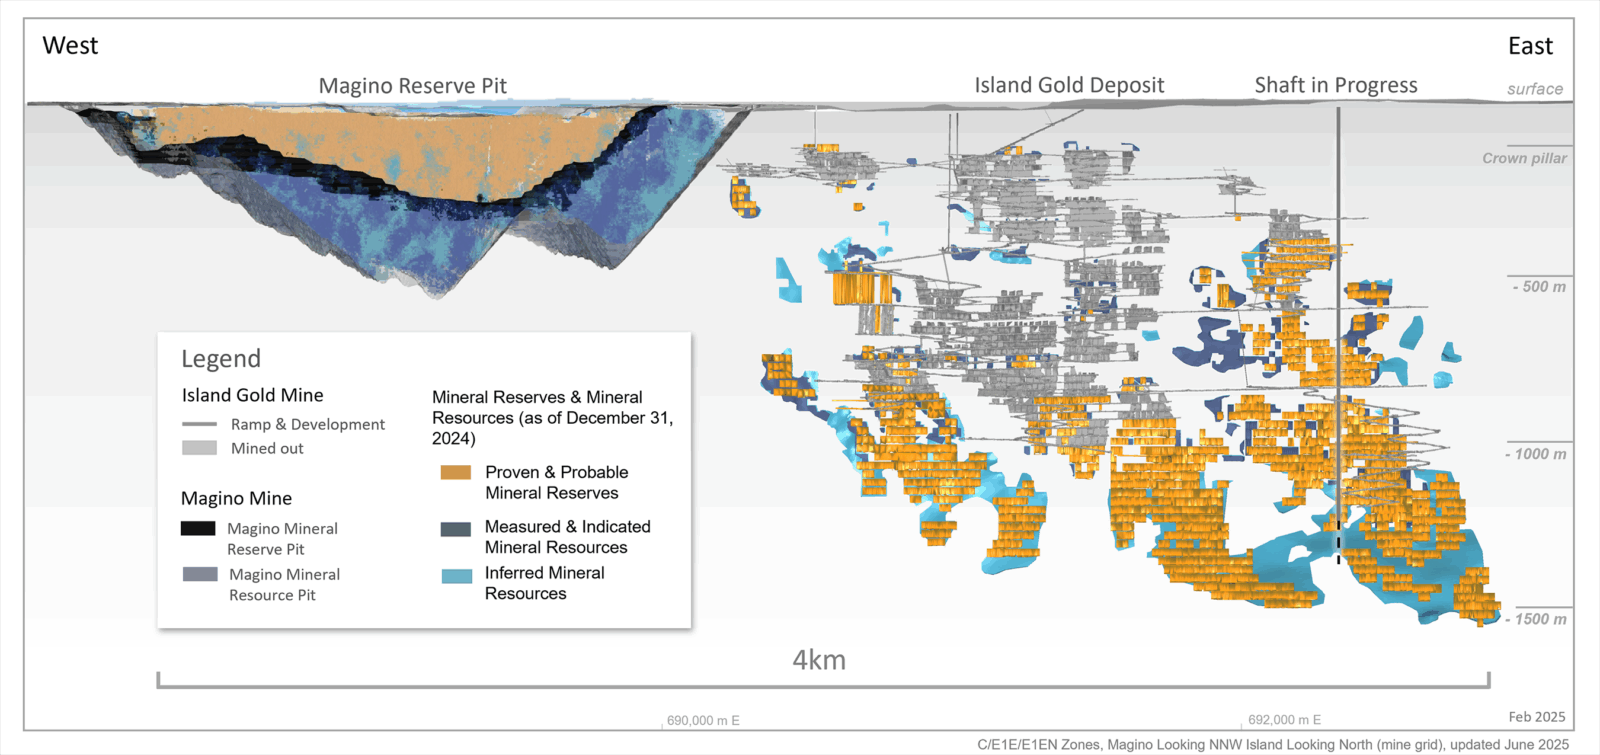
The Island Gold District is comprised of the Island Gold underground mine and the Magino open pit mine. Both operations will utilize the centralized Magino mill for processing ore and the Magino tailings management facility for tailings storage.
Underground ore from Island Gold is currently being processed through the Island Gold mill. During the third quarter of 2025, the Company expects to shut down the Island Gold mill and transition to processing both Island Gold and Magino ore through the Magino mill at a rate of approximately 11,200 tpd.
The Phase 3+ Expansion of Island Gold is expected to double underground mining rates to 2,400 tpd through the addition of a shaft and paste plant. Following completion of the expansion in 2026, underground mining will transition from trucking ore and waste to skipping ore and waste to surface, through the new shaft infrastructure. This is expected to drive production higher and costs significantly lower. The Magino mill will be expanded to 12,400 tpd to accommodate the increased production rates from Island Gold of 2,400 tpd, with the remaining 10,000 tpd coming from the Magino open pit.
The Phase 3+ Expansion is expected to be completed during the second half of 2026, a slight delay from initial guidance of the first half of 2026 in the Phase 3+ Study, though this is not expected to impact current production and cost guidance for the Island Gold District in 2026 and 2027.
Base Case LOM Production and Mine-site AISC Profile
Phase 3+ Expansion Significantly De-Risked
The Phase 3+ Expansion of Island Gold underground has been significantly de-risked given the progress achieved to date, with details as follows:
Mining
Island Gold underground
Longitudinal long-hole open stoping will continue to be utilized as the primary mining method with the completion of the shaft and paste plant supporting the increase in mining rates to 2,400 tpd. Given the ongoing growth of the ore body, and as mining progresses deeper, a more geotechnically sound approach will be employed across the stope sequence with mining moving from the centre towards sill extremities (versus from the sill extremities towards the centre currently). The new approach will require increased underground development which will support an improved geotechnical mining sequence and a better managed stress environment, as well as potential increased mining rates of greater than 2,400 tpd as part of a longer-term expansion scenario.
Magino open pit
The Magino open pit will continue to be mined with a conventional shovel-truck methodology. Total mining rates of ore and waste are expected to average 66,400 tpd. Mining rates of ore are expected to average 14,100 tpd over the initial 14 years, with 10,000 tpd to be processed through the Magino mill, and the remaining lower grade ore to be stockpiled for processing at the end of the mine life. The waste to ore ratio mined over the life of mine is expected to average 3.7:1.
Shaft
The main components of the shaft infrastructure are unchanged from the Phase 3+ Study with the exception of the crushing facility, which will be installed underground rather than at surface. This change optimizes the flow of ore handling from underground to the mill and reduces the maintenance required for the hoisting system.
A 5.0 metre diameter concrete lined shaft is being constructed with a steel head frame. The skip size has been increased from 12 tonnes in the Phase 3+ Study to 15 tonnes, which will increase the hoisting capacity to 5,500 tpd at the current planned depth of 1,379 metres. This has increased from 4,500 tpd in the Phase 3+ Study and is more than sufficient to accommodate peak mining rates of 4,300 tpd (ore & waste). The shaft will have dedicated compartments for ore and waste movement, and a double-deck service cage for the transport of personnel and materials. The hoisting plant is designed for an ultimate depth of 2,000 metres providing flexibility to accommodate future exploration success.
The underground ore and waste handling and loading pocket will be a conventional configuration similar to that at Young-Davidson. Once skipped to surface, crushed ore will be trucked to the expanded Magino mill.
Paste plant
As outlined in the Phase 3+ Study, a paste plant and underground paste distribution system is being constructed. This will allow for faster stope cycling, thereby supporting higher underground mining rates and providing increased geotechnical stability. It will also increase mining recovery resulting in an additional 140,000 ounces of gold recovered over the life of mine. Further, 65% of tailings will be placed underground reducing tailings dam raise requirements over the mine life.
Mobile fleet – Island Gold
Underground mining rates are expected to ramp up from current rates of 1,200 to 1,400 tpd by the end of 2025. Mining rates are expected to further increase to design rates of 2,400 tpd by the end of 2026, driven by the completion of the Phase 3+ Expansion. This will be supported by a significantly smaller truck fleet than required under the current ramp operation.
Post completion of the shaft, a total of seven haul trucks will be required to support a mining rate of 2,400 tpd, compared to a peak of 20 haul trucks required to sustain ramp haulage at 1,200 tpd. This will contribute to the lower ventilation requirements, significantly lower diesel usage, and lower costs given the productivity improvements and economies of scale.
Mobile fleet – Magino
The fleet at Magino consists of 15 haul trucks with a payload capacity of 139 tonnes, combined with three diesel powered hydraulic shovels and one excavator, supported by three front-end loaders. The current mobile fleet can support peak mining rates of 74,000 tpd of ore and waste.
Decreasing GHG emission intensity
The completion of the Phase 3+ Expansion is expected to reduce the Island Gold District GHG emissions intensity from already low levels. In 2024, the Island Gold District emission intensity was 57% lower than the industry average. The transition to a shaft operation from hauling ore to surface, and fully connecting the Magino mill to the electric grid, is expected to drive a further 29% decrease in GHG emissions per ounce produced. This will represent an emission intensity 70% lower than the industry average.
Processing and Infrastructure
The Base Case LOM Plan reflects the use of the larger centralized mill and tailings facility at Magino. With ore from Island Gold underground to be processed at lower operating costs through the larger Magino mill starting in 2025, the current Island Gold mill and tailings facility will no longer be required.
Current Magino Mill Design
The Magino mill includes a crushing circuit that consists of a primary jaw crusher and a secondary cone crusher followed by a semi-autogenous (SAG) mill and ball mill. A cyclone separates the feed sending it to either a gravity circuit where course gold is removed or pumped to the leach circuit where it is thickened and oxygen, lime and cyanide are added for cyanidation. The carbon-in-pulp (CIP) circuit recovers the dissolved gold from the leached slurry.
The gravity concentrate is processed via an intensive leach reactor. Loaded carbon is acid washed and then undergoes carbon stripping to recover the gold through electrowinning and smelting with the final product being gold doré.
Two successful batch tests of Island Gold ore through the Magino mill were completed in the third quarter of 2024 and April 2025. In both instances, Island Gold ore was blended with Magino ore and processed through the Magino mill with recoveries in line with expectations. With the successful batch tests, and the Magino mill continuing to ramp up towards 11,200 tpd, the Company expects to transition to processing Island Gold ore through the Magino mill in the third quarter of 2025.
The mill feed is based on a 9:1 blend ratio of Magino and Island Gold ore at a combined throughput of 11,200 tpd. Island Gold ore feed will start at 1,200 tpd, increasing to 1,400 tpd by the end of 2025. Magino ore feed will fluctuate between 9,200 tpd and 10,000 tpd. The overall gold recovery from the blend is expected to be approximately 96%.
Expansion to 12,400 tpd
To accommodate the increased underground mining rates from Island Gold of 2,400 tpd following completion of the Phase 3+ Expansion in 2026, a number of improvements will be implemented to support increased milling rates within the Magino mill of 12,400 tpd. Many of the changes are being designed and sized to accommodate a potential further expansion of the mill to between 18,000 and 20,000 tpd. The key additions include:
Ore from Island Gold underground will be hauled to the Magino mill on the recently completed 6.5 kilometre road connecting the shaft area to the Magino mill. The ore feed blend will include 2,400 tpd of underground ore and 10,000 tpd of open pit ore with overall recoveries from the expanded circuit expected to average 96.3%.
The expansion of the Magino mill is expected to be completed in the third quarter of 2026 to coincide with the completion of the Phase 3+ Expansion at Island Gold.
Tailings
The existing TMF at Magino will be utilized, with the Base Case LOM Plan requiring 81 mt of capacity. Under the Base Case plan, the TMF will be expanded in multiple stages using lifts. With a permitted capacity of 150 Mt under the Federal EIS, the Magino TMF is expected to have more than sufficient capacity to accommodate the Base Case LOM plan, as well as the Mineral Resource conversion that is expected to be incorporated a larger expansion of up to 20,000 tpd.
Operating Costs
Total cash costs are expected to average $699 per ounce and mine-site AISC $1,003 per ounce over the mine life. Post completion of the Phase 3+ Expansion (2026+) and over the initial 12 years that Island Gold underground is operating at 2,400 tpd, total cash costs are expected to average $581 per ounce and mine-site AISC averaging $915 per ounce. This represents a 23% and 19% decrease, respectively, from the mid-point of 2025 guidance reflecting the significant productivity improvements, increased automation, and higher throughput rates with a shaft-hoisting operation, as well as lower processing costs for Island Gold underground ore. Additionally, the Magino mill will benefit from lower-cost grid power following the completion of the 115kV power line project in 2026.
Over the life of mine, open pit mining costs are expected to average C$4.24 per tonne of material mined, and underground mining costs C$124 per tonne mined. The shaft will allow for unit underground mining costs to remain relatively stable as mining moves deeper compared to truck haulage where costs would continue to increase with depth. This will help ensure Island Gold remains one of the lowest cost mines in the world over the long-term.
Milling costs are expected to average C$16.74 per tonne, with Island Gold underground ore to be processed at lower costs using the Magino mill. Connecting the Magino mill to grid power in 2026 is expected to reduce long-term processing costs by approximately C$5 per tonne. This reduction in costs has been included in the current Base Case LOM Plan.
The breakdown of unit costs is summarized as follows.
| (in C$/tonne) | Base Case LOM1 as of Jan 1 2025 |
| Open Pit Mining (ore + waste) | $4.24 |
| Underground Mining (ore) | $124 |
| Milling (ore) | $16.74 |
| Admin (ore) | $13.73 |
| Total Cash Cost (US$/oz)2 – Average LOM |
$699 |
| – 12-year average, 2026+ | $581 |
| Mine-site All-in Sustaining Costs (US$/oz)2 – Average LOM |
$1,003 |
| – 12-year average, 2026+ | $915 |
Royalty
Production from both Island Gold and Magino are subject to third party net smelter return royalties. At Island Gold, the total effective NSR royalty averages approximately 2.5% over the life of mine, based on ounces produced, with approximately 90% of this royalty paid in-kind (as ounces).
Magino is subject to a total effective NSR royalty averaging approximately 3.8% over the mine life based on ounces produced, with 3.0% paid in-kind (as ounces).
The accounting treatment requires that in-kind royalties be recorded at production cost which lowers royalty expense, with an offsetting reduction in revenue given in-kind ounces transferred to royalty holders do not meet the definition of sales. As a result, the average NSR included in the LOM for Island Gold is approximately 0.8% of revenue over the life of mine, and 2.2% of revenue for Magino over the life of mine.
There is no net impact on gross margin from the accounting for in-kind NSR royalties compared to cash-paid NSR royalties given the lower royalty expense is offset by a reduction in ounces sold.
Capital Costs
Total growth capital is estimated at $453 million (as of January 1, 2025), with the majority to be spent over the next two years. Growth capital is focused on completing the Phase 3+ Expansion and the Magino mill expansion to 12,400 tpd.
As of the end of 2024, $486 million had been spent on the Phase 3+ Expansion. Remaining growth capital on the Phase 3+ Expansion is expected to total $349 million bringing total expected capital for the expansion to $835 million. This represents a 5% increase from the updated total growth capital estimate of $796 million provided in September 2024. The increase reflects ongoing labour inflation, as well as the use of a contractor to support off shaft development, and construction activities related to the ore and waste handling system for a total increase of approximately $39 million.
The addition of a pebble crusher and auxiliary mill to the Magino mill to support 12,400 tpd represents a potential scope change at an additional cost of approximately $40 million. These component changes will be re-evaluated over the next several months to assess if they will be required as part of a potential larger expansion of up to 20,000 tpd. This evaluation process will be completed before finalizing a decision and committing capital.
The other key difference between Island Gold District remaining growth capital and the Phase 3+ Expansion is the addition of a truck shop at Magino at a cost of $28 million. This will support improved maintenance practices of the open pit mobile fleet and increased utilization rates. The construction of a truck shop had been deferred by the previous owner.
| Island Gold District: Growth Capital (in US$ millions) |
Base Case LOM1 as of Jan 1 2025 |
| Remaining Phase 3+ Expansion Capital | $349 |
| Magino Mill – Pebble Crusher & Auxiliary mill | $40 |
| Magino Open Pit Truck Shop | $28 |
| Other | $36 |
| Total Growth Capital ($ million) | $453 |
| Total Growth Capital per ounce sold (US$/oz)2 | $76 |
Sustaining capital is expected to total $1,808 million over the life of mine, including reclamation costs and capital leases. The key increases relative to the Phase 3+ Study reflect the addition of the Magino operation, as well as increased underground development at Island Gold. As noted above, increased development will support a better managed stress environment as the ore body continues to grow and mining extends deeper, while also allowing for higher mining rates beyond 2,400 tpd, which is being reviewed as part of the Expansion Study.
Sustaining capital per ounce is expected to decrease within the Expansion Study reflecting the potential inclusion of a larger Mineral Reserve, through ongoing Resource conversion, which will leverage infrastructure being constructed to support the Base Case operation.
| Island Gold District: Sustaining Capital (in US$ millions) |
Base Case LOM1 as of Jan 1 2025 |
| Underground Capital Development | $691 |
| Open Pit Mobile Equipment and Maintenance | $295 |
| Open Pit Capitalized Stripping | $241 |
| Underground Mobile Equipment and Maintenance | $159 |
| Underground Infrastructure | $152 |
| Tailings Facility | $114 |
| Mill Maintenance | $37 |
| Other | $28 |
| Total Sustaining Capital | $1,715 |
| Reclamation | $46 |
| Total (including Reclamation) | $1,761 |
| Capital Leases | $46 |
| Total (including Reclamation and Capital Leases) | $1,808 |
| Total Sustaining Capital per ounce sold (US$/oz)2 | $304 |
Combined growth and sustaining capital are expected to total $2.26 billion over the life of mine, or $380 per ounce sold.
Including operating costs and total capital, the all-in cost is expected to total $1,079 per ounce sold over the life of mine.
A breakdown of the capital requirements for the Base Case Life of Mine Plan is detailed as follows.
| Island Gold District: Total Capital (in US$ millions) |
Base Case LOM1 as of Jan 1 2025 |
| Growth capital | $453 |
| Sustaining capital | $1,808 |
| Total Capital | $2,261 |
| Total Capital per ounce sold (US$/oz)2 | $380 |
Taxes
At current gold prices of approximately $3,300 per ounce and taking into account existing income tax pools of approximately C$2 billion, the Island Gold District is not expected to pay any significant taxes until 2026. At a long-term gold price of $2,400 and USD/CAD foreign exchange rate of $0.75:1, the Island Gold District is expected to pay approximately $2.2 billion in federal and provincial income taxes and Ontario mining taxes over the life of the mine. The effective tax rate is expected to average approximately 25% reflecting the use of the substantial tax pools.
Permitting
The Island Gold District has all the key permits in place for the current operation, with normal course permits required for further expansions of the operation. The Closure Plan Amendment for the Island Gold mine was received in March 2022 allowing for the ramp up of construction activities for the original Phase III expansion to 2,000 tpd. In December 2023, another CPA was approved that incorporated scope changes in the Phase 3+ Expansion to operate at 2,400 tpd.
The CPA for the Magino mine was approved in September 2024. Under the approved Federal Environmental Impact Statement, the Magino mill is permitted to operate at a processing rate of 35,000 tpd, well above the current rates. The TMF at Magino is permitted under the Federal EIS to contain up to 150 mt of material. This is more than sufficient tailings capacity for the Base Case LOM Plan as well as the expected larger Mineral Reserve to be incorporated in the Expansion Study.
For the expansion to 12,400 tpd, there are a number of normal course provincial permits that will be required including an amendment to the Environmental Compliance Approval. The ECA will also need to be amended for any potential further expansion up to 20,000 tpd as will the CPA. These are permit amendments that have been approved multiple times previously. All permitting activities fall within a well known jurisdiction where Alamos has successfully operated for years, achieving various permitting milestones at both of its Young-Davidson and Island Gold mines.
Upside to Base Case LOM Plan:
Expansion Study expected to be released in the fourth quarter of 2025
The Base Case LOM Plan is based only on Mineral Reserves and long-term milling rates of 12,400 tpd. The Expansion Study to be released in the fourth quarter of 2025 is expected to demonstrate attractive economics and significant upside to the Base Case with the key drivers as follows:
Key elements of a larger expansion have been de-risked, including:
Significant exploration upside
The Island Gold District remains highly prospective, with significant exploration upside that can support further potential growth over the longer term, including:
Technical Disclosure
Chris Bostwick, FAusIMM, Alamos Gold’s Senior Vice President, Technical Services, has reviewed and approved the scientific and technical information contained in this news release. Mr. Bostwick is a Qualified Person within the meaning of Canadian Securities Administrator’s National Instrument 43-101.
The Company will file a technical report prepared in accordance with NI 43-101 on SEDAR+ at www.sedarplus.ca within 45 days of the date of this release.
About Alamos
Alamos is a Canadian-based intermediate gold producer with diversified production from three operations in North America. This includes the Island Gold District and Young-Davidson mine in northern Ontario, Canada, and the Mulatos District in Sonora State, Mexico. Additionally, the Company has a strong portfolio of growth projects, including the Phase 3+ Expansion at Island Gold, and the Lynn Lake project in Manitoba, Canada. Alamos employs more than 2,400 people and is committed to the highest standards of sustainable development. The Company’s shares are traded on the TSX and NYSE under the symbol “AGI”.
Table 1: Base Case Life of Mine Plan – Detailed Summary
| LOM avg | 2025 | 2026 | 2027 | 2028 | 2029 | 2030 | 2031 | 2032 | 2033 | 2034 | 2035 | 2036 | 2037 | 2038 | 2039 | 2040 | 2041 | 2042 | 2043 | 2044 | |
| Underground ore mined (tpd) | 2,148 | 1,319 | 1,914 | 2,405 | 2,399 | 2,400 | 2,400 | 2,400 | 2,399 | 2,400 | 2,400 | 2,400 | 2,353 | 2,304 | 1,713 | 1,018 | – | – | – | – | – |
| Open pit ore mined (tpd) | 13,238 | 14,545 | 23,437 | 21,030 | 15,462 | 17,227 | 14,697 | 2,577 | 4,233 | 10,234 | 14,893 | 20,253 | 16,209 | 7,307 | 15,347 | 1,112 | – | – | – | – | – |
| Open pit total tonnes mined(tpd) | 62,152 | 56,891 | 64,635 | 72,337 | 73,566 | 73,767 | 73,767 | 66,344 | 67,826 | 63,932 | 63,932 | 63,932 | 63,757 | 61,238 | 63,932 | 2,428 | – | – | – | – | – |
| Underground ore processed (tpd) | 2,149 | 1,332 | 1,914 | 2,405 | 2,399 | 2,400 | 2,400 | 2,400 | 2,399 | 2,400 | 2,400 | 2,400 | 2,353 | 2,304 | 1,713 | 1,021 | – | – | – | – | – |
| Open pit ore processed (tpd) | 10,523 | 9,106 | 9,286 | 9,995 | 10,001 | 10,000 | 10,000 | 10,000 | 10,001 | 10,000 | 10,000 | 10,000 | 10,047 | 10,096 | 10,687 | 11,379 | 12,400 | 12,400 | 12,400 | 12,400 | 10,270 |
| Total ore processed (tpd) | 12,135 | 10,437 | 11,200 | 12,400 | 12,400 | 12,400 | 12,400 | 12,400 | 12,400 | 12,400 | 12,400 | 12,400 | 12,400 | 12,400 | 12,400 | 12,400 | 12,400 | 12,400 | 12,400 | 12,400 | 10,270 |
| Underground grade processed (g/t Au) | 10.85 | 11.69 | 10.85 | 10.69 | 12.41 | 12.88 | 12.54 | 10.97 | 12.24 | 12.69 | 11.09 | 9.76 | 8.14 | 8.25 | 7.41 | 9.66 | – | – | – | – | – |
| Open pit grade processed (g/t Au) | 0.91 | 0.95 | 1.08 | 0.96 | 1.14 | 1.00 | 1.24 | 0.70 | 0.72 | 1.01 | 1.25 | 1.23 | 1.20 | 0.83 | 0.91 | 0.70 | 0.69 | 0.69 | 0.69 | 0.69 | 0.69 |
| Processed grade – combined (g/t Au) | 2.23 | 2.32 | 2.75 | 2.85 | 3.32 | 3.30 | 3.43 | 2.69 | 2.95 | 3.27 | 3.16 | 2.88 | 2.51 | 2.21 | 1.81 | 1.44 | 0.69 | 0.69 | 0.69 | 0.69 | 0.69 |
| Gold production (oz) | 305,594 | 275,543 | 346,845 | 395,237 | 470,515 | 465,891 | 484,729 | 378,076 | 417,249 | 462,468 | 445,407 | 405,498 | 353,437 | 308,278 | 251,656 | 198,996 | 93,373 | 93,118 | 93,118 | 93,118 | 79,332 |
| Gold sales (oz)1 | 297,739 | 264,935 | 338,814 | 385,348 | 459,343 | 455,847 | 472,938 | 368,765 | 406,887 | 450,538 | 434,523 | 395,788 | 344,790 | 300,564 | 244,949 | 194,186 | 90,572 | 90,324 | 90,324 | 90,324 | 75,012 |
| Operating costs | |||||||||||||||||||||
| Underground mining costs (C$/tonne) | $124 | $166 | $133 | $116 | $117 | $116 | $117 | $119 | $122 | $122 | $122 | $124 | $128 | $134 | $137 | $85 | – | – | – | – | – |
| Open pit mining costs (C$/tonne) | $4.24 | $5.84 | $3.98 | $3.72 | $3.91 | $3.86 | $3.91 | $4.13 | $3.93 | $4.16 | $4.31 | $4.40 | $4.38 | $3.93 | $4.02 | $38.99 | – | – | – | – | – |
| Unit milling costs (C$/tonne) | $16.74 | $24.66 | $20.70 | $16.96 | $16.96 | $16.96 | $16.96 | $16.96 | $16.96 | $16.96 | $16.96 | $16.96 | $16.91 | $16.86 | $16.25 | $15.55 | $14.50 | $14.50 | $14.50 | $14.50 | $14.50 |
| Unit G&A costs (C$/tonne) | $13.73 | $20.25 | $14.47 | $13.84 | $13.79 | $13.61 | $13.89 | $13.20 | $13.70 | $14.15 | $14.11 | $15.41 | $16.07 | $17.64 | $17.66 | $14.14 | $11.96 | $10.95 | $9.31 | $7.61 | $9.09 |
| Total cash costs(US$/oz)2 | $699 | $886 | $626 | $523 | $469 | $516 | $451 | $624 | $586 | $582 | $568 | $587 | $698 | $888 | $966 | $999 | $1,696 | $1,649 | $1,584 | $1,520 | $1,590 |
| Mine-site AISC (US$/oz)2,3 | $1,003 | $1,247 | $1,006 | $933 | $842 | $814 | $773 | $1,116 | $990 | $850 | $871 | $875 | $941 | $1,117 | $1,098 | $1,114 | $1,742 | $1,724 | $1,649 | $1,551 | $1,950 |
| Capital expenditures | LOMtotal | ||||||||||||||||||||
| Sustaining capex (US$M) | $1,761 | $79 | $117 | $150 | $169 | $135 | $152 | $181 | $163 | $120 | $130 | $113 | $83 | $68 | $32 | $22 | $4 | $7 | $6 | $3 | $27 |
| Sustaining capital leases (US$M) | $46 | $17 | $12 | $8 | $2 | $1 | $1 | $1 | $1 | $1 | $2 | $1 | $1 | $0 | $0 | $0 | $0 | – | – | – | – |
| Growth capex (US$M) | $453 | $302 | $139 | $12 | – | – | – | – | – | – | – | – | – | – | – | – | – | – | – | – | – |
| Total capex (US$M) | $2,261 | $398 | $268 | $170 | $171 | $136 | $152 | $181 | $164 | $121 | $132 | $114 | $84 | $69 | $32 | $22 | $4 | $7 | $6 | $3 | $27 |
Newcore Gold Ltd. (TSX-V: NCAU) (OTCQX: NCAUF) is pleased to anno... READ MORE
Group Eleven Resources Corp. (TSX-V: ZNG) (OTCQB: GRLVF) (FSE: 3G... READ MORE
Miata Metals Corp. (TSX-V: MMET) (FSE: 8NQ) (OTCQX: MMETF) is ple... READ MORE
GFG Resources Inc. (TSX-V: GFG) (OTCQB: GFGSF) is pleased to repo... READ MORE
After-Tax NPV of $375M and IRR of 39% ($3,600/oz gold) After-T... READ MORE


