


![]()
G Mining Ventures Corp. (TSX: GMIN) (OTCQX: GMINF) is pleased to announce the results of its Feasibility Study for the development of its wholly-owned Oko West Gold Project, located in Region 7, Guyana. Unless otherwise stated, all dollar amounts in this news release are expressed in U.S. dollars.
The FS confirms robust economics for a low-cost, large-scale, conventional open pit and underground mining and milling operation, with industry-leading operating costs and high rate of return. The Study outlines total gold production of 4.3 million gold ounces over 12.3 years, resulting in an average annual gold production profile of 350,000 ounces with an All-In-Sustaining Cost per ounce of $1,123. The Project after-tax net present value (5% discount rate) is $2.2 billion with an after-tax internal rate of return of 27% at a gold price of $2,500 per ounce.
Final environmental permits are expected in Q2-25, with a targeted construction decision in H2-25. The Project is ideally sequenced to leverage the strong macroeconomic conditions including a strong gold price, lower inflation, and Guyana’s rapidly developing economy.
“The Oko West Feasibility Study marks a major milestone in realizing the value of what we consider one of the world’s most exciting undeveloped gold projects. It confirms a long-life, high-margin operation with strong economics, supported by a proven resource and solid infrastructure,” commented Louis-Pierre Gignac, President & Chief Executive Officer. “With Tocantinzinho nearing nameplate capacity and generating meaningful free cash flow, GMIN is well positioned to advance Oko West using the same experienced team and disciplined execution that delivered our first mine ahead of schedule and on budget. We remain committed to responsible development and look forward to deepening our partnership with the Government of Guyana and local communities as we advance Oko West as our second cornerstone asset.”
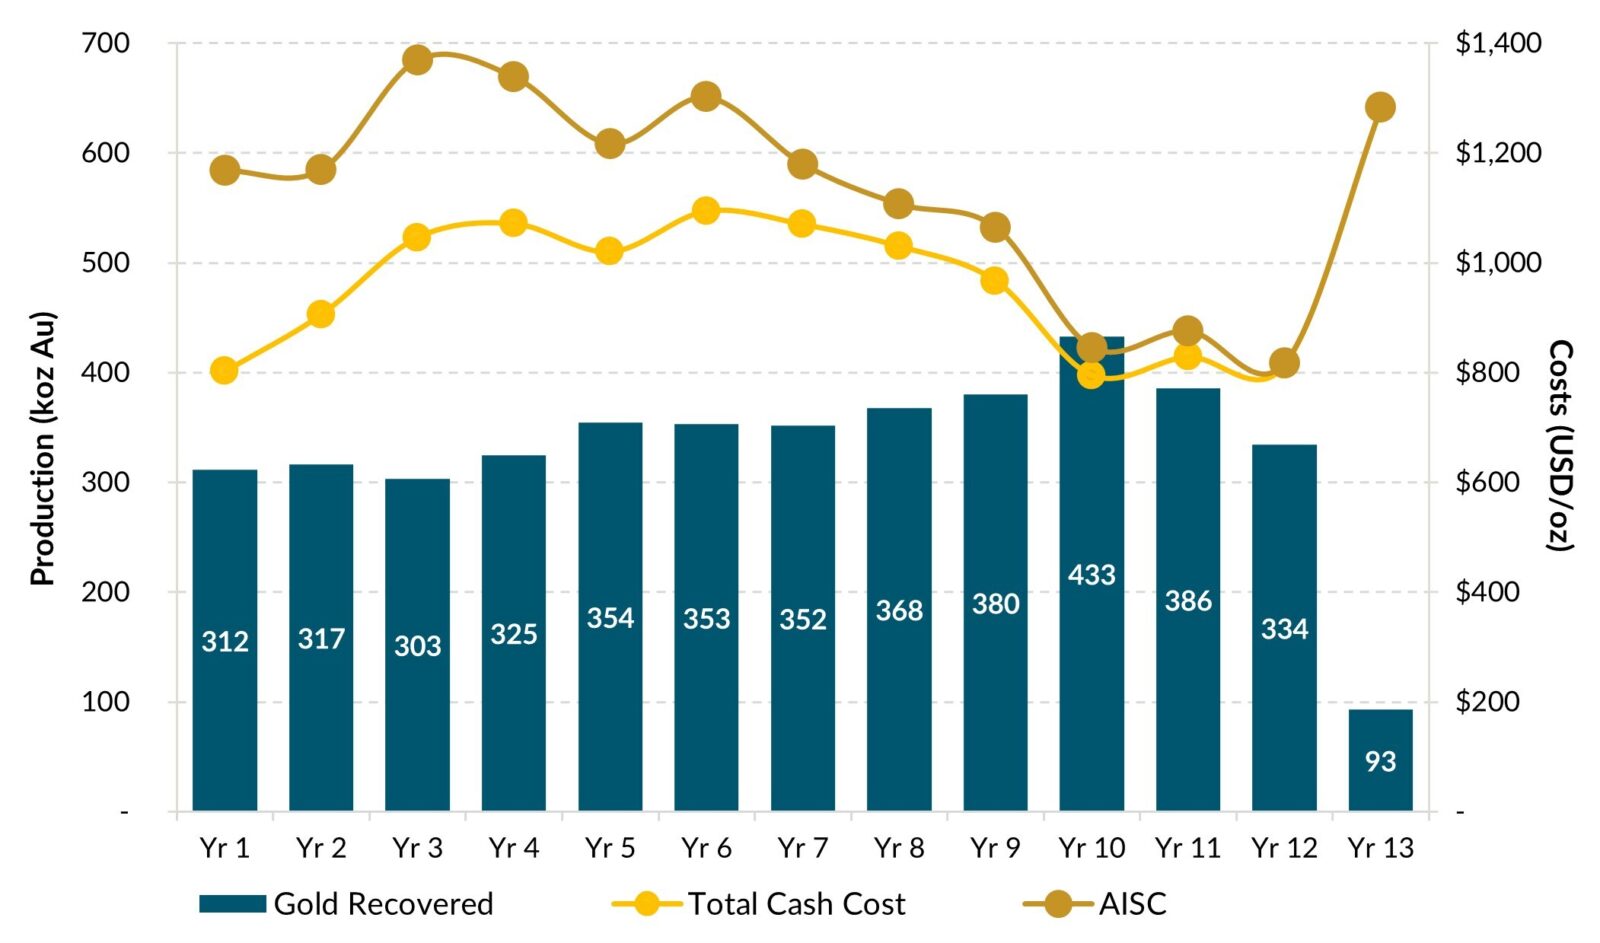
Figure 1: Average Annual Gold Production and Operating Costs (CNW Group/G Mining Ventures Corp)
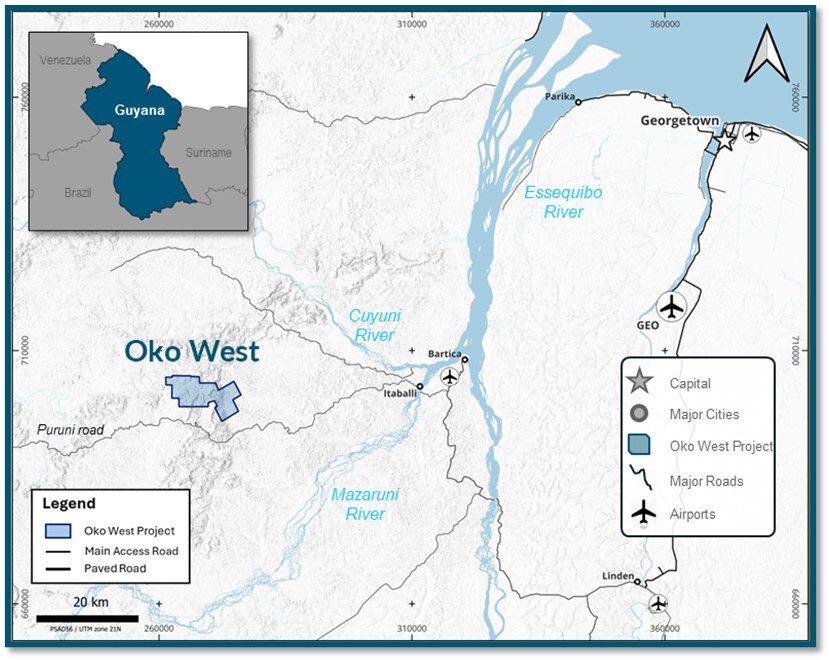
Figure 2: Project Location Map (CNW Group/G Mining Ventures Corp)
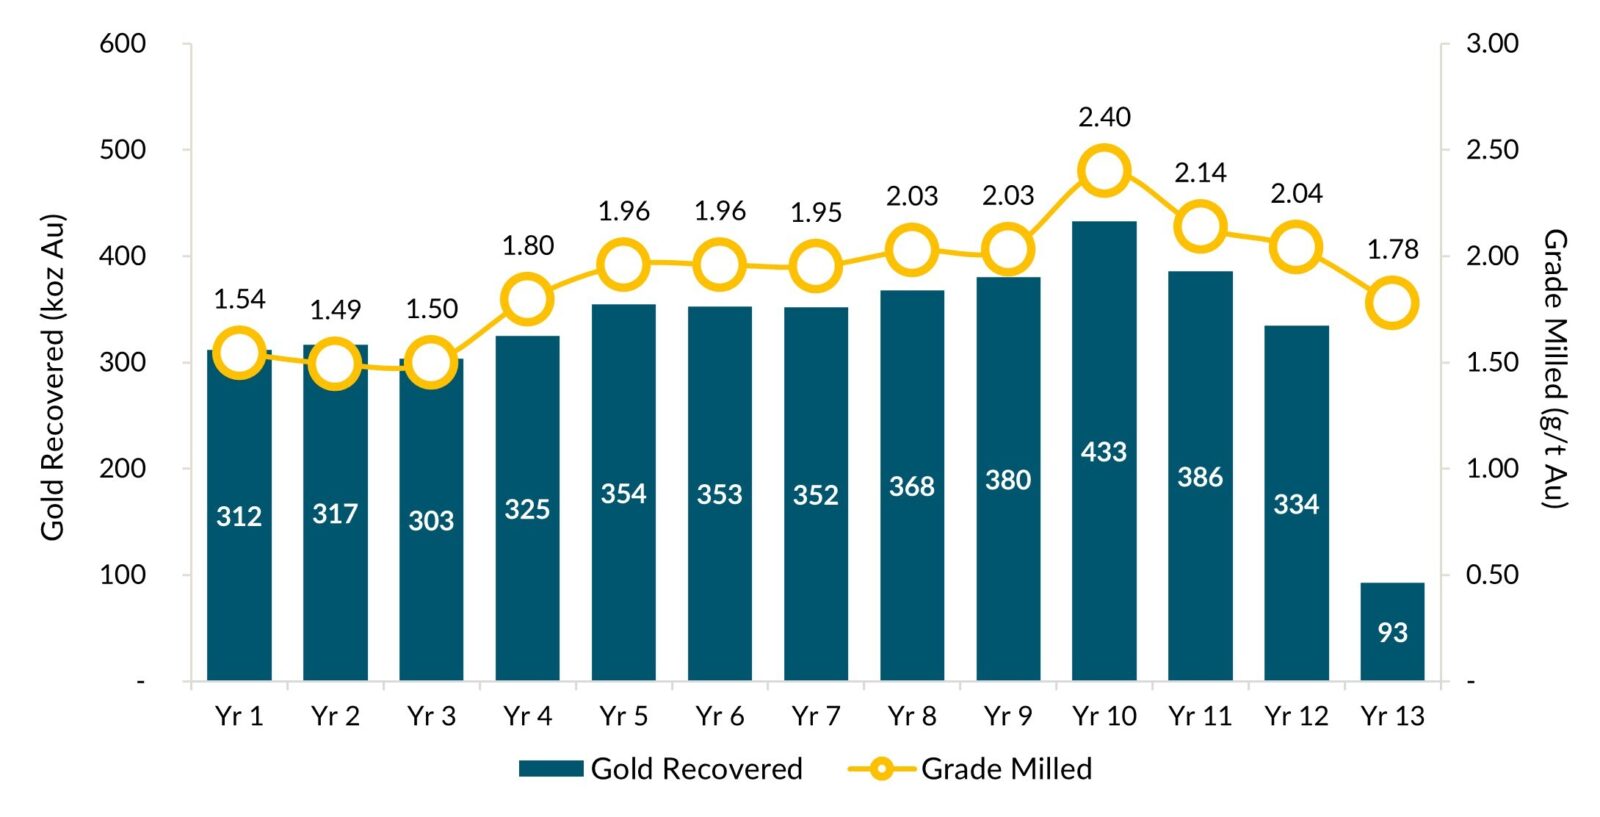
Figure 3: Gold Production Profile (CNW Group/G Mining Ventures Corp)
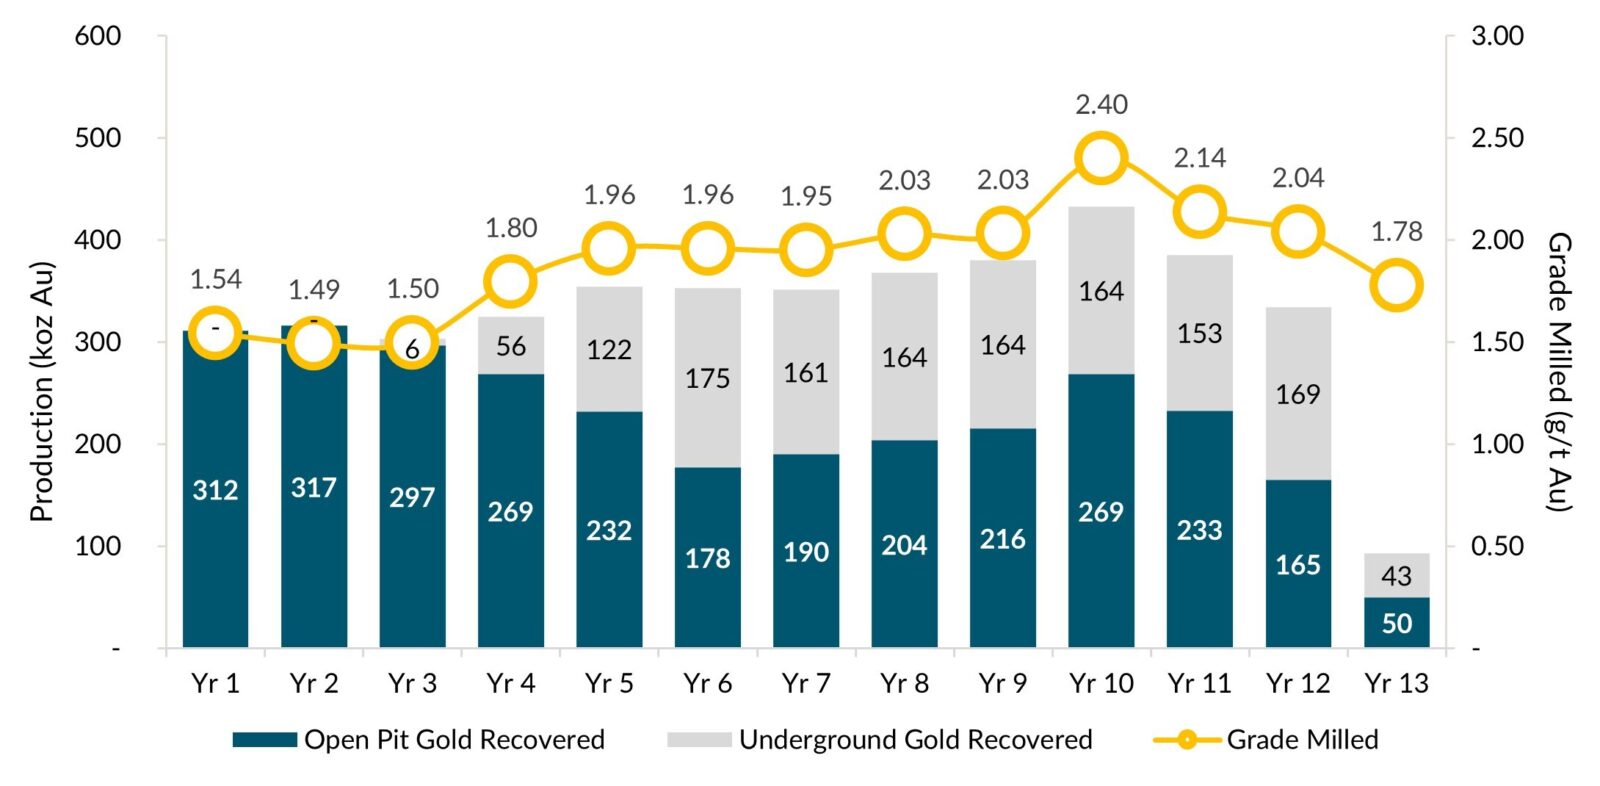
Figure 4: Gold Production Profile by Feed Source (CNW Group/G Mining Ventures Corp)
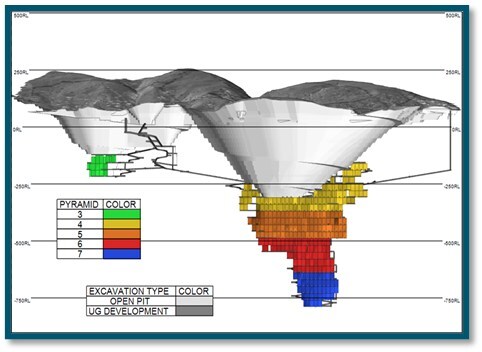
Figure 5: Open-Pit and Underground Mine Development Plan (CNW Group/G Mining Ventures Corp)
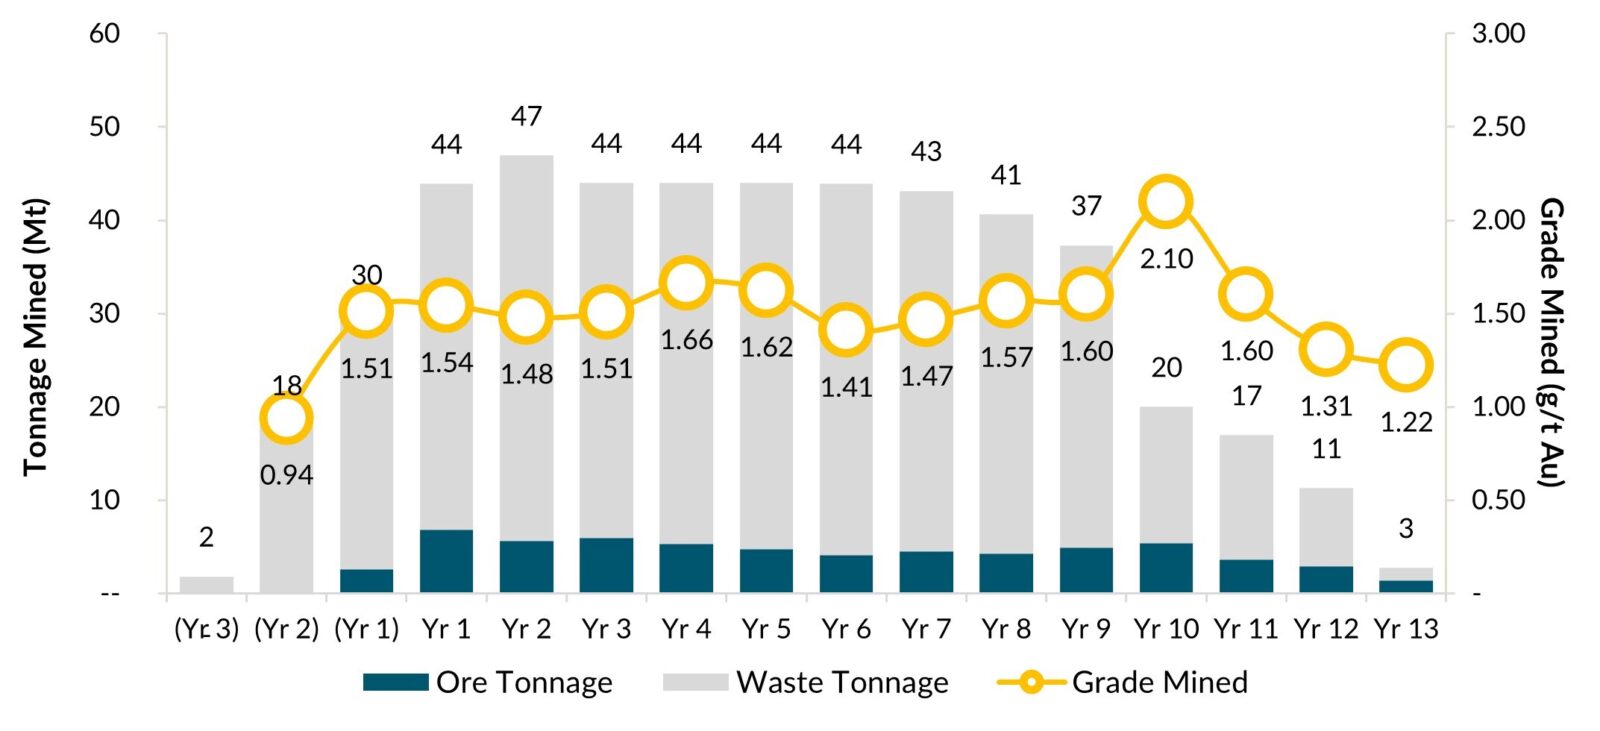
Figure 6: Annual Open Pit Mine Production (CNW Group/G Mining Ventures Corp)
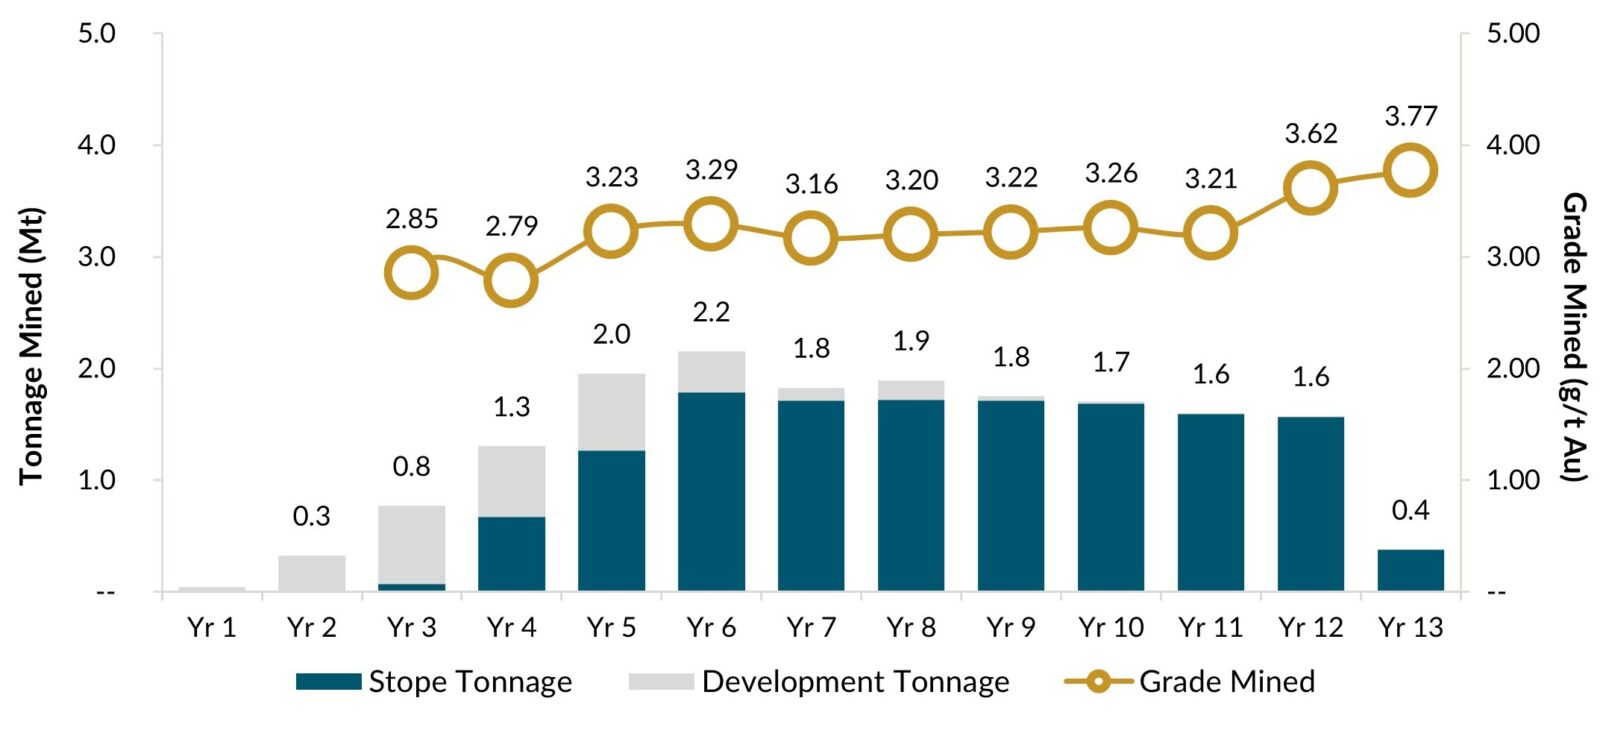
Figure 7: Annual Underground Mine Production (CNW Group/G Mining Ventures Corp)
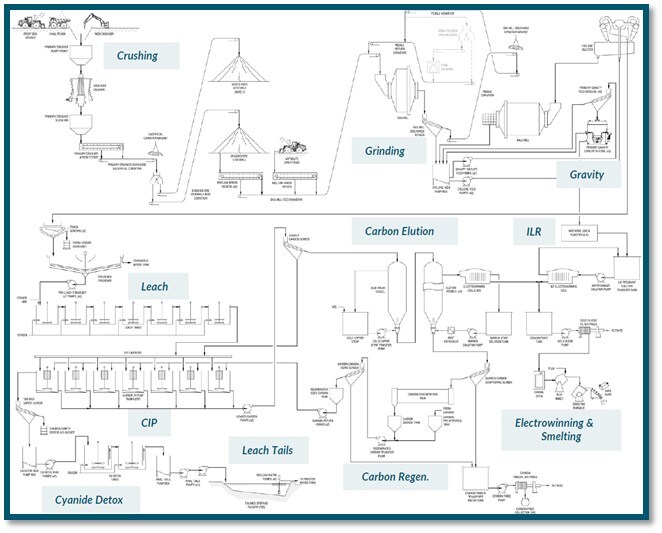
Figure 8: Process Flowsheet (CNW Group/G Mining Ventures Corp)
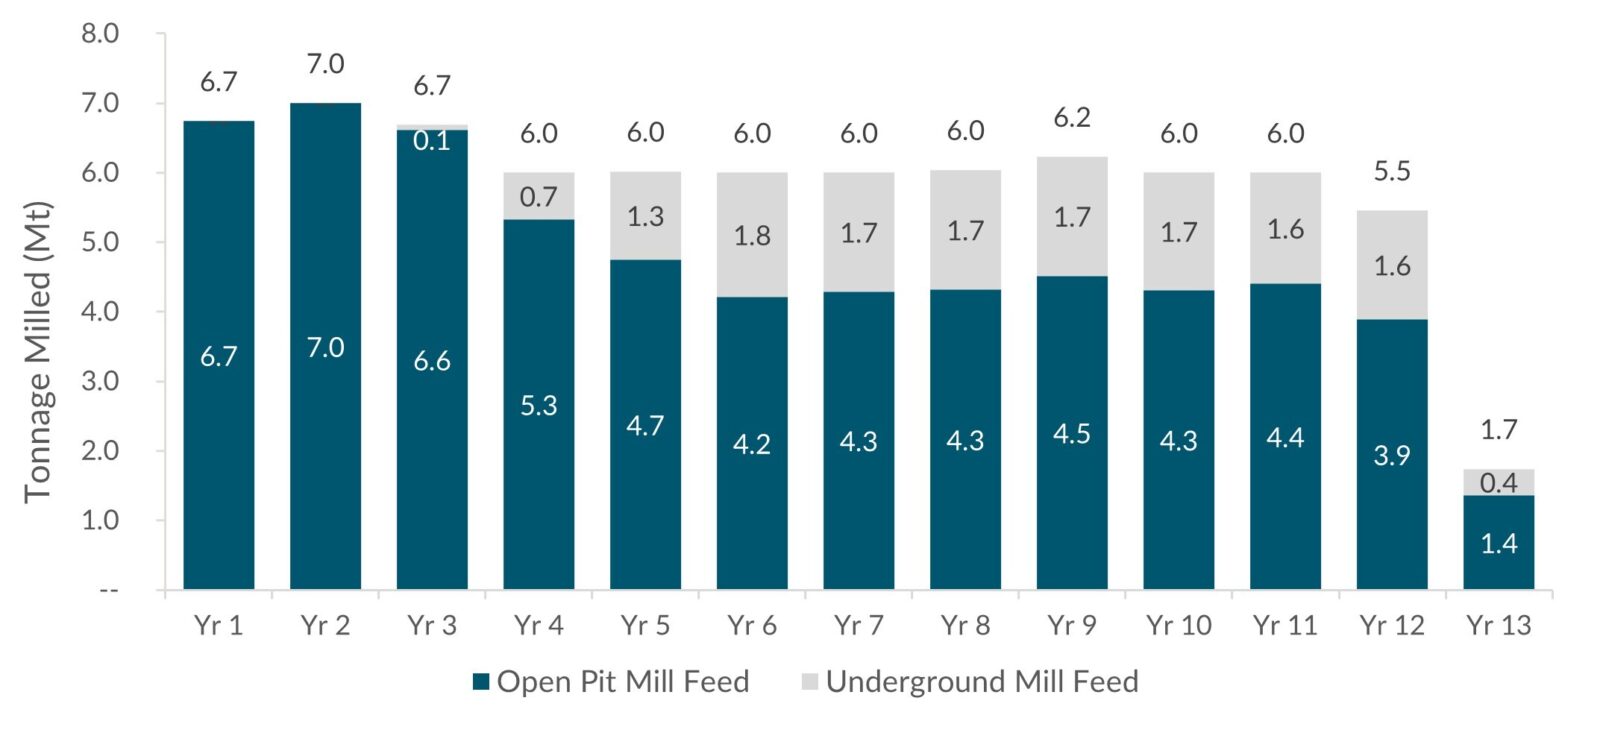
Figure 9: Milling Schedule by Feed Source (CNW Group/G Mining Ventures Corp)
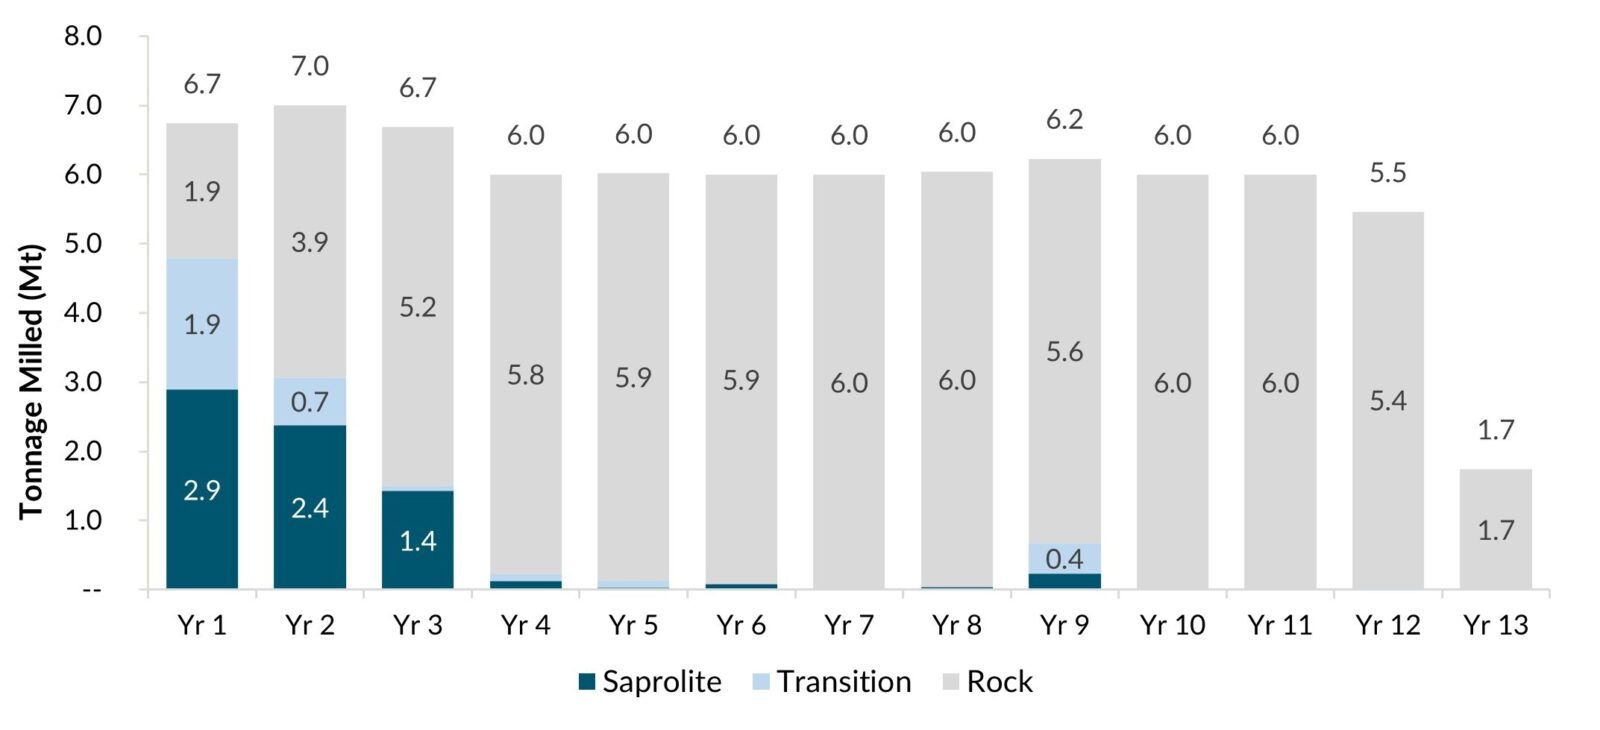
Figure 10: Milling Schedule by Ore Type (CNW Group/G Mining Ventures Corp)
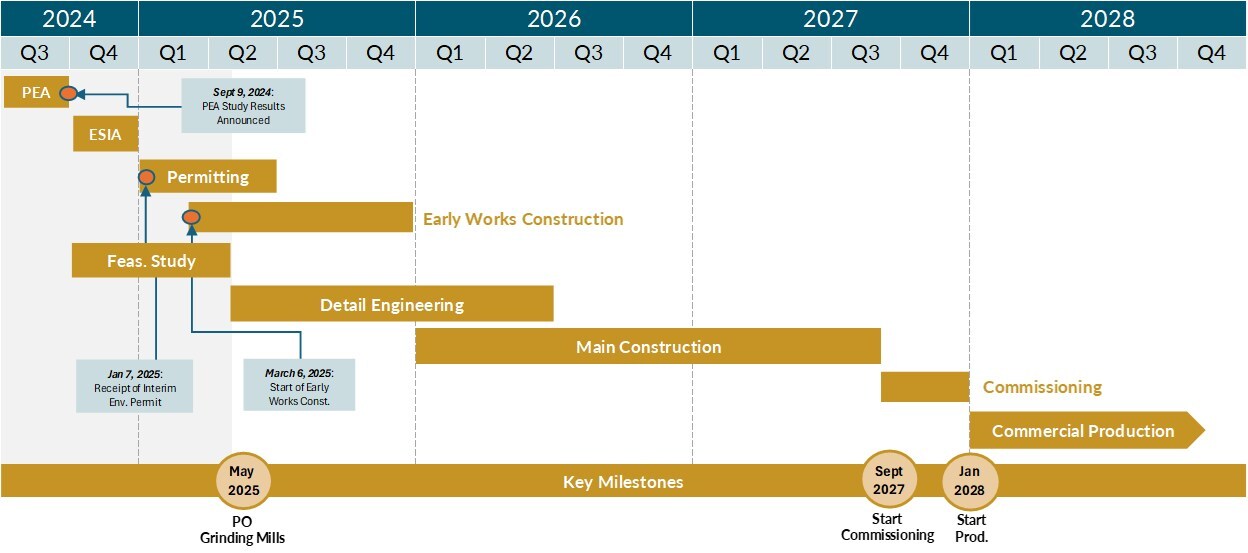
Figure 11: Project Schedule (CNW Group/G Mining Ventures Corp)
Table 1: Oko West Feasibility Study Highlights
| Description | Units | FS | PEA | Δ (%) |
| Production Data | ||||
| OP Mill Feed Tonnage | Mt | 62 | 61 | +2 % |
| UG Mill Feed Tonnage | Mt | 14 | 15 | (5 %) |
| Total Mineralized Material Mined | Mt | 77 | 75 | +2 % |
| Total Waste Mined (OP and UG) | Mt | 429 | 367 | +17 % |
| Total Tonnage Mined (OP and UG) | Mt | 506 | 443 | +14 % |
| Strip Ratio | waste: ore | 6.8 | 6.0 | +14 % |
| Average Milling Throughput | Mtpa | 6.2 | 6.0 | +3 % |
| Average Milling Throughput | tpd | 16,911 | 16,110 | |
| Gold Head Grade | g/t | 1.89 | 2.00 | (6 %) |
| OP Head Grade | g/t | 1.57 | 1.72 | (9 %) |
| UG Head Grade | g/t | 3.26 | 3.19 | +2 % |
| Contained Gold | koz | 4,642 | 4,848 | (4 %) |
| Average Recovery | % | 93.5 % | 92.8 % | +1 % |
| Total Gold Production | koz | 4,340 | 4,500 | (4 %) |
| Mine Life | years | 12.3 | 12.7 | (3 %) |
| Average Annual Gold Production | oz | 350,000 | 353,000 | (1 %) |
| Operating Costs (Average LOM) | ||||
| Total Site Costs | USD/oz | $798 | $728 | +10 % |
| Government Royalties (6.4%)* | USD/oz | $160 | $126 | +27 % |
| Total Operating Cost* | USD/oz | $958 | $853 | +12 % |
| All-In Sustaining Costs* | USD/oz | $1,123 | $986 | +14 % |
| Capital Costs | ||||
| Total Upfront Capital Cost | USD M | $972 | $936 | +4 % |
| Initial UG Capital Costs (Sustaining Capital) | USD M | $68 | $124 | (45 %) |
| OP and UG Sustaining Capital | USD M | $582 | $413 | +41 % |
| Life of Mine Sustaining Capital | USD M | $650 | $537 | +21 % |
| Closure Costs | USD M | $39 | $37 | +5 % |
| Total Capital Costs | USD M | $1,661 | $1,510 | +10 % |
| Financial Evaluation | ||||
| Gold Price Assumption | USD/oz | $2,500 | $1,950 | |
| After-Tax NPV5% | USD M | $2,163 | $1,367 | |
| After-Tax IRR | % | 27 % | 21 % | |
| Payback | Years | 2.9 | 3.8 |
*Note: Assumes $2,500 per ounce base case gold price for calculating Government Royalty ($160 per ounce), which impacts Total Operating Costs and AISC in FS evaluation. PEA assumed a $1,950 base case gold price for the calculation ($126 per ounce). Government Royalty rate has not changed.
Table 2: Sensitivity Analysis
| Downside | Base | Upside | ||
| Scenario | Case | Case | Case | |
| Gold Price | USD/oz | $2,000 | $2,500 | $3,000 |
| After Tax NPV5% | USD M | $1,155 | $2,163 | $3,169 |
| Payback | Years | 4.4 Years | 2.9 Years | 2.1 Years |
| After-Tax IRR | % | 18 % | 27 % | 35 % |
| Average Annual EBITDA | USD M | $375 | $538 | $702 |
| Average Annual Free Cash Flow | USD M | $265 | $388 | $511 |
| LOM EBITDA | USD M | $4,606 | $6,622 | $8,638 |
| LOM Free Cash Flow | USD M | $3,253 | $4,767 | $6,281 |
Note: Average annual figures represent the 12.3-year operating period.
Table 3: Sensitivity Analysis cont’d
| After Tax | Average Annual | ||||
| Gold Price | NPV5% | IRR | Payback | EBITDA | FCF |
| (USD/oz) | (USD M) | ( %) | (years) | (USD M) | (USD M) |
| $1,400 | ($86) | 4 % | 9.9 | $178 | $117 |
| $1,600 | $337 | 9 % | 7.6 | $243 | $166 |
| $1,800 | $748 | 14 % | 5.7 | $309 | $215 |
| $2,000 | $1,155 | 18 % | 4.4 | $375 | $265 |
| $2,200 | $1,558 | 22 % | 3.7 | $440 | $314 |
| $2,400 | $1,961 | 25 % | 3.1 | $506 | $363 |
| $2,500 | $2,163 | 27 % | 2.9 | $538 | $388 |
| $2,600 | $2,364 | 29 % | 2.7 | $571 | $412 |
| $2,800 | $2,767 | 32 % | 2.3 | $637 | $461 |
| $3,000 | $3,169 | 35 % | 2.1 | $702 | $511 |
| $3,200 | $3,571 | 38 % | 1.9 | $768 | $560 |
| $3,400 | $3,974 | 40 % | 1.7 | $833 | $609 |
| $3,600 | $4,376 | 43 % | 1.6 | $899 | $658 |
| $3,800 | $4,778 | 45 % | 1.5 | $965 | $708 |
| $4,000 | $5,181 | 48 % | 1.4 | $1,030 | $757 |
Note: Average annual figures represent the 12.3-year operating period.
FS Summary
The Corporation retained G Mining Services Inc. as lead consultants, along with other engineering consultants, to complete the Study and prepare a technical report in compliance with National Instrument 43-101 Standards of Disclosure for Mineral Projects.
The Study is derived using the Corporation’s mineral resource estimate effective as at September 15, 2024. The effective date of the FS is April 28, 2025, and a NI 43-101 compliant technical report will be filed on the Corporation’s website and under its SEDAR+ profile within 45 days of this news release.
Property Description, Location and Access
Guyana is a mining friendly country with active gold and bauxite mines. Oko West is an advanced-stage gold development project, which straddles the Cuyuni-Mazaruni Mining Districts (administrative Region 7) in north central Guyana, South America. The Project is located approximately 120 kilometres southwest of Georgetown, the capital city of Guyana and approximately 50 km west of Bartica, the capital city of Region 7 (Figure 2). Bartica is a small town with approximately 17,000 people and is known as the gateway to the country’s interior and its gold mining regions.
The Project can be accessed via numerous methods: helicopter direct from Ogle airport to the site, fixed-wing plane from Ogle airport to Bartica airstrip, by car and then speedboat, or by four-wheel drive vehicle. An air strip on site will be built to service the Project. From the town of Itaballi at the confluence of the Cuyuni and Mazaruni rivers, one can use the Puruni or the Aremu laterite roads, using four-wheel drive vehicles. Bartica is accessible by a 20-minute direct flight from the Ogle airport in Georgetown or by road and boat from Parika on the Essequibo River. There are regular boat services between Bartica and Parika.
The climate is equatorial and humid. The Project operated throughout the year without any interruptions related to the weather. The total surface area of the property is 71 km2.
Updated Mineral Resource Estimate
Indicated mineral resources total 80.3 million tonnes at an average gold grade of 2.10 grams per tonne for 5.4 million contained ounces of gold. Gold contained in the indicated category represents 93% of the global resource. Inferred resources total 5.1 Mt at an average gold grade of 2.36 g/t Au, for 0.4 Moz Au.
The MRE considers 544 diamond drill holes (including 39 wedged holes), 366 reverse circulation holes, and 59 trenches completed between December 2020 and September 2024. A total of 45,700m has been drilled since the PEA for conversion of inferred mineral resources.
Approximately 90% of the inferred resources have been converted into indicated resources within the pit and about 70% of the underground inferred mineral resources. The remaining underground material will be drilled from underground. This high conversion rate increases confidence in the resource estimation.
Table 4: Mineral Resource Estimate
| Category | Tonnes
(Mt) |
Gold Grade
(g/t Au) |
Contained Gold (koz) |
| Open Pit Resource | |||
| Indicated | 73.0 | 2.00 | 4,689 |
| Inferred | 1.5 | 1.06 | 52 |
| Underground Resource | |||
| Indicated | 7.2 | 3.09 | 718 |
| Inferred | 3.6 | 2.93 | 337 |
| Total Resource | |||
| Indicated | 80.3 | 2.10 | 5,407 |
| Inferred | 5.1 | 2.36 | 390 |
| These Mineral Resources are not Mineral Reserves as they have not demonstrated economic viability. All figures are rounded to reflect the relative accuracy of the estimates. The Mineral Resources described above have been prepared in accordance with the Canadian Institute of Mining, Metallurgy and Petroleum (“CIM”) Standards (2014) and follow Best Practices outlined by the CIM (2019). The qualified person for the estimate is Christian Beaulieu, P. Geo. (OGQ#1072), Consulting geologist for GMS. The estimate has an effective date of September 15, 2024. The lower cut-offs used to report open pit Mineral Resources, constrained by an open pit optimization shell, are 0.30 g/t Au in saprolite and alluvium/colluvium, 0.34 g/t Au in transition, and 0.38 g/t Au in rock. Underground Mineral Resources are reported inside potentially mineable volume and include below cut-off material (stope optimization cut-off grade of 1.35 g/t Au). The cut-off grades are based on a gold price of US$1,950 per troy ounce and show , 94.5%, 93.3% and 93.9% processing recoveries for saprolite and alluvium/colluvium, transition and rock, respectively. | |||
Initial Mineral Reserve Estimate
The Project mine plan is based on Probable Mineral Reserves of 76.6 Mt at an average gold grade of 1.89 g/t Au for 4.64 Moz Au.
Table 5: Mineral Reserve Estimate
| Category | Tonnes (Mt) |
Gold Grade (g/t Au) |
Contained Gold (koz) |
| Open Pit Reserves | |||
| Probable | 62.4 | 1.57 | 3,156 |
| Underground Reserves | |||
| Probable | 14.2 | 3.26 | 1,486 |
| Total Reserves | |||
| Probable | 76.6 | 1.89 | 4,642 |
The Mineral Reserves were estimated using the Canadian Institute of Mining, Metallurgy and Petroleum (CIM) Estimation of Mineral Resources & Mineral Reserves Best Practice Guidelines (Nov 29th, 2019) and CIM Definition Standards for Mineral Resources and Reserves, (May 10th, 2014). The mine design and Mineral Reserve estimate have been completed to a level appropriate for feasibility studies. As such, the Mineral Reserves are based on the Measured and Indicated Mineral Resources and do not include any Inferred Mineral Resources. The Inferred Mineral Resources contained within the mine design are classified as waste. Mineral Reserves are estimated using a long-term gold price of 1,800 $/oz USD. The qualified person for the estimate is Alexandre Burelle, P. Eng. (OIQ#5019855), Mine planning and financial analysis consultant. The estimate has an effective date of April 2, 2025. Mineral Reserves for Open Pit are estimated at a cut-off grade of 0.41, 0.37, and 0.33 g/t Au for Rock, Transition, and Saprolite respectively. The Open Pit Strip Ratio is 6.83:1 and Dilution factor is 14 %. Mineral Reserves for Underground Mine are estimated at a cut-off grade of 1.70 g/t Au. The underground mine dilution factor is 10% including 4% for the backfill. For the underground a minimum mining width of 5 m was used. The numbers may not sum due to rounding; rounding followed the recommendations in NI 43-101. The mine design and Mineral Reserve estimate have been completed to a level appropriate for feasibility studies. The Mineral Reserve estimate stated herein is consistent with the CIM definitions and is suitable for public reporting.
Production Profile
The FS outlined an average annual gold production profile of 350,000 oz Au over the 12.3-year mine life. Total gold production is 4.34 Moz Au with an average gold grade milled of 1.89 g/t Au, and an average metallurgical recovery of 93.5%.
During the initial three years of commercial production, the processing feed will solely be supplied by the open pit. Starting in the fourth year of production, underground mining begins to contribute to processing feed, and the UG operation is expected to achieve targeted production rates of 4,500 tonnes per day by the sixth year. Over the LOM, UG ore represents 32% of total gold recovered.
LOM open pit average annual gold production totals 238,000 oz Au with an average grade of 1.57g/t Au, while LOM underground average annual gold production totals 112,000 oz Au with an average grade of 3.26 g/t Au.
Table 6: Gold Production by Mill Feed Type
| Open Pit | Underground | Total OP + UG | |||||||
| Material | Grade | Contained | Material | Grade | Contained | Contained | Gold | ||
| Milled | Milled | Gold | Milled | Milled | Gold | Gold | Recovery | Recovered | |
| Year | (kt) | (g/t) | (koz) | (kt) | (g/t) | (koz) | (koz) | ( %) | (koz) |
| Year 1 | 6,741 | 1.54 | 335 | – | – | – | 335 | 93 % | 312 |
| Year 2 | 7,000 | 1.49 | 336 | – | – | – | 336 | 94 % | 317 |
| Year 3 | 6,616 | 1.48 | 316 | 71 | 2.85 | 7 | 322 | 94 % | 303 |
| Year 4 | 5,327 | 1.67 | 286 | 673 | 2.79 | 60 | 347 | 94 % | 325 |
| Year 5 | 4,748 | 1.62 | 247 | 1,269 | 3.23 | 132 | 379 | 94 % | 354 |
| Year 6 | 4,213 | 1.40 | 189 | 1,787 | 3.29 | 189 | 378 | 93 % | 353 |
| Year 7 | 4,289 | 1.47 | 202 | 1,711 | 3.16 | 174 | 376 | 93 % | 352 |
| Year 8 | 4,316 | 1.56 | 217 | 1,723 | 3.20 | 177 | 394 | 93 % | 368 |
| Year 9 | 4,519 | 1.58 | 230 | 1,711 | 3.22 | 177 | 407 | 93 % | 380 |
| Year 10 | 4,309 | 2.06 | 286 | 1,691 | 3.26 | 177 | 463 | 94 % | 433 |
| Year 11 | 4,405 | 1.75 | 248 | 1,595 | 3.21 | 165 | 413 | 93 % | 386 |
| Year 12 | 3,887 | 1.41 | 176 | 1,570 | 3.62 | 183 | 358 | 93 % | 334 |
| Year 13 | 1,360 | 1.22 | 53 | 380 | 3.77 | 46 | 100 | 93 % | 93 |
| Total | 61,730 | 1.57 | 3,121 | 14,181 | 3.26 | 1,486 | 4,607 | 94 % | 4,310 |
Note: Excludes mill feed during pre-production period.
Mining
The Project is planned as a mining operation that integrates both conventional open pit mining and mechanized long hole open stoping for the underground mine. Combined, a total of 76.6 Mt of ore will be mined at an average diluted gold grade of 1.89 g/t Au.
The main OP is centered on Block 4 with one smaller sub-pit positioned on a southern extension to the main pit. A total of 62.4 Mt of ore will be mined from the OP at an average diluted gold grade of 1.57 g/t Au, representing 81% of total mill feed. Approximately 0.6 Mt of this material will be milled during the pre-production period. A total of 426.2 Mt of combined waste and overburden will be extracted, resulting in a strip ratio of 6.8. The OP operation will be executed with an owner-operated mining fleet using four mining phases over a period of 15 years, which includes just over two years of pre-production. Open pit mining will utilize a fleet of 22 m³ hydraulic excavators paired with 139-tonne haul trucks as the primary production equipment.
The UG operation will take place in two zones: the main zone, located directly under the main open pit, and one satellite zone, both accessible from a surface mine portal through the same decline ramp. To enhance operational flexibility and meet the targeted production levels, the zones will be segmented into multiple mining horizons, enabling concurrent development and production activities across several horizons.
The long hole open stoping mining method will be used, including transverse stoping and longitudinal stoping variations. The average UG production rate is expected to be 4,500 tpd of ore, with 4,000 tpd and 500 tpd from stope production and lateral development, respectively. A total of 14.2 Mt of ore is expected to be mined at an average diluted gold grade of 3.26 g/t Au, representing 19% of total mill feed. The UG mine is expected to be in production for 12 years, including a two-year development period. The initial 2 years of construction and development will use owner-operated mining supported by contract mining initially. The primary production equipment for UG mining will include a fleet of 21-tonne load-haul-dump units and 63-tonne haul trucks.
Processing and Recovery
The proposed process plant design for Oko West is based on a standard metallurgical flowsheet to treat gold bearing material and produce doré. The process plant is designed to nominally treat 6.0 million tonnes per annum of rock and will consist of comminution, gravity concentration, cyanide leach and adsorption via CIP, carbon elution and gold recovery circuits. CIP tailings will be treated in a cyanide destruction circuit and pumped to a tailings storage facility.
The nominal milling rate will be initially set at 7.0 Mtpa to treat a blend of hard rock, saprolite and transition ores during the open pit operational period. The ramp-up period is five months, and the mill will operate for 12.3 years.
Table 7: Metallurgical Recoveries
| Feed | Total | Mill | |
| Grade | Recovery | Feed | |
| Feed Material | (g/t Au) | ( %) | ( %) |
| Saprolite | 1.28 | 95 % | 10 % |
| Transition | 1.43 | 92 % | 5 % |
| Rock – Open Pit | 1.63 | 94 % | 67 % |
| Rock – Underground | 3.26 | 93 % | 19 % |
| Total LOM | 1.89 | 93 % | 100 % |
Power
Plant site activities, including the process plant, UG mine, OP mine, and balance of plant infrastructure, will require an average of 46 megawatts at full operation. The Project’s base case scenario considers installing a dedicated Heavy Fuel Oil fired power plant. The power plant is anticipated to comprise six 9.3 MW engine generating sets, totaling 55.8 MW installed capacity and 46.5 MW running capacity. This assumes that one of the generators would be on standby. One additional genset is planned in sustaining capital to allow for major maintenance activities.
Environmental and Permitting
The Environmental Impact Assessment was formally submitted to Guyana’s Environmental Protection Agency in late December 2024 and remains under review. The necessary permits covering the construction of the mine, processing plant, port, HFO power generation, and access road, will be issued after the EPA’s review.
In mid-December 2024, GMIN received an Interim Environmental Permit from the EPA authorizing the commencement of early works construction activities. The Corporation is advancing key supporting infrastructures to support full construction, including the installation of water and sewage treatment systems, camp, access roads and wharf area for logistics.
Public consultation meetings were held in January and February 2025 in local communities, providing critical input for the development of environmental and social programs aligned with regional sustainability priorities. GMIN is currently finalizing responses to all requests for clarification and supplementary information, which are expected to be submitted to the EPA by the end of April.
Final environmental approval and the construction permit are expected in Q2 2025.
In parallel, GMIN has initiated applications for other key regulatory authorizations required for the Project’s implementation, including the Mining License, port operation, permits for fuel use and storage, and approvals for the installation of transmission and telecommunications towers. These complementary permits will support full-scale construction and operational readiness. All permitting efforts are guided by proactive stakeholder engagement and adherence to international environmental and social performance standards.
Operating Costs
LOM operating costs are estimated at $798 per ounce of gold produced, excluding royalty costs, as summarized below. The LOM AISC is estimated to be $1,123 per ounce of gold produced based on average annual gold production of 350,000 ounces over the 12.3-year LOM.
Table 8: Operating Cost and AISC Summary
| Mining Costs | Unit Cost | Unit Cost | |
| (USD/t mined) | (USD/oz) | ||
| Mining Costs – OP | $2.39 | $243 | |
| Mining Costs – UG | $55.34 | $182 | |
| Operating Costs | Unit Cost | Unit Cost | |
| (USD/t milled) | (USD/oz) | ||
| Mining Costs – OP | $13.81 | $243 | |
| Mining Costs – UG | $10.34 | $182 | |
| Processing Costs | $7.24 | $128 | |
| Power Costs | $7.95 | $140 | |
| G&A Costs | $5.49 | $97 | |
| Transport & Refining | $0.45 | $8 | |
| Total Site Cost | $45.29 | $798 | |
| Royalty Costs (6.4%) | $9.05 | $160 | |
| Total Operating Costs | $54.34 | $958 | |
| Sustaining Capex | $8.56 | $151 | |
| Closure Costs | $0.51 | $9 | |
| Land Payments | $0.29 | $5 | |
| AISC | $63.70 | $1,123 | |
Note: Total Cash Costs and AISC are non-GAAP measures and include royalties payable.
Project Royalties
The FS considers two federal government royalties:
The production profile results in a weighted average royalty rate of 6.4%.
Capital Cost Estimates
The initial capital cost is estimated to be $972 million after accounting for $69 million in pre-production credits. A 9% contingency totaling $85 million is included in the estimate. Underground-related capex is captured in sustaining capex, with ramp development to be initiated in the first year of operations.
The total construction period, including the early works program, is forecast to be 34 months with commissioning scheduled for the last quarter of 2027.
Table 9: Capital Cost Summary
| Initial CAPEX | USD M |
| Infrastructure | $106 |
| Power & Electrical | $111 |
| Water Management | $23 |
| Surface Operations | $41 |
| Mining | $104 |
| Process Plant | $192 |
| Construction Indirects | $135 |
| General Services / Owner’s Costs | $137 |
| Pre-Production, Start-up & Commissioning | $108 |
| Contingency (9%) | $85 |
| Capital Costs | $1,041 |
| Less: Pre-Prod. Credit net of TC/RC (1) & Royalties ($2,500/oz) | ($69) |
| Total Capital Costs | $972 |
(1) Treatment charges/Refining charges
The sustaining capex is estimated to be $650 million, before including $39 million of closure and rehabilitation costs, split between open pit and underground operations. Open pit sustaining capex is earmarked for additional equipment, replacement units, and major repairs. Other sustaining capex captures tailings storage facility raises, process plant, power plant expansion, and General Services.
Table 10: Sustaining Cost Summary
| Sustaining Capex | USD M | USD/oz |
| Open Pit | $299 | $70 |
| Underground (Initial capex) | $68 | $16 |
| Underground | $223 | $52 |
| Other | $60 | $14 |
| Sustaining Capex | $650 | $151 |
| Closure & Rehabilitation | $39 | $9 |
| Total Sustaining Capex | $689 | $160 |
UG sustaining capex totals $291 million and includes lateral and vertical development of the mine, mobile equipment, fixed equipment, construction, and pre-production. The initial two years of construction and development total $68 million (23% of total UG sustaining capex). The table below sets out more details on the underground portion of the sustaining capex.
Table 11: Underground Sustaining Cost Summary
| Underground Sustaining Capex | USD M | USD/oz |
| Lateral Development | $101 | $23 |
| Mobile Equipment | $23 | $5 |
| Construction | $21 | $5 |
| Pre-Production | $82 | $19 |
| Vertical Development | $9 | $2 |
| Fixed Equipment | $36 | $8 |
| Mobile Equipment Rebuild | $1 | $0 |
| Other Equipment | $18 | $4 |
| Total Underground Sustaining Capex | $291 | $67 |
Project Timetable and Next Steps
Corporate Timetable and Next Steps
Upcoming key milestones include:
First Quarter 2025 Results Conference Call and Webcast
GMIN will release its first quarter 2025 results on Wednesday, May 14, 2025, before market open. GMIN’s senior management will host a conference call on the same day, at 9:00 AM (Eastern Time) to discuss the Corporation’s financial and operating results, which will be followed by a Q&A session. Participants may join the conference call using the following call-in details:
Participants can also access a live webcast of the conference call via https://edge.media-server.com/mmc/p/ybh84bka or via the GMIN website at: https://gmin.gold/investors/presentations-and-events/
A replay of this conference call – via phone and webcast – will be available until June 14, 2025. Replay details will be provided on the GMIN website 24 hours after the call at:
https://gmin.gold/investors/presentations-and-events/.
Feasibility Study 3D VRIFY Presentation
To view a 3D VRIFY presentation of the Study please click on the following link:
https://vrify.com/decks/18749 or visit the Corporation’s website at www.gmin.gold.
Updated corporate presentation is available at: https://vrify.com/decks/18738.
Technical Report Preparation and Qualified Persons
The Study has an effective date of April 28, 2025. It was authored by independent Qualified Persons and is in accordance with National Instrument 43-101 – Standards of Disclosure for Mineral Projects.
GMS was responsible for the overall report and FS coordination, property description and location, accessibility, history, mineral processing and metallurgical testing, mineral resource estimation, mining methods, recovery methods, project infrastructures, operating costs, capex, economic analysis and project execution plan. For readers to fully understand the information in this news release, they should read the technical report in its entirety, including all qualifications, assumptions, exclusions and risks. The technical report is intended to be read as a whole and sections should not be read or relied upon out of context.
The Qualified Persons are Paul Murphy, P. Eng. having overall responsibility for the Report including capital and operating costs. Neil Lincoln, P. Eng. having responsibility for metallurgy, recovery methods and process plant operating costs. Christian Beaulieu, MSc, P.Geo., of Minéralis Consulting Services is responsible for property description, geology, drilling, sampling and the mineral resource estimate. Alexandre Burelle, P. Eng. is responsible for the mining method and capital and operating costs related to the mine and the economic analysis. Kevin Leahy, C.Geol., of ERM Ltd., is responsible for the environment and permitting aspects.
The technical content of this press release has been reviewed and approved by the QPs who were involved with preparation of the Study. In addition, Louis-Pierre Gignac, President & Chief Executive Officer of GMIN, a QP as defined in NI 43-101, has reviewed the Study on behalf of the Corporation and has approved the technical disclosure contained in this news release. The FS is summarized into a technical report that is filed on the Corporation’s website at www.gmin.gold and on SEDAR+ at www.sedar.com in accordance with NI 43-101.
About G Mining Ventures Corp.
G Mining Ventures Corp. (TSX: GMIN) (OTCQX: GMINF) is a mining company engaged in the acquisition, exploration and development of precious metal projects to capitalize on the value uplift from successful mine development. GMIN is well-positioned to grow into the next mid-tier precious metals producer by leveraging strong access to capital and proven development expertise. GMIN is currently anchored by the Tocantinzinho Gold Mine in Brazil, followed by the Oko West Project in Guyana, and the Gurupi Project in Brazil — all with significant exploration upside and located in mining-friendly jurisdictions.
Acquisition Adds Indicated Gold Resources of 388koz and Inferred ... READ MORE
Highlights • Hole 26MN-069 returned: o 0.62 g/t gold over 62.21... READ MORE
“Wheaton delivered a strong start to 2026, with Salobo and... READ MORE
VIOR GOLD CORPORATION INC. (TSX-V: VIO) (OTCQB: VIORF) (FRA: VL5)... READ MORE
Gravity-Finish Re-Assay Confirms High-Grade Gold Mineralization a... READ MORE


